. 2017 Feb 28;45(4):1889-1901.
doi: 10.1093/nar/gkw1259.

Extreme mutation bias and high AT content in Plasmodium falciparum

Affiliations

Extreme mutation bias and high AT content in Plasmodium falciparum

William L Hamilton et al. Nucleic Acids Res. .

Abstract

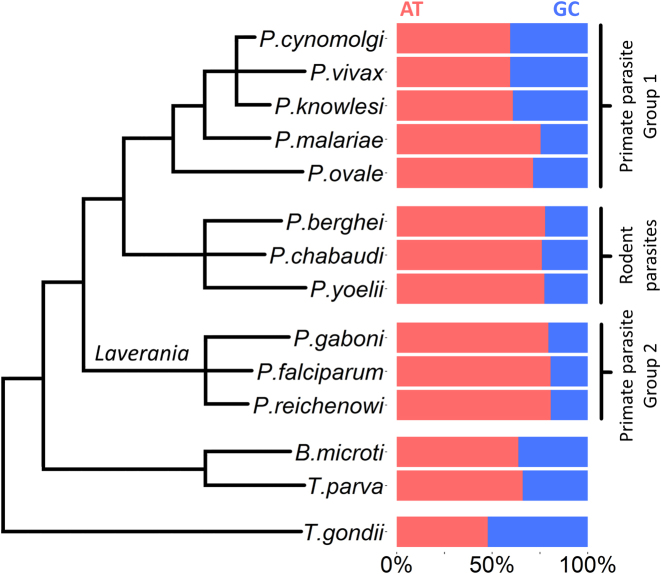
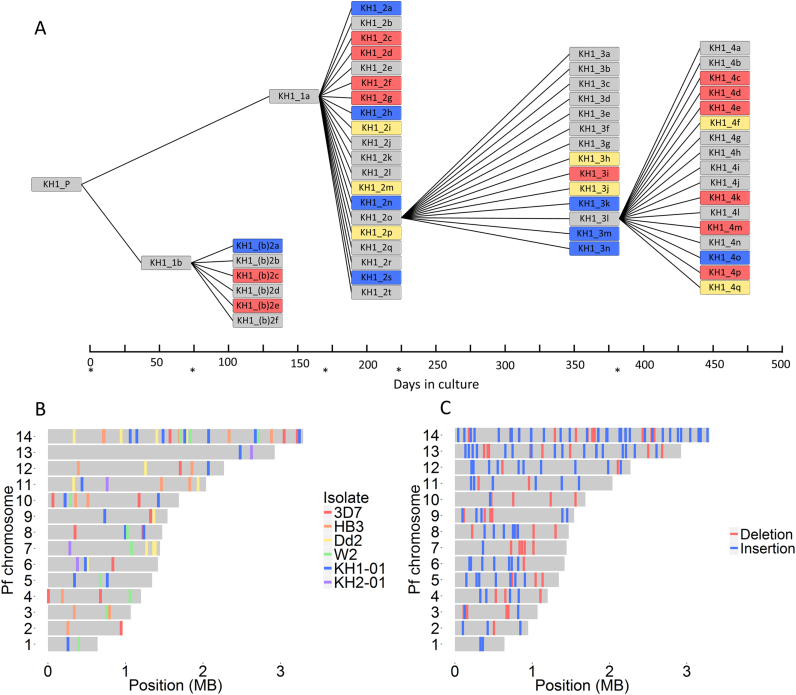
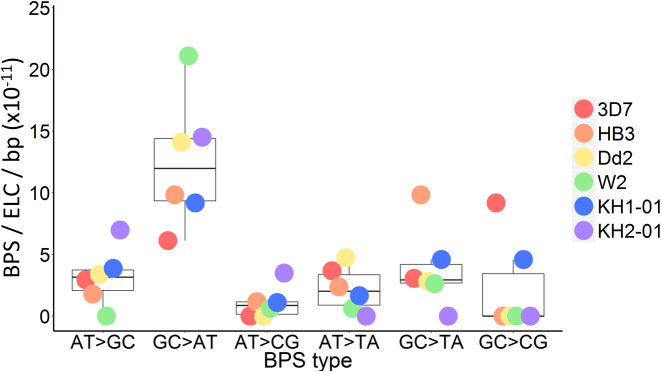
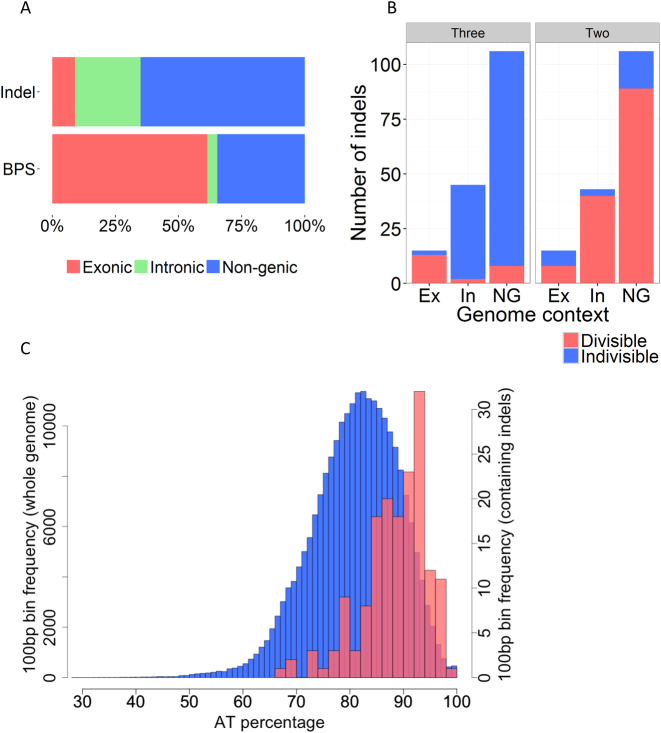
For reasons that remain unknown, the Plasmodium falciparum genome has an exceptionally high AT content compared to other Plasmodium species and eukaryotes in general - nearly 80% in coding regions and approaching 90% in non-coding regions. Here, we examine how this phenomenon relates to genome-wide patterns of de novo mutation. Mutation accumulation experiments were performed by sequential cloning of six P. falciparum isolates growing in human erythrocytes in vitro for 4 years, with 279 clones sampled for whole genome sequencing at different time points. Genome sequence analysis of these samples revealed a significant excess of G:C to A:T transitions compared to other types of nucleotide substitution, which would naturally cause AT content to equilibrate close to the level seen across the P. falciparum reference genome (80.6% AT). These data also uncover an extremely high rate of small indel mutation relative to other species, primarily associated with repetitive AT-rich sequences, in addition to larger-scale structural rearrangements focused in antigen-coding var genes. In conclusion, high AT content in P. falciparum is driven by a systematic mutational bias and ultimately leads to an unusual level of microstructural plasticity, raising the question of whether this contributes to adaptive evolution.


Figures

Figure 1.
Figure 1.
AT content variation in Apicomplexan parasites. Phylogenetic relationships and AT:GC genome proportions are shown for a range of Apicomplexan parasite species. Phylogenetic lines are not to evolutionary scale. AT contents are derived from NCBI genome browser data (http://www.ncbi.nlm.nih.gov/genome/) and shown in Supplementary Table S1. Phylogeny of Plasmodium parasites is based on (42), Figure 1a. Phylogeny of the non-Plasmodium parasites Theileria parva, Babesia microti and Toxoplasma gondii is based on (44).
Figure 2.
Figure 2.
Detecting de novo mutations in mitotic ‘clone trees’. (A) Schematic of the KH1-01 clone tree. Each branch point represents a round of subcloning by limiting dilution, isolating single infected red blood cells, and asexually expanding them until we obtained sufficient amounts of DNA for whole-genome sequencing. The KH1-01 clone tree was cultured for ∼17 months and contained 59 subclone genomes derived from the parent isolate (obtained soon after venous sampling from a patient in Cambodia). Blue = de novo BPS detected; red = pairs of recombining var genes detected; yellow = both BPS and var gene recombination detected; asterisks = clonal dilutions performed. (B) Overall, in the clone trees of six wild-type P. falciparum isolates (3D7, HB3, Dd2, W2, KH1-01 and KH2-01), we identified 85 de novo BPS, 78 of which have known genomic coordinates (shown here). The 78 BPS with known genomic coordinates were distributed across the 14 nuclear chromosomes as expected by chance (P = 0.445, Fisher's exact test). Colors depict the isolate in which the BPS occurred. (C) We identified 164 de novo indels in the 3D7 clone tree, all of which have known genomic coordinates (shown here). Like BPS, indel distribution between the 14 chromosomes did not differ significantly from what is expected by chance (P = 0.194, Pearson's Chi-squared test). Insertions (n = 108) and deletions (n = 56) are colored blue and red, respectively.
Figure 3.
Figure 3.
Base pair substitution spectrum across all isolates. Boxplots show the median rate of each base pair substitution (BPS) type with first and third quartiles, while coloured dots indicate that value for each isolate. ELC = erythrocytic life cycle; bp = base pair.
Figure 4.
Figure 4.
Indel distribution, size and AT content. (A) Relative distributions of indels and BPS in exons (Ex, red), introns (In, green) and non-genic loci (NG, blue). Indels (164 total from the 3D7 clone tree) were overrepresented in non-coding regions (non-genic and intronic), with only a small minority of indels (15/164, 9.1%) found in exons. In contrast, the distribution of BPS (78 pooled from all clone trees with known BPS coordinates) was similar to the underlying proportions of exonic, intronic, and non-genic sequence in the P. falciparum genome (raw data in Table 3). (B) Indel distribution in exonic, intronic, and non-genic loci, showing the number of indels whose nucleotide lengths are divisible (red) or indivisible (blue) by three (left) or two (right). Indels that are multiples of three preserve the reading frame when they occur in exons, and are overrepresented in exons compared with introns and non-genic loci (Table 4). In contrast, indels that are multiples of two bp are overrepresented from what is expected by chance in non-coding loci, reflecting the abundance of poly(AT) tracts in non-coding loci. (C) The 3D7 genome was divided into non-overlapping 100 bp bins, with the % AT content calculated for each bin and plotted as a histogram (blue bars, y-axis scale on left). The % AT content of the subset of all bins containing at least one indel was plotted separately (red bars, y-axis scale on right). The 100bp windows containing indels had a higher average AT content than those for the whole genome (88.1% and 80.6%, respectively) (P < 2.2 × 10⁻¹⁶, two-sample Welch t-test). Ex = Exon, In = Intron, NG = non-genic.
Figure 5.
Figure 5.
Base pair substitution (BPS, red) and var exon 1 recombination rates (blue) shown per erythrocytic life cycle (ELC) in all isolates. BPS rates did not differ significantly between the different isolates, nor between the pooled long-term culture-adapted laboratory isolates (3D7, HB3 and Dd2) and the combined Cambodian isolates (KH1-01 and KH2-01) (all pairwise comparisons by two-sample Welch t-test). In contrast, the combined var gene exon 1 recombination rate in the Cambodian field isolates was significantly higher than for the combined laboratory isolates (P = 0.0306, two-sample Welch t-test after Bonferroni correction for multiple comparisons). The KH1-01 var exon 1 recombination rate was 6.40 × 10⁻³ (95%CI 4.30 × 10⁻³–8.51 × 10⁻³) recombining var pairs per ELC, or one parasite with recombined var genes for every 156 (95%CI 117–233) parasites following a single 48-h ELC. Error bars show standard error of the mean.

Similar articles

Cited by

References

    1. Fairhurst R.M. Understanding artemisinin-resistant malaria: what a difference a year makes. Curr. Opin. Infect. Dis. 2015; 28:417–425. - PMC - PubMed
    1. Gardner M.J., Hall N., Fung E., White O., Berriman M., Hyman R.W., Carlton J.M., Pain A., Nelson K.E., Bowman S. et al. . Genome sequence of the human malaria parasite Plasmodium falciparum. Nature. 2002; 419:498–511. - PMC - PubMed
    1. Nikbakht H., Xia X., Hickey D.A.. The evolution of genomic GC content undergoes a rapid reversal within the genus Plasmodium. Genome. 2015; 57:507–511. - PubMed
    1. Pizzi E., Frontali C.. Low-complexity regions in Plasmodium falciparum proteins. Genome Res. 2001; 11:218–229. - PMC - PubMed
    1. Zilversmit M.M., Volkman S.K., Depristo M.a., Wirth D.F., Awadalla P., Hartl D.L.. Low-complexity regions in plasmodium falciparum: Missing links in the evolution of an extreme genome. Mol. Biol. Evol. 2010; 27:2198–2209. - PMC - PubMed

Publication types