

Non-genetic diversity modulates population performance
- PMID: 27994041
- PMCID: PMC5199129
- DOI: 10.15252/msb.20167044
Non-genetic diversity modulates population performance
Erratum in
-
Non-genetic diversity modulates population performance.Mol Syst Biol. 2018 Jan 10;14(1):e8149. doi: 10.15252/msb.20178149. Mol Syst Biol. 2018. PMID: 29321185 Free PMC article.
Abstract
Biological functions are typically performed by groups of cells that express predominantly the same genes, yet display a continuum of phenotypes. While it is known how one genotype can generate such non-genetic diversity, it remains unclear how different phenotypes contribute to the performance of biological function at the population level. We developed a microfluidic device to simultaneously measure the phenotype and chemotactic performance of tens of thousands of individual, freely swimming Escherichia coli as they climbed a gradient of attractant. We discovered that spatial structure spontaneously emerged from initially well-mixed wild-type populations due to non-genetic diversity. By manipulating the expression of key chemotaxis proteins, we established a causal relationship between protein expression, non-genetic diversity, and performance that was theoretically predicted. This approach generated a complete phenotype-to-performance map, in which we found a nonlinear regime. We used this map to demonstrate how changing the shape of a phenotypic distribution can have as large of an effect on collective performance as changing the mean phenotype, suggesting that selection could act on both during the process of adaptation.
Keywords: Jensen's inequality; cellular motility; chemotaxis; nonlinear systems; non‐genetic diversity.
© 2016 The Authors. Published under the terms of the CC BY 4.0 license.
Figures
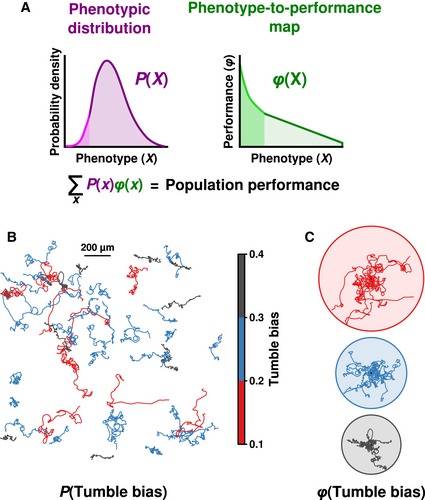
The convolution of non‐genetic diversity, P(X), with the function relating phenotype to performance, φ(X), determines population performance. A nonlinear region of φ(X) (bright green) may enhance the performance of rare phenotypes (light magenta), which would affect population performance in non‐intuitive ways.
2D trajectories of clonal Escherichia coli cells in a uniform environment display differences in tumble bias. Cells were placed on a glass slide and tracked for 1 min.
Cells from (B) grouped by tumble bias with all starting positions at same point (black dot; ten randomly chosen tracks per circle). Circles indicate the maximum extent traveled by the phenotype.

- A
Schematic diagram of the microfluidic device before (top) and after (bottom) opening the gate (horizontal orange bar). Once the gate was lifted, cells were allowed to explore the chamber and perform chemotaxis in a stable gradient during which short movies (light blue box) were acquired. See text for details.
- B, C
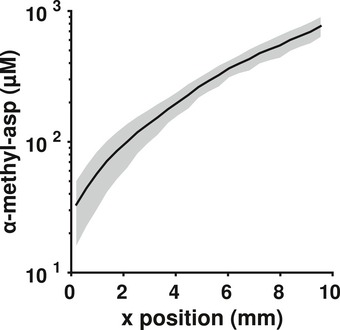
Kymographs showing the density of cells at each position and time recorded in the movie in the absence (B) or presence (C) of a 0.1 mM/mm gradient of the non‐metabolizable attractant, α‐methylaspartate (MeAsp). Each movie was split into five regions to calculate density across the frame. The resulting data were then linearly interpolated to produce the kymograph. White space indicates areas that were not observed.
- D, E
After determining the tumble bias of each trajectory, the population was split into four equally spaced tumble bias bins (insets), and the mean position of each tumble bias bin was plotted over time (filled circles, experimental measurements; lines, theoretical simulations) in experiments without (D) and with (E) a gradient of MeAsp.
- A–D
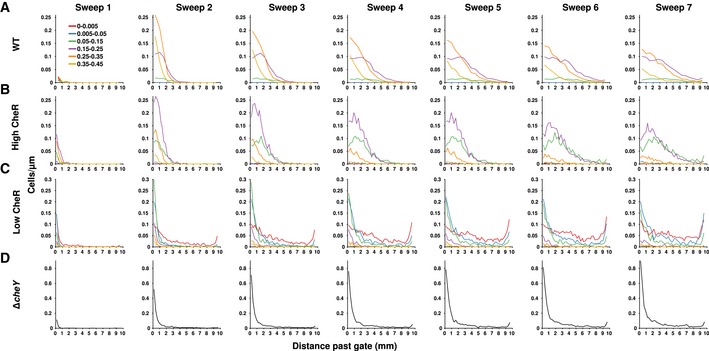
Cell density as a function of distance past the gate for the wild‐type strain (A), and mutant strain induced with 100 μM IPTG (B), 10 μM IPTG (C), and the ΔcheY strain (D). Each “sweep” indicates data compiled from one sink‐to‐source set of movies. The approximate centered times for each sweep were 4.6, 14.0, 23.6, 33.1, 42.5, 52.0, and 61.4 min, respectively.

- A–D
Distributions of tumble bias (left) and run speed (right) in experiments (black) and simulations (red) for wild‐type cells without (A) or with (B) a gradient, and mutant strains in a gradient induced with 100 μM (C) or 10 μM (D) IPTG. Inset of (D) shows the same data as (D) for a subset of low tumble bias. Tumble bias distributions of the simulated cells (left, red) were matched to the experimental tumble bias distribution (left, black) by altering the mean number of CheR proteins expressed per cell. Following previous reports (Li & Hazelbauer, 2004), a mean of 140 molecules/cell was used for wild‐type diffusion (A) and drift (B). For the mutants, we used a mean of 120 molecules/cell for induction with 100 μM IPTG (C) and a mean of 13 molecules/cell for induction with 10 μM IPTG. Speed distributions of the simulations (right, red) were normally distributed with the following means ± SDs: (A) 30 ± 7 μm/s; (B) 26 ± 6 μm/s; (C) 20 ± 5 μm/s; (D) 21 ± 6 μm/s.
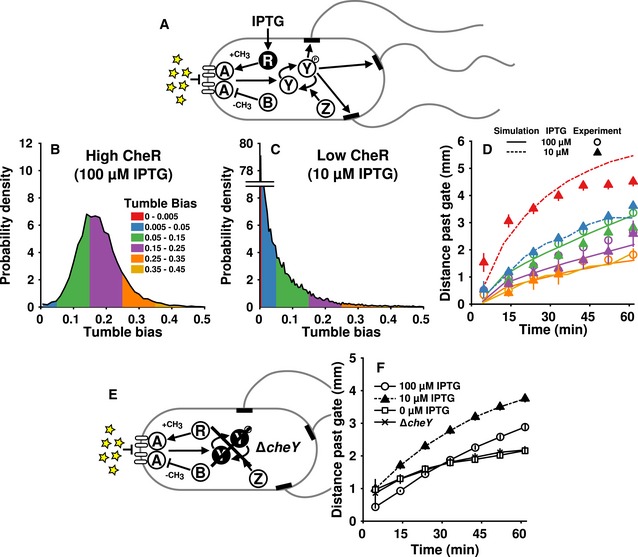
- A
Diagram of the chemotaxis pathway in Escherichia coli. We constructed a mutant strain with IPTG‐inducible expression of cheR (black). Chemoattractant (yellow stars) interacts with receptors (open ovals) to suppress the activity of CheA (A). CheA phosphorylates CheY (Y). Phosphorylated CheY (Y‐p) diffuses to the motors (black rectangles) inducing switching from counterclockwise (CCW) to clockwise (CW) rotation. A switch from CCW to CW disrupts the flagellar bundle, which causes a tumble. CheR (R) increases and CheB (B) decreases the sensitivity of the receptors via methylation and demethylation, respectively.
- B, C
Tumble bias distributions of cell populations in the microfluidic device with a gradient after induction with 100 μM (B) or 10 μM (C) IPTG.
- D
The mean position over time in the chamber for populations induced with 100 μM (open circles) or 10 μM (filled triangles) IPTG. Lines were generated from simulations of populations with tumble bias and speed distributions matched to the data.
- E
Cells lacking CheY (black) cannot perform chemotaxis because motors without CheY‐p activation are permanently in the counterclockwise (run) state.
- F
The mean performance of 100 μM IPTG (open circles), 10 μM IPTG (filled triangles), 0 μM IPTG (open squares), and ΔcheY (x's). Lines are guides for the eye. Two experiments were combined for each of the 100, 10, and 0 μM IPTG populations, totaling 12,900, 15,300, and 11,600 cells, respectively. Two experiments (totaling 8,640 cells) were combined for the ΔcheY data. All simulated data were obtained from 16,000 cells per population. Only points with at least 45 cells were plotted.
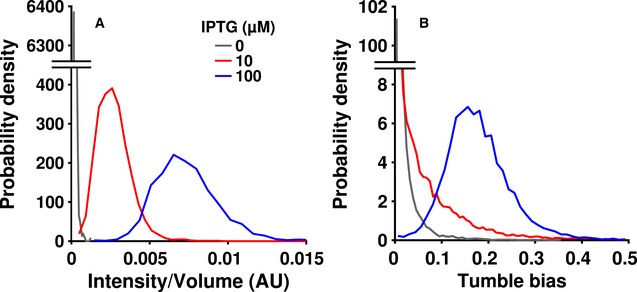
Populations of cells were induced with 0 (gray), 10 (red), or 100 (blue) μM IPTG, washed, and imaged on an agar pad at 100× magnification.
Tumble bias distributions of cell populations induced with 0 (gray), 10 (red), or 100 (blue) μM IPTG as observed in the microfluidic device. Data used to make the 10 and 100 μM IPTG tumble bias distributions are reproduced from Fig 3A and B for comparison.
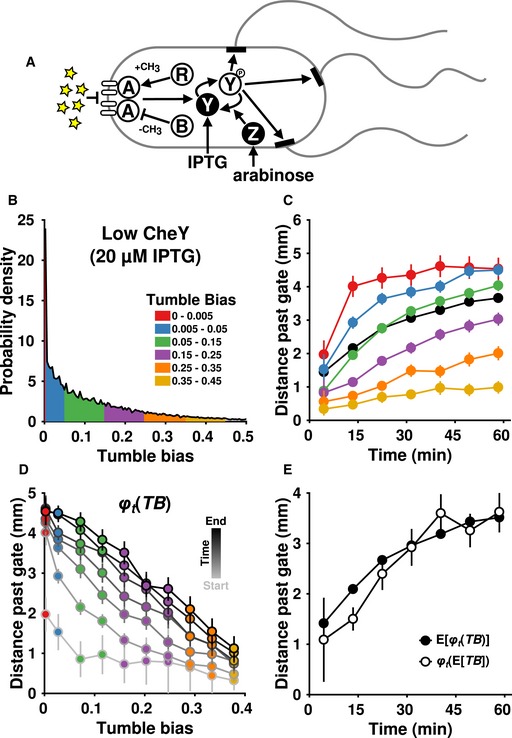
Schematic of the dual‐inducible CheY/CheZ strain. Symbols are same as in Fig 3A.
Tumble bias distribution of the dual‐inducible strain induced with 20 μM IPTG and 0.0001% arabinose.
The performance of the dual‐inducible strain. Black indicates the average position of the entire population.
Performance (distance past the gate) as a function of phenotype (tumble bias, TB) for every pass through the microfluidics chamber was used to create the function φ t(TB). The lowest tumble bias point is 0.0025.
The mean performance of the population (closed circles) and the performance of the mean phenotype (open circles) over time. The performance of the mean phenotype was defined as the average performance of cells having a tumble bias within 0.01 of the population mean tumble bias (0.13 ± 0.002). The data are from two experiments totaling 17,400 cells.
- A
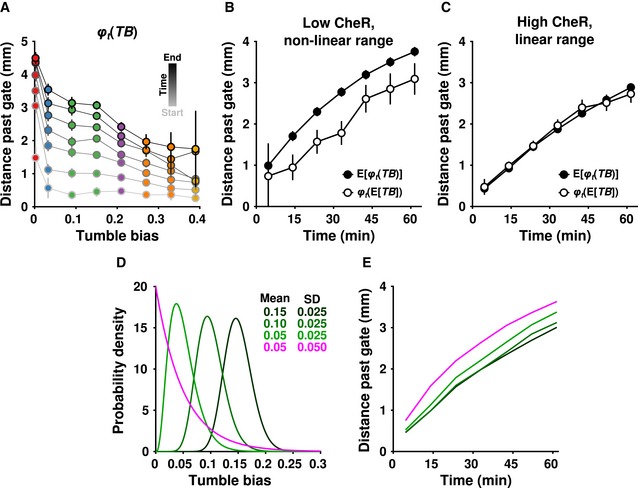
Data from the 100 μM and 10 μM IPTG experiments were combined to produce a map from phenotype (tumble bias, TB) to performance (distance past the gate, φ t(TB)). The lowest tumble bias point is 0.0025.
- B, C
The mean performance of the population (closed circles, same as in Fig 3F) and the performance of the mean phenotype (open circles) over time for cells induced with 10 μM (B) or 100 μM (C) IPTG. The mean tumble bias ± 2 standard errors was 0.044 ± 0.0005 for the low‐CheR population (B), and 0.175 ± 0.0006 for the high‐CheR population (C). In each case, the performance of the mean phenotype was calculated by averaging the performance of cells within 0.01 of the mean tumble bias. In all cases, error bars indicate ± two times the standard error of the mean.
- D, E
Predictions of performance for hypothetical populations. (D) A series of hypothetical tumble bias distributions were generated using a gamma function with parameters [k; θ] of [36; 4.17 × 10⁻³], [16; 6.25 × 10⁻³], [4; 0.0125] (dark to light green), and [1; 0.05] (magenta). The parameters for the green curves were chosen to have decreasing means and identical standard deviations (SDs). The light green and magenta distributions were chosen to have the same mean and different SDs. (E) φ t(TB) from (A) was interpolated and used to generate predicted performance curves for the tumble bias distributions in (D).
Comment in
-
Stochastic gene expression: bacterial elites in chemotaxis.Mol Syst Biol. 2017 Jan 23;13(1):909. doi: 10.15252/msb.20167458. Mol Syst Biol. 2017. PMID: 28115550 Free PMC article.
References
MeSH terms
Substances
Grants and funding
LinkOut - more resources
Full Text Sources
Other Literature Sources
