. 2017 Jan 3;114(1):E9-E18.
doi: 10.1073/pnas.1610110114. Epub 2016 Dec 19.

Persistence and biodegradation of oil at the ocean floor following Deepwater Horizon

Affiliations

Persistence and biodegradation of oil at the ocean floor following Deepwater Horizon

Sarah C Bagby et al. Proc Natl Acad Sci U S A. .

Abstract

The 2010 Deepwater Horizon disaster introduced an unprecedented discharge of oil into the deep Gulf of Mexico. Considerable uncertainty has persisted regarding the oil's fate and effects in the deep ocean. In this work we assess the compound-specific rates of biodegradation for 125 aliphatic, aromatic, and biomarker petroleum hydrocarbons that settled to the deep ocean floor following release from the damaged Macondo Well. Based on a dataset comprising measurements of up to 168 distinct hydrocarbon analytes in 2,980 sediment samples collected within 4 y of the spill, we develop a Macondo oil "fingerprint" and conservatively identify a subset of 312 surficial samples consistent with contamination by Macondo oil. Three trends emerge from analysis of the biodegradation rates of 125 individual hydrocarbons in these samples. First, molecular structure served to modulate biodegradation in a predictable fashion, with the simplest structures subject to fastest loss, indicating that biodegradation in the deep ocean progresses similarly to other environments. Second, for many alkanes and polycyclic aromatic hydrocarbons biodegradation occurred in two distinct phases, consistent with rapid loss while oil particles remained suspended followed by slow loss after deposition to the seafloor. Third, the extent of biodegradation for any given sample was influenced by the hydrocarbon content, leading to substantially greater hydrocarbon persistence among the more highly contaminated samples. In addition, under some conditions we find strong evidence for extensive degradation of numerous petroleum biomarkers, notably including the native internal standard 17α(H),21β(H)-hopane, commonly used to calculate the extent of oil weathering.

Keywords: Deepwater Horizon; biodegradation; hydrocarbon; oil spills; petroleum biomarkers.


Conflict of interest statement

The authors declare no conflict of interest.

Figures

Fig. 1.
Fig. 1.
Application of the MDI to NRDA sediment samples. (A) Spatial distribution of MDI values. (Left) Surficial sediments (upper depth = 0 cm) collected 1–40 km from the wellhead. (Center) Surficial sediments collected ≥40 km from the wellhead. (Right) Downcore sediments (upper depth ≥4.5 cm) collected 1–40 km from the wellhead. Samples falling in the green region (MDI <1.8) are consistent with Macondo oil. (B) Bathymetric chart of the region around the wellhead showing MDI results for each sample collected. Green symbols, MDI <1.8; purple symbols, MDI ≥1.8. (C) Zoomed view of B showing detail in the immediate vicinity of the wellhead. (D) Footprint of seafloor oil deposition in the immediate vicinity of the wellhead as detected by hopane-concentration anomalies in previous work (28).
Fig. 2.
Fig. 2.
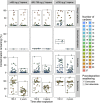
Overview of the relationship between carbon skeleton size and structure and the extent of biodegradation at 160 d and 4 y postexplosion. Symbols are colored by the number of carbons in the skeleton; symbol shape indicates whether postdeposition biodegradation was or was not detectable for each compound. Results are the median of 100 pseudoreplicate fits for each compound–contamination bin dataset.
Fig. 3.
Fig. 3.
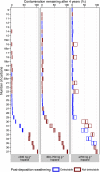
Percent of aliphatic compounds remaining at 4 y postexplosion, ordered by chain length. Branched compounds are indicated by “br” on the y axis. Compounds for which biodegradation was detectable after deposition are shown in blue, with crossbars indicating the fitted value and boxes indicating the 95% confidence interval (CI) of the median fit result. Compounds for which postdeposition biodegradation was not detectable are shown in red, with vertical bars indicating the median and boxes indicating the interquartile range of measured values.
Fig. 4.
Fig. 4.
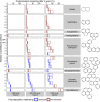
Percent remaining of aromatic compounds with six-membered rings 4 y postexplosion. (Decalin is not aromatic but is included here.) Panels are ordered by increasing carbon skeleton size from top to bottom and within each panel by increasing number of carbon substituents. Where multiple carbon skeletons are shown for a single group at right, the compounds in that category were not separately resolved in chemical analysis, unless otherwise indicated on the y axis. 0(P), unsubstituted phenanthrene only; 0(A), unsubstituted anthracene only. Compounds for which biodegradation was detectable after deposition are shown in blue, with crossbars indicating the fitted value and boxes indicating the 95% CI of the median fit result. Compounds for which postdeposition biodegradation was not detectable are shown in red, with vertical bars indicating the median and boxes indicating the interquartile range of measured values.
Fig. 5.
Fig. 5.
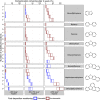
Percent of aromatic compounds with five-membered rings remaining 4 y postexplosion. (Biphenyl is included here because of its structural resemblance to fluorene, dibenzofuran, and dibenzothiophene.) Panels are ordered by increasing carbon skeleton size from top to bottom and within each panel by increasing number of carbon substituents. Compounds for which biodegradation was detectable after deposition are shown in blue, with crossbars indicating the fitted value and boxes the 95% CI of the median fit result. Compounds for which postdeposition biodegradation was not detectable are shown in red, with vertical bars indicating the median and boxes the interquartile range of measured values.
Fig. 6.
Fig. 6.
Percent of biomarker compounds remaining 4 y postexplosion. Panels are ordered by increasing carbon skeleton size from top to bottom and within each panel by increasing number of carbon substituents, with (R) and (S) substituent stereochemistry displayed separately. Among neohopanes and hopanes, –3 indicates the tris-nor compounds and –1 indicates the nor compounds; 1(R) and 1(S) through 5(R) and 5(S) indicate homohopanes through pentakishomohopanes. Compounds for which biodegradation was detectable after deposition are shown in blue, with crossbars indicating the fitted value and boxes indicating the 95% CI of the median fit result. Compounds for which postdeposition biodegradation was not detectable are shown in red, with vertical bars indicating the median and boxes indicating the interquartile range of measured values.

References

    1. McNutt MK, et al. Review of flow rate estimates of the Deepwater Horizon oil spill. Proc Natl Acad Sci USA. 2012;109(50):20260–20267. - PMC - PubMed
    1. Reddy CM, et al. Composition and fate of gas and oil released to the water column during the Deepwater Horizon oil spill. Proc Natl Acad Sci USA. 2012;109(50):20229–20234. - PMC - PubMed
    1. Camilli R, et al. Acoustic measurement of the Deepwater Horizon Macondo well flow rate. Proc Natl Acad Sci USA. 2012;109(50):20235–20239. - PMC - PubMed
    1. White HK, et al. Long-term persistence of dispersants following the Deepwater Horizon oil spill. Environ Sci Technol Lett. 2014;1(7):295–299.
    1. Socolofsky SA, et al. Intercomparison of oil spill prediction models for accidental blowout scenarios with and without subsea chemical dispersant injection. Mar Pollut Bull. 2015;96(1-2):110–126. - PubMed

Publication types