. 2017 Jan 3;114(1):E37-E46.
doi: 10.1073/pnas.1612263114. Epub 2016 Dec 19.

Dynamic NHERF interaction with TRPC4/5 proteins is required for channel gating by diacylglycerol

Affiliations

Dynamic NHERF interaction with TRPC4/5 proteins is required for channel gating by diacylglycerol

Ursula Storch et al. Proc Natl Acad Sci U S A. .

Abstract

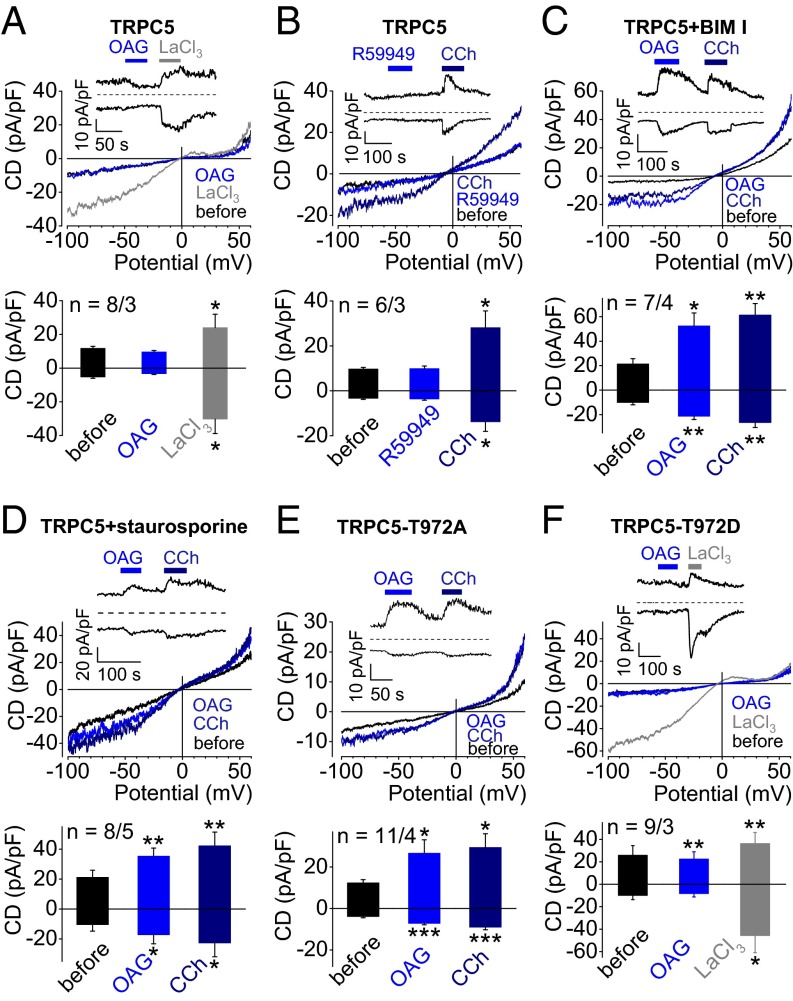
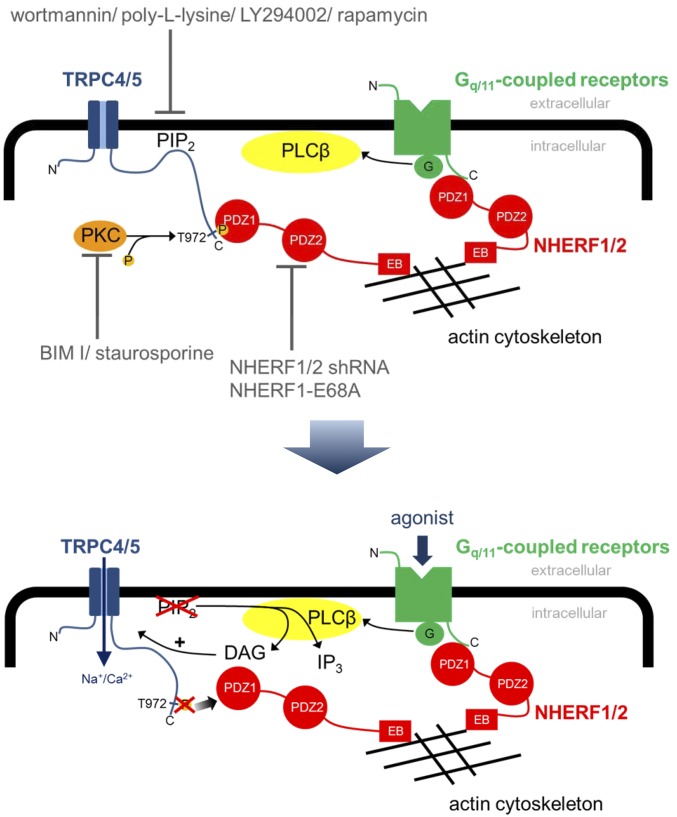
The activation mechanism of the classical transient receptor potential channels TRPC4 and -5 via the Gq/11 protein-phospholipase C (PLC) signaling pathway has remained elusive so far. In contrast to all other TRPC channels, the PLC product diacylglycerol (DAG) is not sufficient for channel activation, whereas TRPC4/5 channel activity is potentiated by phosphatidylinositol 4,5-bisphosphate (PIP2) depletion. As a characteristic structural feature, TRPC4/5 channels contain a C-terminal PDZ-binding motif allowing for binding of the scaffolding proteins Na+/H+ exchanger regulatory factor (NHERF) 1 and 2. PKC inhibition or the exchange of threonine for alanine in the C-terminal PDZ-binding motif conferred DAG sensitivity to the channel. Altogether, we present a DAG-mediated activation mechanism for TRPC4/5 channels tightly regulated by NHERF1/2 interaction. PIP2 depletion evokes a C-terminal conformational change of TRPC5 proteins leading to dynamic dissociation of NHERF1/2 from the C terminus of TRPC5 as a prerequisite for DAG sensitivity. We show that NHERF proteins are direct regulators of ion channel activity and that DAG sensitivity is a distinctive hallmark of TRPC channels.

Keywords: NHERF; PIP2 depletion; TRPC; diacylglycerol; protein interaction.


Conflict of interest statement

The authors declare no conflict of interest.

Figures

Fig. 1.
Fig. 1.
OAG increases TRPC5 currents, if phosphorylation by PKC is prevented. (AE) Whole-cell recordings of HEK293 cells expressing TRPC5 (AD), TRPC5–T972A (E), or TRPC5–T972D (F) with representative current density (CD) voltage curves, CD time courses, and summaries of CDs at holding potentials of ±60 mV are displayed. Stippled lines indicate zero currents. Applications of 100 µM OAG (A and CF) of the DAG kinase inhibitor R59949 (100 µM, B), of 100 µM carbachol (CCh, BE), and 300 µM LaCl3 (A and E) are indicated. (C and D) Cells were preincubated with the PKC inhibitors 1 µM BIM I (C) or 1 µM staurosporine (D) for 15 min. CD analysis shows summary of CDs before and during application of OAG (A and CF), R59949 (B), CCh (BE), or LaCl3 (A and F). Numbers over bars indicate the number of measured cells and of independent transfections measured on different experimental days. (AF) Significant differences were calculated compared with basal CDs before application of stimuli (mean ± SEM two-tailed, paired t test; *P < 0.05, **P < 0.01, ***P < 0.001).
Fig. 2.
Fig. 2.
C-terminal NHERF interaction determines OAG sensitivity of TRPC5. (AF) Whole-cell measurements of HEK293 cells coexpressing TRPC5 together with unrelated control shRNA (A), shRNA directed against NHERF1 (B), shRNA directed against NHERF2 (C), NHERF1 (D), or the patient mutant NHERF1–E68A (E) or of HEK293 cells expressing TRPC5 channels alone (F). (F) Cells were preincubated with 5 µM cytochalasin D for 30 min. Representative CD voltage curves and summaries of current densities at holding potentials of ±60 mV are shown. CD analysis shows summary of CDs before and during application of 100 µM OAG and 300 µM LaCl3. Numbers over bars indicate the number of measured cells and of independent transfections measured on different experimental days. Significant differences compared with basal CDs before application of stimuli (mean ± SEM, two-tailed, paired t test; *P < 0.05, **P < 0.01, ***P < 0.001).
Fig. 3.
Fig. 3.
Coexpression of Gq/11-coupled receptors causes OAG sensitivity due to dissociation of NHERF1 from the C terminus of TRPC5. (A and B) Whole-cell recordings of HEK293 cells coexpressing TRPC5 and M5R (A) or TRPC5 and H1R (B) with representative CD voltage curves, CD time courses, and summary of CDs at holding potentials of ±60 mV. CD analysis shows summary of CDs before and during application of 100 µM OAG (A), of the DAG lipase inhibitor RHC-80267 (100 µM) (B), 100 µM carbachol (CCh) (A), and 100 µM histamine (B). Numbers over bars indicate the number of measured cells and of independent transfections measured on different experimental days. Stippled lines indicate zero currents. Applications of OAG and CCh (A) and RHC-80267 and histamine (B) are indicated. (A and B) Significant differences were calculated compared with basal CDs before application of stimuli (mean ± SEM, two-tailed, paired t test; *P < 0.05, **P < 0.01, ***P < 0.001). (C) Single-channel measurement in the outside-out configuration of TRPC5- and M5R-expressing HEK293 cells. Representative current time course at −60 mV before (Top, red dot) and during OAG application (Bottom, black dot) at indicted time points (red and black dots). (Bottom) Analysis of NPo before and during OAG application. C indicates the closed channel state. (D) Representative Western blot analysis of PKC levels in HEK293 cells expressing TRPC5 and/or M5R with or without preincubation with CCh for 30 min or after incubation with 2 µM PDD for 48 h. (E) Representative coimmunoprecipitation of TRPC5, which was HA tagged in the second extracellular loop (HAEL2–TRPC5) or of N-terminally GFP-tagged M5R (GFP–M5R) with coexpressed human NHERF1 in CHO-K1 cells. Immunoprecipitation with anti-HA antibody and Western blot with anti-NHERF antibody after immunoprecipitation (Upper). Coimmunoprecipitation was only observed with TRPC5 and NHERF1 coexpressing cells. Superscript 1 indicates that cell lysate was incubated with control antibody instead of anti-HA antibody. No interaction was found after incubation with control antibody. (Lower) Western blots of total cell lysates using the indicated antibodies, which served as input controls.
Fig. 4.
Fig. 4.
Endogenously expressed TRPC4 and -5 channels become OAG sensitive if PKC and NHERF interaction are inhibited. (A) Summary of qRT-PCR of HKC8 cells of three independent experiments. (BE) Whole-cell measurements of HKC8 cells without (B) or with preincubation of 1 µM BIM I for 15 min (C and D) and after transfection with NHERF–E68A (E). (D) Application of the TRPC4 blocker ML 204 (20 µM) is indicated. (AE) Representative CD voltage curves, CD time courses, and summaries of CDs at holding potentials of ±60 mV are shown. CD analysis shows summary of CDs before and during application of 100 µM OAG in the presence (A, C, and E) or absence (D) of ML 204 and of 300 µM LaCl3. Numbers over bars indicate the number of measured cells and independent experimental days. Significant differences compared with basal CDs (mean ± SEM, two-tailed, paired t test; *P < 0.05, **P < 0.01, ***P < 0.001, black asterisks) and compared with untreated HKC8 cells (mean ± SEM, two-tailed, unpaired t test; *P < 0.05, **P < 0.01, ***P < 0.001, red asterisks). (F) Summary of qRT-PCR of HT22 cells of three independent experiments. (GJ) Whole-cell measurements of HT22 cells without (G) or with preincubation of 1 µM BIM I for 15 min (H). (I and J) HT22 cells transfected with shRNA directed against TRPC5 (I) or with unrelated control shRNA (J) incubated with BIM I. Representative CD voltage curves, CD time courses, and summaries of CDs at holding potentials of ±60 mV are shown. CD analysis shows summary of CDs before and during application of 100 µM OAG. Numbers over bars indicate the number of measured cells and independent experiments. Significant differences compared with basal CDs (mean ± SEM, two-tailed, paired t test; *P < 0.05, ***P < 0.001, black asterisks), compared with untransfected and BIM I-treated HKC8 cells (mean ± SEM, two-tailed, unpaired t test; *P < 0.05, **P < 0.01, ***P < 0.001, red asterisks) and compared with BIM I-treated cells expressing unrelated shRNA (mean ± SEM, two-tailed, unpaired t test; **P < 0.01, gray asterisks).
Fig. 5.
Fig. 5.
PIP2 depletion renders TRPC5 channels DAG sensitive. (AF) Whole-cell measurements of HEK293 cells expressing TRPC5 alone (AD and E) or together with Lyn11–FRB–mCherry and pseudojanin–FKBP–pmRFP-C1, which is fused to the phosphatases Sac1 and INPP5E leading to rapamycin-induced degradation of PIP2 to PI(4)P and to PI (E). Representative CD voltage curves, CD time courses, and summaries of CDs at holding potentials of ±60 mV are shown. CD analysis shows summary of CDs before and during application of 100 µM OAG in the presence of 20 µM wortmannin (A), 100 nM wortmannin (B), 100 µM LY294002 (C), 3 µg/mL poly-l-lysine (PLL) (D), 5 µM rapamycin (E), 100 µM carbachol (CCh) (F), and during application of 300 µM LaCl3. Numbers over bars indicate the number of measured cells and independent experiments measured at different experimental days. Bath applications of OAG, LaCl3, and of wortmannin (A and B), LY294002 (C), rapamycin (E), and CCh (F) are indicated. PLL was applied through the patch pipette (D). Stippled line indicates zero current. Significant differences are compared with basal CDs (mean ± SEM, two-tailed, paired t test; **P < 0.01, *P < 0.05, ***P < 0.001). Significant differences between CDs induced by PIP2 depletions with wortmannin, LY294002, PLL, rapamycin, or CCh compared with additional application of OAG (mean ± SEM, two-tailed, paired t test; *P < 0.05, **P < 0.01, ***P < 0.001).
Fig. 6.
Fig. 6.
PIP2 depletion and Gq/11-coupled receptor activation lead to dynamic NHERF1 dissociation and a conformational change of the TRPC5 C terminus. (AN) Dynamic intermolecular FRET measurements with dual-emission photometry. (AE) FRET measurements between N-terminally Cerulean-tagged NHERF1 (Cerulean–NHERF1) and (A) C-terminally eYFP-tagged TRPC5 (TRPC5–YFP), (B) C-terminally eYFP-tagged TRPC5–T972D (TRPC5–T972D–YFP), (C) C-terminally eYFP-tagged TRPC5–T972A (TRPC5–T972A–YFP), and (D) C-terminally eYFP-tagged TRPC6 (TRPC6–YFP). (A) Representative FRET measurement showing normalized fluorescence traces of Cerulean (cyan) and eYFP (yellow) on excitation of 430 nm (Left). (AD) Representative traces of the FRET signal. Applications of 20 µM wortmannin (Wort) and of 100 µM carbachol (CCh) are indicated. (E) Summary of changes of FRET signal amplitudes induced by wortmannin (cyan bars) or CCh (dark blue bars) in both orders of application. Numbers indicate the numbers of measured cells from at least four independent experiments. Significant differences compared with wild-type TRPC5–eYFP-expressing cells (mean ± SEM, two-tailed, unpaired t test; **P < 0.01, ***P < 0.001, black asterisks). Significant differences compared with TRPC5–T972D–eYFP-expressing cells (mean ± SEM, two-tailed, unpaired t test; **P < 0.01, ***P < 0.001, gray asterisk). (FN) FRET measurements between C-terminally eYFP- and eCFP-tagged TRPC5 (FI) and between C-terminally eYFP- and eCFP-tagged TRPC5–T972A (JM). (F and J) Representative FRET measurement showing normalized fluorescence traces of eCFP (cyan) and eYFP (yellow) on excitation of 430 nm (Left). (FM) Representative traces of the FRET signal. Applications of 20 µM wortmannin (Wort), of 100 µM ATP, and of 100 µM OAG are indicated. (N) Summaries of changes of FRET signal amplitudes induced by wortmannin (cyan bars), ATP (violet bars), OAG (blue bars), and OAG and wortmannin together (blue hatched bars). Numbers indicate the numbers of measured cells from at least four independent experiments. Significant differences between wortmannin- and wortmannin plus OAG-induced FRET amplitudes (mean ± SEM, two-tailed, unpaired t test; **P < 0.01, ***P < 0.001, black asterisks).
Fig. 7.
Fig. 7.
Model of receptor-operated TRPC4 and -5 channel activation by DAG. In the DAG-insensitive, inactive channel conformation, PIP2 and NHERF proteins are bound to the C terminus. PIP2 depletions, PKC inhibition, NHERF down-regulation, and coexpression of the NHERF1–E68A mutant lead to DAG sensitivity. PLC-dependent or independent PIP2 depletions cause a conformational change of the C terminus, leading to dissociation of NHERF, which results in DAG sensitivity of TRPC4 and -5 channels.

Comment in

References

    1. Riccio A, et al. Essential role for TRPC5 in amygdala function and fear-related behavior. Cell. 2009;137(4):761–772. - PMC - PubMed
    1. Riccio A, et al. Decreased anxiety-like behavior and Gαq/11-dependent responses in the amygdala of mice lacking TRPC4 channels. J Neurosci. 2014;34(10):3653–3667. - PMC - PubMed
    1. Phelan KD, et al. Canonical transient receptor channel 5 (TRPC5) and TRPC1/4 contribute to seizure and excitotoxicity by distinct cellular mechanisms. Mol Pharmacol. 2013;83(2):429–438. - PMC - PubMed
    1. Tai C, Hines DJ, Choi HB, MacVicar BA. Plasma membrane insertion of TRPC5 channels contributes to the cholinergic plateau potential in hippocampal CA1 pyramidal neurons. Hippocampus. 2011;21(9):958–967. - PubMed
    1. Greka A, Navarro B, Oancea E, Duggan A, Clapham DE. TRPC5 is a regulator of hippocampal neurite length and growth cone morphology. Nat Neurosci. 2003;6(8):837–845. - PubMed

Publication types