. 2017 Jan 3;114(1):E75-E84.
doi: 10.1073/pnas.1614777114. Epub 2016 Dec 19.

Disrupting the blood-brain barrier by focused ultrasound induces sterile inflammation

Affiliations

Disrupting the blood-brain barrier by focused ultrasound induces sterile inflammation

Zsofia I Kovacs et al. Proc Natl Acad Sci U S A. .

Abstract

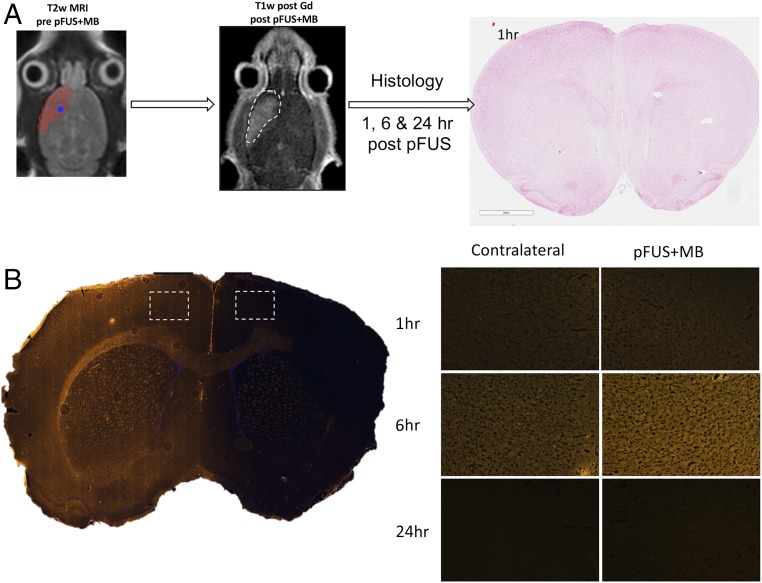
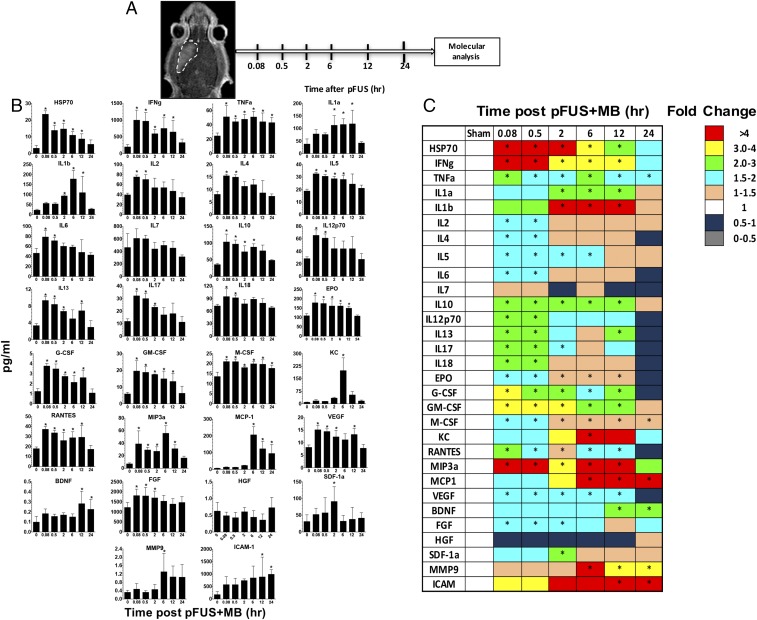
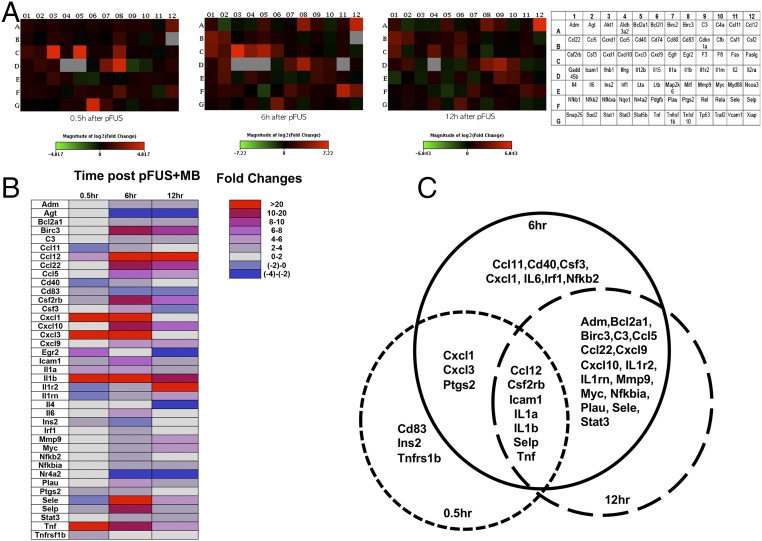
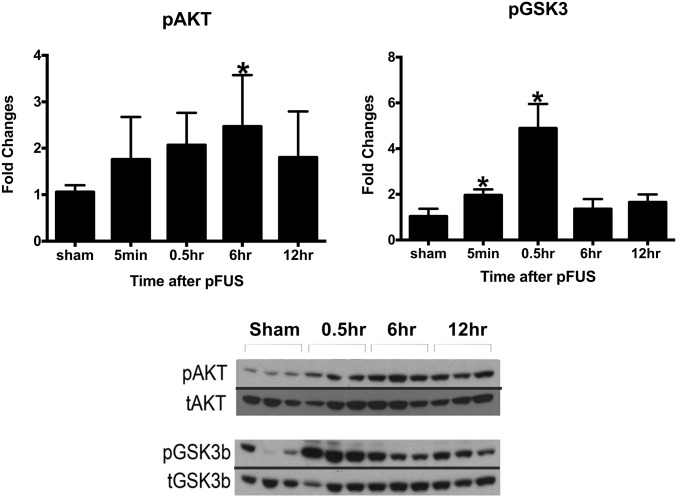
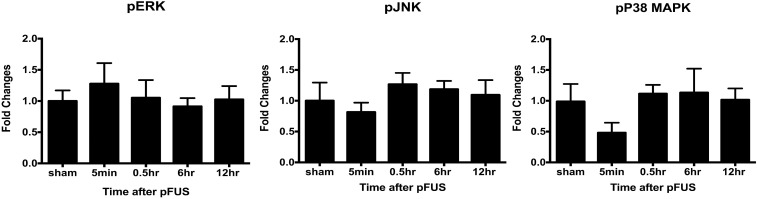
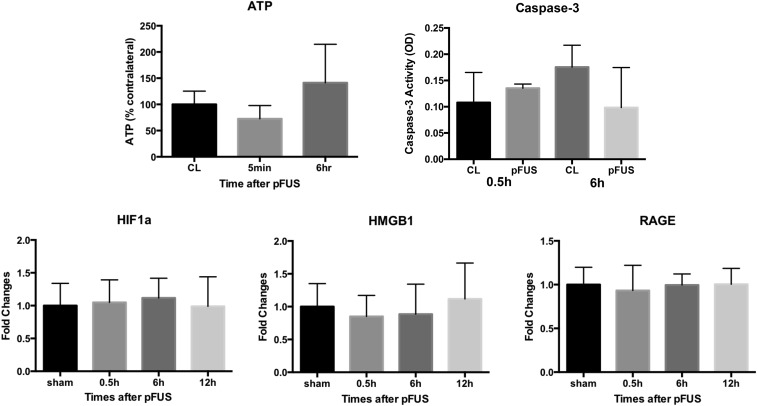
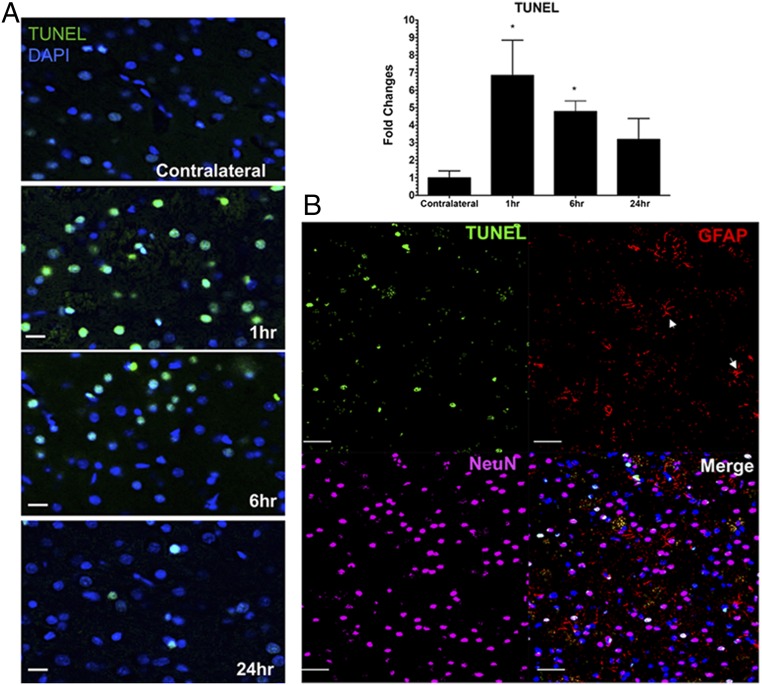
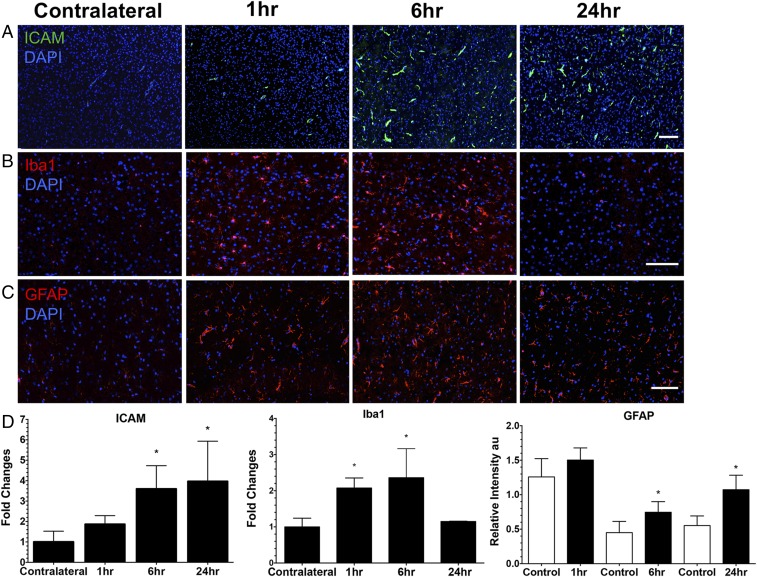
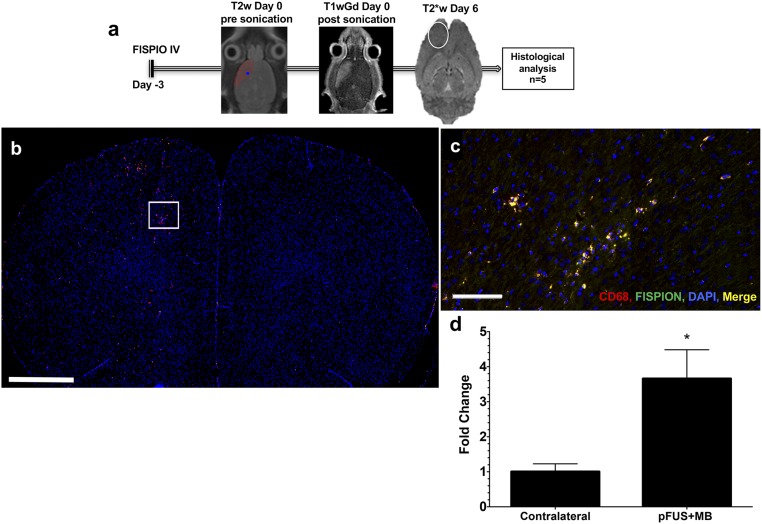
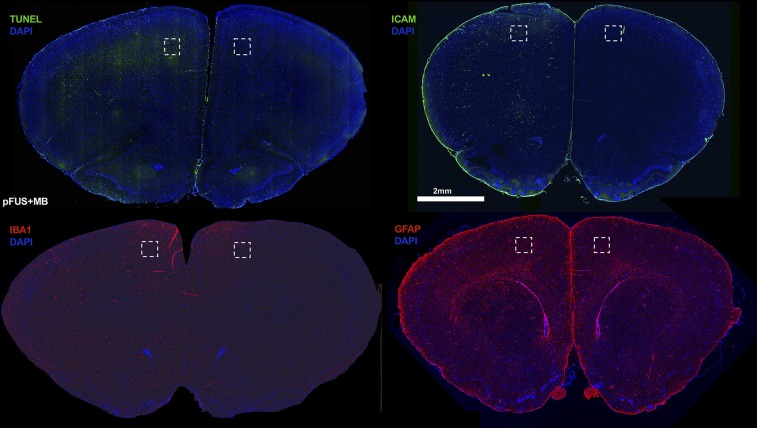
MRI-guided pulsed focused ultrasound (pFUS) combined with systemic infusion of ultrasound contrast agent microbubbles (MB) causes localized blood-brain barrier (BBB) disruption that is currently being advocated for increasing drug or gene delivery in neurological diseases. The mechanical acoustic cavitation effects of opening the BBB by low-intensity pFUS+MB, as evidenced by contrast-enhanced MRI, resulted in an immediate damage-associated molecular pattern (DAMP) response including elevations in heat-shock protein 70, IL-1, IL-18, and TNFα indicative of a sterile inflammatory response (SIR) in the parenchyma. Concurrent with DAMP presentation, significant elevations in proinflammatory, antiinflammatory, and trophic factors along with neurotrophic and neurogenesis factors were detected; these elevations lasted 24 h. Transcriptomic analysis of sonicated brain supported the proteomic findings and indicated that the SIR was facilitated through the induction of the NFκB pathway. Histological evaluation demonstrated increased albumin in the parenchyma that cleared by 24 h along with TUNEL+ neurons, activated astrocytes, microglia, and increased cell adhesion molecules in the vasculature. Infusion of fluorescent beads 3 d before pFUS+MB revealed the infiltration of CD68+ macrophages at 6 d postsonication, as is consistent with an innate immune response. pFUS+MB is being considered as part of a noninvasive adjuvant treatment for malignancy or neurodegenerative diseases. These results demonstrate that pFUS+MB induces an SIR compatible with ischemia or mild traumatic brain injury. Further investigation will be required before this approach can be widely implemented in clinical trials.

Keywords: blood-brain barrier; magnetic resonance imaging; microbubbles; pulsed focused ultrasound; sterile inflammation.


Conflict of interest statement

The authors declare no conflict of interest.

Figures

Fig. 1.
Fig. 1.
BBBD by pFUS+MB. (A) Diagram of the experimental design for pFUS-treated rat brain for histological analysis. T2w MRI was used to target FUS with points (red circles) ∼2 mm in diameter placed in the left frontal cortex anterior to the lateral ventricle. Following pFUS+MB, Gd-enhanced T1w images were obtained. The dashed white line outlines the contrast enhancement. Animals were killed 1, 6, or 24 h after sonication, and brains were collected for histology. No microhemorrhages or macroscopic alterations to morphology were observed on H&E staining. (B) Albumin extravasated through the open BBB with peak parenchymal accumulation occurring at 6 h post pFUS+MB.
Fig. 2.
Fig. 2.
Molecular changes in the brain following pFUS+MB: pFUS+MB proteomic response in the brain. (A) Diagram of the experimental protocol. Posttreatment Gd-enhanced T1w images showing BBBD in rat left cortex and striatum. Brains from treated rats (n = 5 per time point) and from sham-treated controls (n = 5) were harvested at each time point for molecular analyses. (B) Quantification of CCTFs and ICAM in brain after pFUS. The y axes represent picograms per milliliter; the x axes represent hours post pFUS+MB. For the sham control brains, no pFUS+MB was administered. (C) Heat map depicting fold changes in CCTFs and CAM over time after brain exposure to pFUS+MB. Protein levels were quantified by ELISA and were normalized to sham control values. Asterisks indicate statistically significant elevations (P < 0.05) identified by ANOVA and Bonferroni post hoc tests.
Fig. 3.
Fig. 3.
Changes in mRNA levels after pFUS+MB. (A, Left) Heat maps derived from qRT-PCR of 84 genes related to the NFκB pathway at 0.5, 6, and 12 h post pFUS+MB at three time points. (Right) Key to encoding genes. (B) Fold changes were calculated based on the expression level in the contralateral brain. Only fold changes >2 are presented. (C) Venn diagrams show the overlap in mRNA expression for each of the three time points. Significant elevations in mRNA expression of Ptgs2 and proinflammatory factors (Il1a, Il1b, Ccl12, and Tnf), integrin (Selp), and Icam1 were detected at 30 min after pFUS+MB and lasted for 12 h. At 6 h post pFUS+MB an increase in Nfkb2 mRNA was detected, supporting proteomic changes that would indicate that pFUS+MB induced a sterile inflammatory response through NFκb pathways. (Significantly elevated genes encoding for mRNA are described in Table S2, and fold changes for the 84 genes evaluated are given in Table S3.)
Fig. 4.
Fig. 4.
Changes in the activation of AKT (Ser473) and GSK3β after pFUS+MB. Brain homogenates were prepared in radioimmunoprecipitation assay (RIPA) lysis buffer from brain tissues harvested at 5 min and 0.5, 6, and 12 h after pFUS+MB. Equal amounts of sample proteins (i.e., 25 μg) were loaded, and Western blotting was performed. The activation of protein was quantified as a ratio of phosphorylated to total proteins. The ratio was compared with the sham activation ratio to calculate fold changes in activation. Each time point had n = 3 animals, and the data in the graph represent the mean ± SD of at least three independent experiments (one-way ANOVA with multiple comparisons; *P < 0.05). The figure was created by splicing the phosphoprotein bands and merging them together with total protein bands for clear and easy representation of changes in phosphoproteins. The blot shown is representative of at least three independent experiments.
Fig. S1.
Fig. S1.
No significant changes in the activation of ERK, JNK, or p38-MAPK were detected by Western blot after pFUS+MB. Phosphorylation of ERK1/2, 44/42 MAPK, JNK, and p38-MAPK did not increase significantly after pFUS+MB compared with the total proteins, indicating that these pathways were not activated. All experiments and analysis were performed as described in Fig. 4.
Fig. S2.
Fig. S2.
No significant changes in ATP level were detected 5 min or 6 h after pFUS+MB compared with the contralateral (CL) hemisphere using the ATP Bioluminescence Assay Kit from Sigma-Aldrich (n = 3 animals per time point). Data are shown as a percent of the levels in the contralateral hemisphere at the various time points. No significant changes in caspase-3 activity were detected at 0.5 and 6 h after pFUS+MB compared with the contralateral hemisphere using the Caspase-3 Colorimetric Assay Kit from R&D (n = 3 animals per time point). No significant changes in HIF1a, HMGB1, and RAGE were detected by Western blot compared with the sham-treated animals (n = 3 animals per time point). Data shown are quantified from at least four independent Western blots.
Fig. 5.
Fig. 5.
Evaluation of TUNEL staining following pFUS to the brain. (A, Left) TUNEL staining revealed a significant sevenfold increase in the number of cells at 1 h and a fivefold increase at 6 h after pFUS+MB that decreased toward the levels in the contralateral cortex by 24 h post pFUS+MB. (Right) Quantitative analysis. Quantitation of TUNEL staining was calculated from mean cell counts from 10 FOV per hemisphere in three consecutive sections from each of three rats. Statistical analyses were based on one-way ANOVA with multiple comparisons with the contralateral hemisphere; *P < 0.05. Data are presented as mean ± SD. (Scale bars, 100 μm.) (B) Confocal micrographs of immunofluorescent TUNEL (green), GFAP (red), NeuN (magenta), DAPI (blue), and merged (white) staining of rat cortex at 1 h post pFUS+MB. Fibrous astrocytes are indicated by white arrowheads. (Scale bars, 100 µm.) (See Fig. S3 for a representative TUNEL-stained whole-brain section.)
Fig. 6.
Fig. 6.
Histological evaluation of the effect of pFUS+MB in the brain. (A) ICAM staining revealed that ICAM expression was significantly elevated beginning at 6 h postsonication, and the elevation persisted through 24 h postsonication. (B) Iba1 staining revealed significantly increased Iba1 expression in microglia at 1 and 6 h postsonication in treated brain tissue compared with the contralateral hemisphere. (C) GFAP staining revealed activated astrocytes in response to the SIR caused by pFUS+MB. (See Fig. S5 for representative fluorescent GFAP sections of fibrous astrocytes.) GFAP was significantly elevated in the ipsilateral hemisphere at 6 and 24 h compared with the contralateral hemisphere. (D) Quantitative analysis for ICAM, GFAP, and Iba1 from sonicated brain at 1, 6, and 24 h. ICAM and Iba1 values were calculated from mean cell counts from 10 FOV per hemisphere in three consecutive sections from each of three rats. For GFAP staining, the area of positive fluorescence signal was calculated using Image J from 10 FOV per hemisphere in three consecutive sections from each of three rats. Statistical analyses were based on one-way ANOVA for multiple comparisons with the contralateral hemisphere (*P < 0.05) for ICAM and Iba1 and on a paired t test for GFAP (P < 0.05). In the GFAP graph the control bars represent the contralateral cortex. Data are presented as mean ± SD. (Scale bars, 100 μm for Iba1 and GFAP; 10 μm for ICAM.) (See Fig. S3 for representative brain sections stained for ICAM, GFAP, and Iba1 and Fig. S4 for isotype control stains.)
Fig. 7.
Fig. 7.
pFUS+MB induced an innate immune response characterized by the infiltration of CD68+ macrophages. (A) A schematic representation of the experimental protocol shows that 3 d before pFUS+MB, rats (n = 5) were i.v. injected with FlSPION beads to label macrophages in vivo. pFUS targeting was performed with T2w MRI and postsonication Gd-enhanced T1w MRI to verify opening of the BBB. Six days after pFUS+MB (9 d after FlSPION beads were infused) the area of T2* abnormalities (white oval) in treated cortex was consistent with infiltration of FlSPION-labeled cells into the brain. (BD) Significantly more CD68+-labeled (red) and FLSPION-labeled (green) cells (merged orange) and DAPI-stained nuclei (blue) were observed migrating into the sonicated hemisphere. (B) Image of an entire brain section showing more fluorescently labeled CD 68+ cells in the treated hemisphere (left side). The area in the box is the approximate region shown in C. (C) Magnified epifluorescence microscopy of labeled systemic macrophages in the sonicated hemisphere. (D) Fold changes were determined by quantifying the numbers of double-positive (fluorescent for CD68 and FlSPION) cells in each hemisphere over three 10-μm-thick sections and were normalized to the contralateral hemisphere. Data are presented as mean ± SD. Statistical comparisons were made by paired t test; *P < 0.05. (Scale bars, 100 µm in C and 2 mm in B.)
Fig. S3.
Fig. S3.
Representative whole-brain sections stained for TUNEL, ICAM, Iba1, and GFAP at 1 h after exposure of the left rat cortex to pFUS+MB. Dashed boxes represent areas where the immunofluorescent sections of the pFUS+MB-treated and contralateral cortex shown in Figs. 5 and 6 were obtained.
Fig. S4.
Fig. S4.
Isotype controls. Brain sections were stained with isotype control antibodies for histology to rule out unspecific staining. Representative images (scale bar, 100 μm) show (A) anti-sheep (albumin), (B) anti-mouse (CD68), (C) anti-rabbit (GFAP, Iba1), and (D) anti-goat (ICAM) antibody isotypes.
Fig. S5.
Fig. S5.
A representative IF GFAP-stained section from an animal killed 6 h after pFUS+MB demonstrating the appearance of fibrous astrocytes (box) consistent with astrogliosis associated with inflammatory changes in the parenchyma. (Scale bar, 100 μm.)

Comment in

References

    1. Schoknecht K, David Y, Heinemann U. The blood-brain barrier-gatekeeper to neuronal homeostasis: Clinical implications in the setting of stroke. Semin Cell Dev Biol. 2015;38:35–42. - PubMed
    1. Cardoso FL, et al. Systemic inflammation in early neonatal mice induces transient and lasting neurodegenerative effects. J Neuroinflammation. 2015;12:82. - PMC - PubMed
    1. Daneman R, Prat A. The blood-brain barrier. Cold Spring Harb Perspect Biol. 2015;7(1):a020412. - PMC - PubMed
    1. Cernak I, O’Connor C, Vink R. Inhibition of cyclooxygenase 2 by nimesulide improves cognitive outcome more than motor outcome following diffuse traumatic brain injury in rats. Exp Brain Res. 2002;147(2):193–199. - PubMed
    1. Denes A, Thornton P, Rothwell NJ, Allan SM. Inflammation and brain injury: Acute cerebral ischaemia, peripheral and central inflammation. Brain Behav Immun. 2010;24(5):708–723. - PubMed

Publication types

MeSH terms

LinkOut - more resources