. 2016 Dec 2:7:546.
doi: 10.3389/fimmu.2016.00546. eCollection 2016.

Transitional B Cells in Early Human B Cell Development - Time to Revisit the Paradigm?

Affiliations

Transitional B Cells in Early Human B Cell Development - Time to Revisit the Paradigm?

Victoria G Martin et al. Front Immunol. .

Abstract

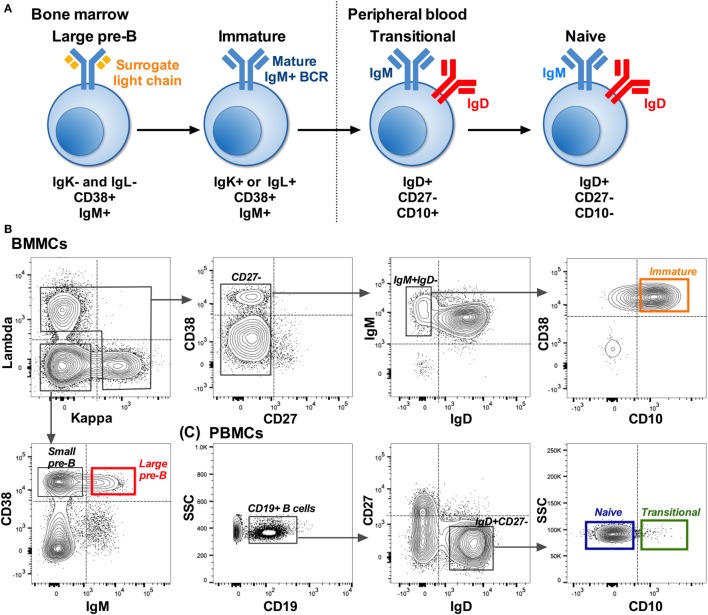
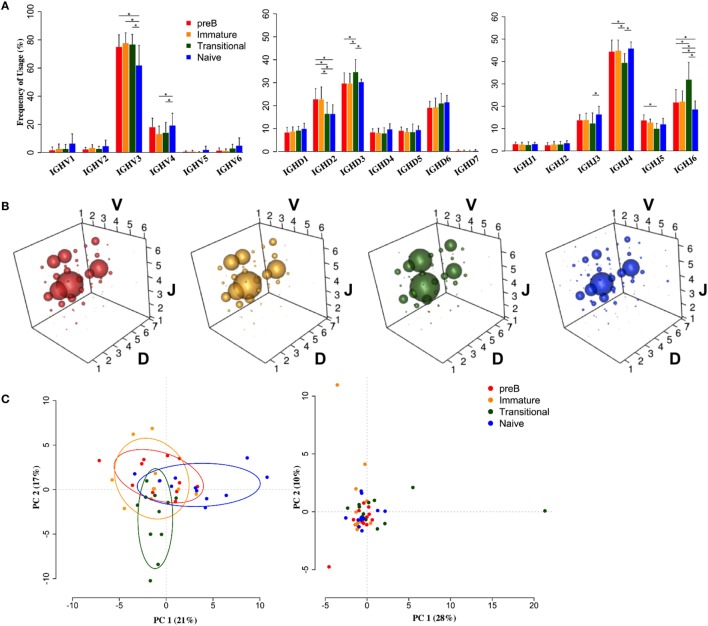
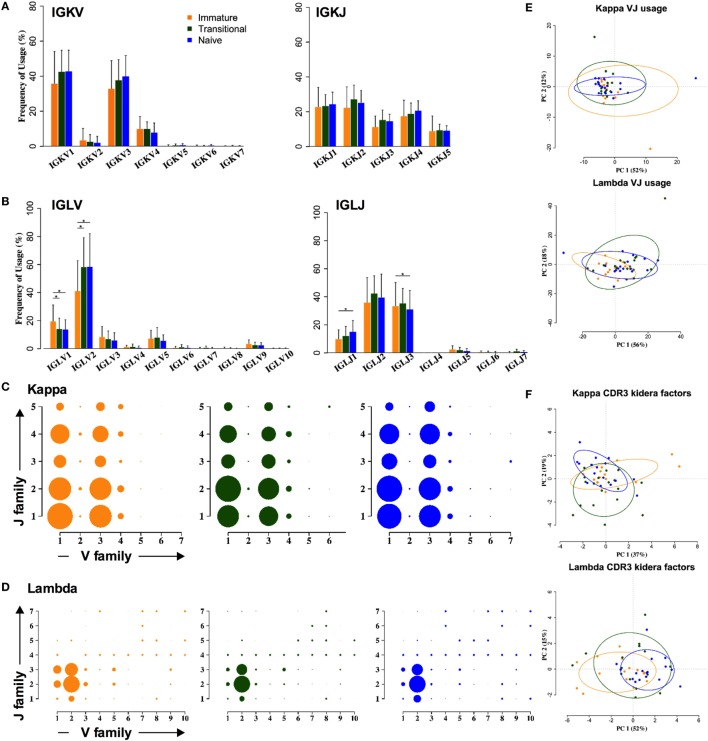
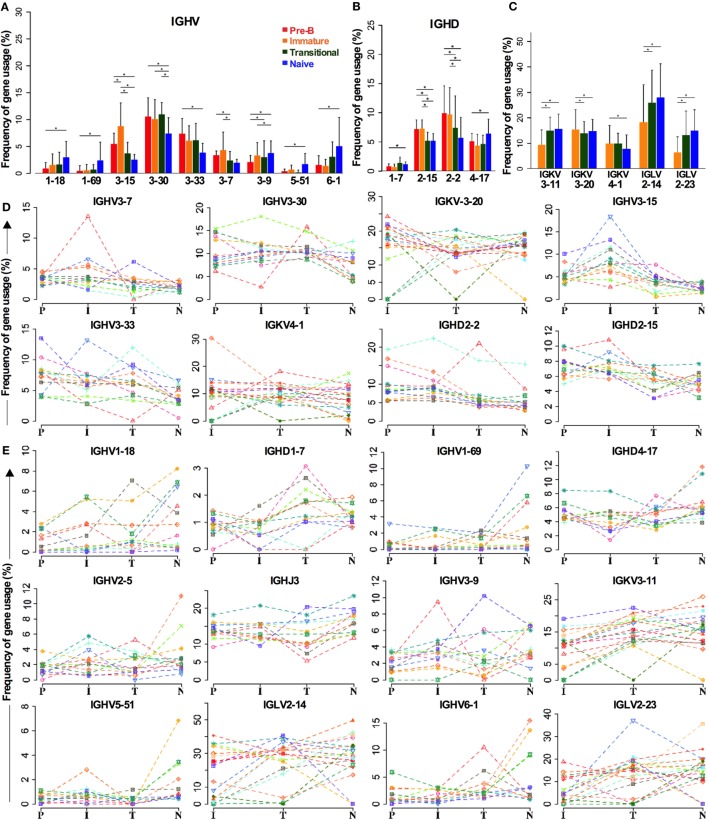
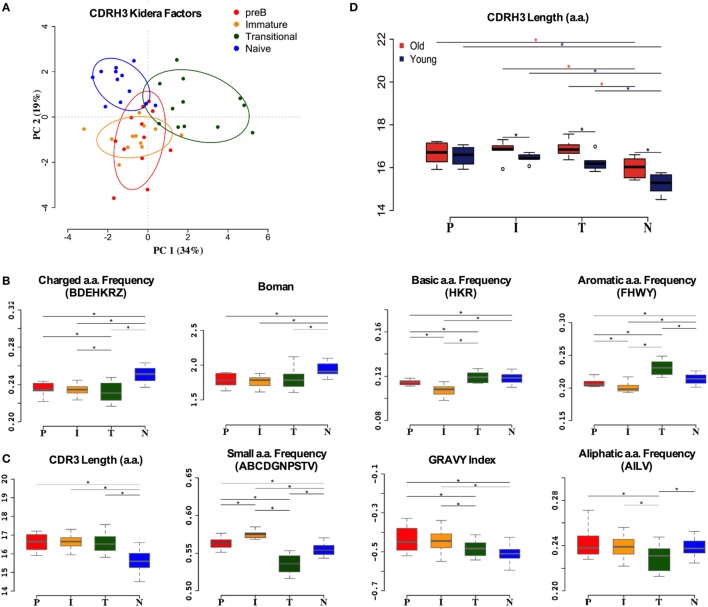
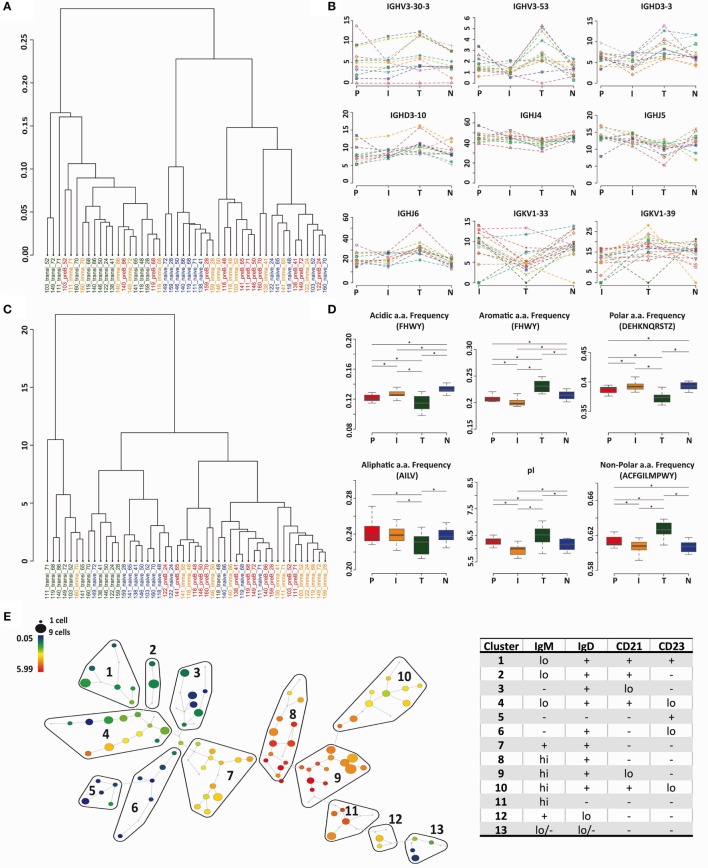
The B cell repertoire is generated in the adult bone marrow by an ordered series of gene rearrangement processes that result in massive diversity of immunoglobulin (Ig) genes and consequently an equally large number of potential specificities for antigen. As the process is essentially random, the cells exhibiting excess reactivity with self-antigens are generated and need to be removed from the repertoire before the cells are fully mature. Some of the cells are deleted, and some will undergo receptor editing to see if changing the light chain can rescue an autoreactive antibody. As a consequence, the binding properties of the B cell receptor are changed as development progresses through pre-B ≫ immature ≫ transitional ≫ naïve phenotypes. Using long-read, high-throughput, sequencing we have produced a unique set of sequences from these four cell types in human bone marrow and matched peripheral blood, and our results describe the effects of tolerance selection on the B cell repertoire at the Ig gene level. Most strong effects of selection are seen within the heavy chain repertoire and can be seen both in gene usage and in CDRH3 characteristics. Age-related changes are small, and only the size of the CDRH3 shows constant and significant change in these data. The paucity of significant changes in either kappa or lambda light chain repertoires implies that either the heavy chain has more influence over autoreactivity than light chain and/or that switching between kappa and lambda light chains, as opposed to switching within the light chain loci, may effect a more successful autoreactive rescue by receptor editing. Our results show that the transitional cell population contains cells other than those that are part of the pre-B ≫ immature ≫ transitional ≫ naïve development pathway, since the population often shows a repertoire that is outside the trajectory of gene loss/gain between pre-B and naïve stages.

Keywords: B cell development; bone marrow; human; regulatory B cells; transitional.


Figures

Figure 1
Figure 1
Isolation of B cells early in development. (A) B cell development pathway with phenotype used to distinguish each cell type. Starting from a CD19+ population: (B) Example showing the sorting strategy used to isolate pre-B (red: IgKIgLCD38+IgM+) and immature (orange: IgK+ or IgL+CD27IgM+IgDCD10+) B cells from bone marrow mononuclear cells (BMMCs). (C) Sorting strategy used to isolate transitional (green: IgD+CD27CD10+) and naïve (blue: IgD+CD27CD10) cells from matched peripheral blood mononuclear cells (PBMCs). Dotted lines on the plots represent the gates based on FMO controls, and the solid lined boxes represent the gating used to collect the different subsets.
Figure 2
Figure 2
Heavy chain VDJ gene family usage distinguishes cell types. (A) Mean frequency histograms of individual V, D, and J family usage for the heavy chain gene families of Pre-B (red), immature (yellow), transitional (green), and naïve (blue) cells (*p < 0.05 by two way ANOVA with multiple analysis correction. Error bars are SEM). (B) VDJ family combination usage in the different cell types. The size of a bubble represents the mean frequency of that VDJ combination. (C) Transitional and naïve cells show difference in VDJ family usage by principle component analysis (PCA) (left) compared to a randomise data set (right).
Figure 3
Figure 3
Light chain gene usage and CDR3 properties cannot distinguish between cell types. (A,B) V and J family usage for kappa (A) and lambda (B) light chain gene families between immature (yellow), transitional (green), and naïve cell types (*p < 0.05 by two way ANOVA with multiple analysis correction. Error bars are SEM). (C,D) Light chain VJ usage for kappa (C) and lambda (D) light chains in immature (yellow), transitional (green), and naïve (blue) B cells. The size of a circle indicates the relative mean frequency of the VJ combination. (E,F) Principle component analysis (PCA) of VJ usage (E) and Kidera factors (F) in three different cell types for kappa (top) and lambda (bottom).
Figure 4
Figure 4
Individual genes can be favored or disfavored as B cells mature. (A–C) Frequency of IGHV (A) and IGHD (B) gene usage in heavy chain and IGKV and IGLV usage in light chains (C) of different cell types are compared (*p < 0.05 by two way ANOVA with multiple analysis correction. Error bars are SEM). (D,E) The frequency for each cell type in each individual donor is shown for genes that are decreased during selection (D) and those that are increased (E).
Figure 5
Figure 5
Heavy chain CDR3 characteristics distinguish between cell types. (A) Distinction between the different cell types by Kidera factors as illustrated by principal component analysis (PCA). Distribution of CDRH3 physicochemical properties that have an increased trend from pre-B (P), immature (I), transitional (T) to naïve (N) cells (B), and a decrease in naïve cells compared to pre-B cells (C) (*p < 0.05 ANOVA). (D) The heavy chain CDR3 length in all cell types in young and old donors (young donors: 18–50 years; old donors: over 65 years) (*p < 0.05 ANOVA). Values on the y axis of (B–D) are as per the individual graph titles.
Figure 6
Figure 6
Transitional cells have a unique heavy chain immunoglobulin repertoire. (A,C) Minkowski distance clustering analysis of heavy chain VDJ family usage (A) and CDRH3 Kidera factors for pre-B (P) immature (I), transitional (T), and naïve (N) cells in each donor (C). (B) The frequency of gene use (%) for different cell types in each individual donor for genes that have a distinctive distribution in transitional cells. (D) CDRH3 physicochemical properties in different cell types for properties that have distinctive distributions in transitional cells (*p < 0.05 ANOVA). Values on the y axis are as per the individual graph titles. (E) High-dimensional clustering of CD24hiCD38hi transitional B cells indicates heterogeneity within the transitional population with respect to IgM expression, illustrated as a SPADE plot. Populations numbered 1–13 have been grouped according to the expression of IgM, IgD, CD21, and CD23, as shown in Figure S1 in Supplementary Material.

References

    1. Gathings WE, Lawton AR, Cooper MD. Immunofluorescent studies of the development of pre-B cells, B lymphocytes and immunoglobulin isotype diversity in humans. Eur J Immunol (1977) 7(11):804–10. - PubMed
    1. Hardy RR, Carmack CE, Shinton SA, Kemp JD, Hayakawa K. Resolution and characterization of pro-B and pre-pro-B cell stages in normal mouse bone marrow. J Exp Med (1991) 173(5):1213–25.10.1084/jem.173.5.1213 - DOI - PMC - PubMed
    1. Hardy RR, Hayakawa K. B cell development pathways. Annu Rev Immunol (2001) 19:595–621.10.1146/annurev.immunol.19.1.595 - DOI - PubMed
    1. Schroeder HW., Jr The evolution and development of the antibody repertoire. Front Immunol (2015) 6:33.10.3389/fimmu.2015.00033 - DOI - PMC - PubMed
    1. Santos P, Arumemi F, Park KS, Borghesi L, Milcarek C. Transcriptional and epigenetic regulation of B cell development. Immunol Res (2011) 50(2–3):105–12.10.1007/s12026-011-8225-y - DOI - PubMed

LinkOut - more resources