

Interpreting comprehensive two-dimensional gas chromatography using peak topography maps with application to petroleum forensics
- PMID: 27994639
- PMCID: PMC5125045
- DOI: 10.1186/s13065-016-0211-y
Interpreting comprehensive two-dimensional gas chromatography using peak topography maps with application to petroleum forensics
Abstract
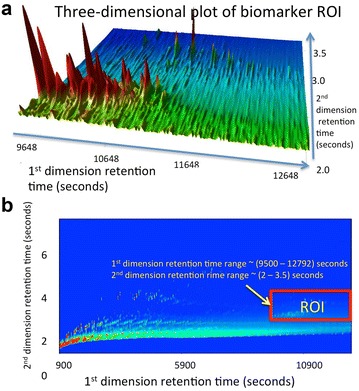
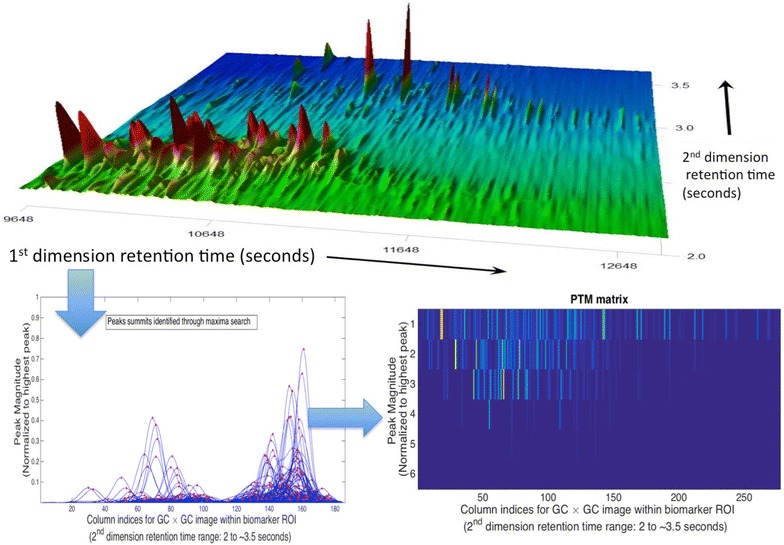
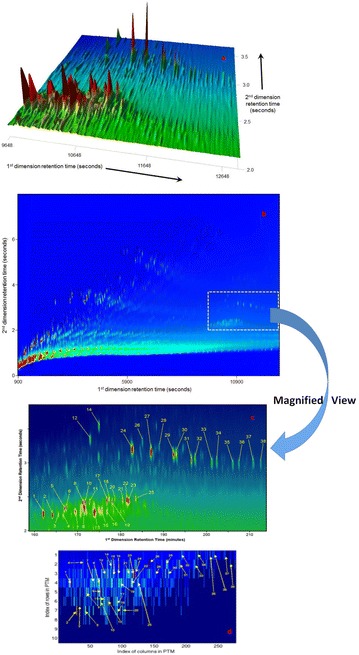
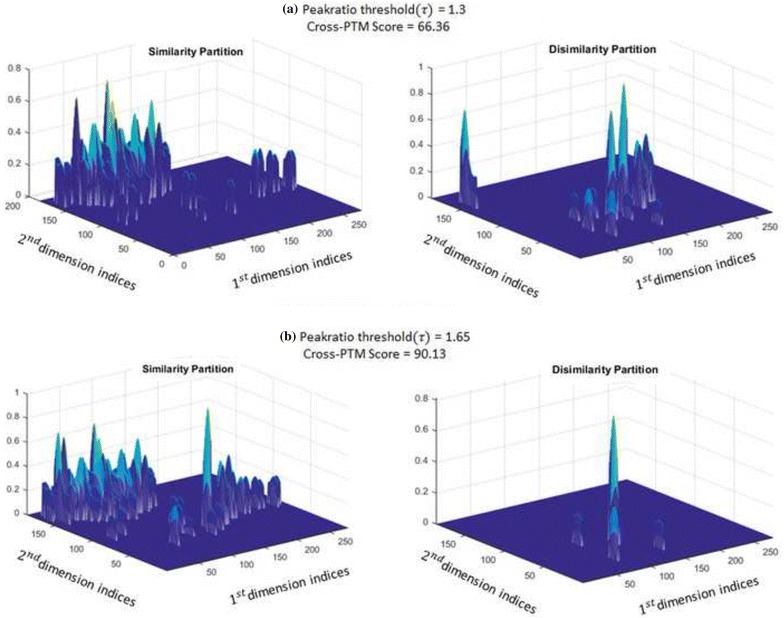
Background: Comprehensive two-dimensional gas chromatography [Formula: see text] provides high-resolution separations across hundreds of compounds in a complex mixture, thus unlocking unprecedented information for intricate quantitative interpretation. We exploit this compound diversity across the [Formula: see text] topography to provide quantitative compound-cognizant interpretation beyond target compound analysis with petroleum forensics as a practical application. We focus on the [Formula: see text] topography of biomarker hydrocarbons, hopanes and steranes, as they are generally recalcitrant to weathering. We introduce peak topography maps (PTM) and topography partitioning techniques that consider a notably broader and more diverse range of target and non-target biomarker compounds compared to traditional approaches that consider approximately 20 biomarker ratios. Specifically, we consider a range of 33-154 target and non-target biomarkers with highest-to-lowest peak ratio within an injection ranging from 4.86 to 19.6 (precise numbers depend on biomarker diversity of individual injections). We also provide a robust quantitative measure for directly determining "match" between samples, without necessitating training data sets.
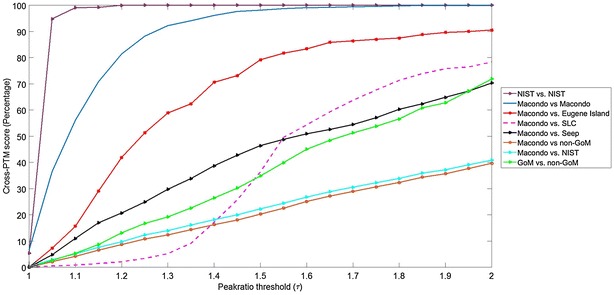
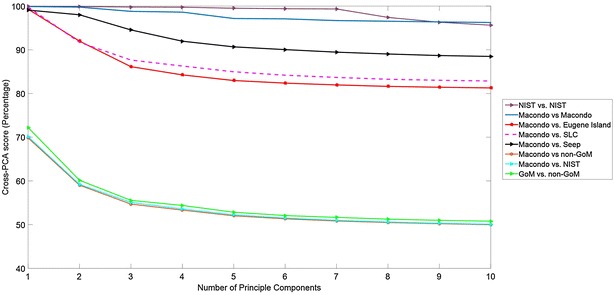
Results: We validate our methods across 34 [Formula: see text] injections from a diverse portfolio of petroleum sources, and provide quantitative comparison of performance against established statistical methods such as principal components analysis (PCA). Our data set includes a wide range of samples collected following the 2010 DeepwaterHorizon disaster that released approximately 160 million gallons of crude oil from the Macondo well (MW). Samples that were clearly collected following this disaster exhibit statistically significant match [Formula: see text] using PTM-based interpretation against other closely related sources. PTM-based interpretation also provides higher differentiation between closely correlated but distinct sources than obtained using PCA-based statistical comparisons. In addition to results based on this experimental field data, we also provide extentive perturbation analysis of the PTM method over numerical simulations that introduce random variability of peak locations over the [Formula: see text] biomarker ROI image of the MW pre-spill sample (sample [Formula: see text] in Additional file 4: Table S1). We compare the robustness of the cross-PTM score against peak location variability in both dimensions and compare the results against PCA analysis over the same set of simulated images. Detailed description of the simulation experiment and discussion of results are provided in Additional file 1: Section S8.
Conclusions: We provide a peak-cognizant informational framework for quantitative interpretation of [Formula: see text] topography. Proposed topographic analysis enables [Formula: see text] forensic interpretation across target petroleum biomarkers, while including the nuances of lesser-known non-target biomarkers clustered around the target peaks. This allows potential discovery of hitherto unknown connections between target and non-target biomarkers.
Keywords: Chromatography; GC × GC; Multivariate statistics; Oil-spill forensics; Principal component analysis; Quantitative interpretation.
Figures
Similar articles
-
Global peak alignment for comprehensive two-dimensional gas chromatography mass spectrometry using point matching algorithms.J Bioinform Comput Biol. 2016 Dec;14(6):1650032. doi: 10.1142/S0219720016500323. Epub 2016 Sep 9. J Bioinform Comput Biol. 2016. PMID: 27650662 Free PMC article.
-
Application of enhanced gas chromatography/triple quadrupole mass spectrometry for monitoring petroleum weathering and forensic source fingerprinting in samples impacted by the Deepwater Horizon oil spill.Chemosphere. 2017 Oct;184:939-950. doi: 10.1016/j.chemosphere.2017.06.077. Epub 2017 Jun 19. Chemosphere. 2017. PMID: 28655113
-
Forensic fingerprinting and source identification of the 2009 Sarnia (Ontario) oil spill.J Environ Monit. 2011 Nov;13(11):3004-17. doi: 10.1039/c1em10620a. Epub 2011 Sep 28. J Environ Monit. 2011. PMID: 21956546
-
Quantification in comprehensive two-dimensional gas chromatography and a model of quantification based on selected summed modulated peaks.J Chromatogr A. 2008 Mar 14;1184(1-2):323-40. doi: 10.1016/j.chroma.2007.10.041. Epub 2007 Oct 22. J Chromatogr A. 2008. PMID: 17996244 Review.
-
Comprehensive Two-Dimensional Gas Chromatography in Petroleum Derived Samples: A Review on Advances in Source and Weathering Studies of Spilled Oil.Crit Rev Anal Chem. 2024;54(8):3409-3427. doi: 10.1080/10408347.2023.2250858. Epub 2023 Aug 26. Crit Rev Anal Chem. 2024. PMID: 37632737 Review.
Cited by
-
Signal Processing Methods to Interpret Polychlorinated Biphenyls in Airborne Samples.IEEE Access. 2020;8:147738-147755. doi: 10.1109/ACCESS.2020.3013108. Epub 2020 Aug 14. IEEE Access. 2020. PMID: 33335823 Free PMC article.
-
Interpol review of fire investigation 2016-2019.Forensic Sci Int Synerg. 2020 Mar 10;2:368-381. doi: 10.1016/j.fsisyn.2020.01.005. eCollection 2020. Forensic Sci Int Synerg. 2020. PMID: 33385136 Free PMC article. Review.
-
Are We Ready for It? A Review of Forensic Applications and Readiness for Comprehensive Two-Dimensional Gas Chromatography in Routine Forensic Analysis.J Sep Sci. 2025 Apr;48(4):e70138. doi: 10.1002/jssc.70138. J Sep Sci. 2025. PMID: 40259530 Free PMC article. Review.
References
-
- Jolliffe I (2002) Principal component analysis. Hoboken, Wiley
-
- Wang Z, Fingas M. Differentiation of the source of spilled oil and monitoring of the oil weathering process using gas chromatography-mass spectrometry. J Chromatogr A. 1995;712(2):321–343. doi: 10.1016/0021-9673(95)00546-Y. - DOI
-
- Ligon WV, May RJ. Target compound analysis by two-dimensional gas chromatography-mass spectrometry. J Chromatogr A. 1984;294:77–86. doi: 10.1016/S0021-9673(01)96116-3. - DOI
-
- Peters KE, Moldowan JM. The biomarker guide: interpreting molecular fossils in petroleum and ancient sediments. Prentice Hall: Englewood Cliffs; 1993.
-
- Bayona JM, Domínguez C, Albaigés J. Analytical developments for oil spill fingerprinting. Trends Environ Anal Chem. 2015;5:26–34. doi: 10.1016/j.teac.2015.01.004. - DOI
LinkOut - more resources
Full Text Sources
Other Literature Sources
Miscellaneous
