

Magnetic susceptibility in the deep layers of the primary motor cortex in Amyotrophic Lateral Sclerosis
- PMID: 27995062
- PMCID: PMC5153607
- DOI: 10.1016/j.nicl.2016.04.011
Magnetic susceptibility in the deep layers of the primary motor cortex in Amyotrophic Lateral Sclerosis
Abstract
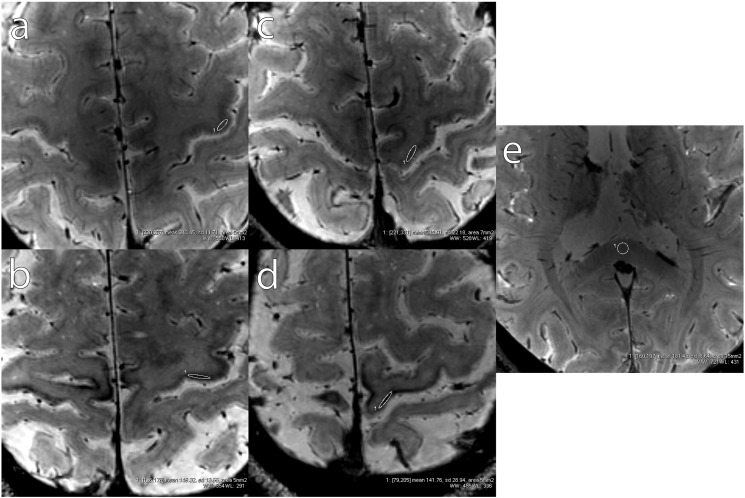
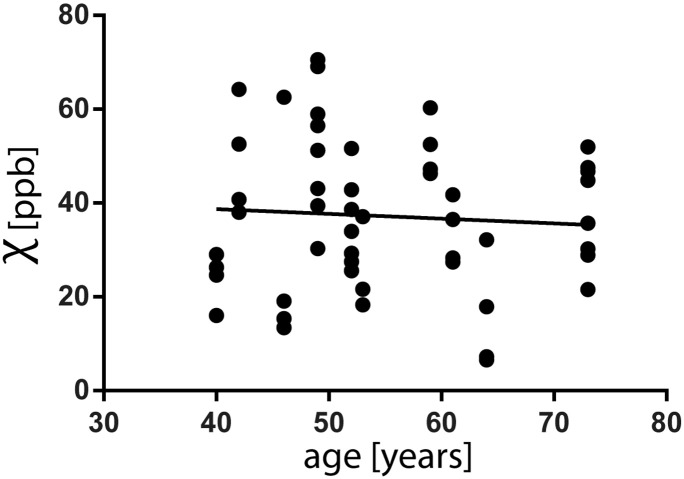
Amyotrophic Lateral Sclerosis (ALS) is a progressive neurological disorder that entails degeneration of both upper and lower motor neurons. The primary motor cortex (M1) in patients with upper motor neuron (UMN) impairment is pronouncedly hypointense in Magnetic Resonance (MR) T2* contrast. In the present study, 3D gradient-recalled multi-echo sequences were used on a 7 Tesla MR system to acquire T2*-weighted images targeting M1 at high spatial resolution. MR raw data were used for Quantitative Susceptibility Mapping (QSM). Measures of magnetic susceptibility correlated with the expected concentration of non-heme iron in different regions of the cerebral cortex in healthy subjects. In ALS patients, significant increases in magnetic susceptibility co-localized with the T2* hypointensity observed in the middle and deep layers of M1. The magnetic susceptibility, hence iron concentration, of the deep cortical layers of patients' M1 subregions corresponding to Penfield's areas of the hand and foot in both hemispheres significantly correlated with the clinical scores of UMN impairment of the corresponding limbs. QSM therefore reflects the presence of iron deposits related to neuroinflammatory reaction and cortical microgliosis, and might prove useful in estimating M1 iron concentration, as a possible radiological sign of severe UMN burden in ALS patients.
Figures


References
-
- Adachi Y., Sato N., Saito Y., Kimura Y., Nakata Y., Ito K., Kamiya K., Matsuda H., Tsukamoto T., Ogawa M. Usefulness of SWI for the detection of iron in the motor cortex in amyotrophic lateral sclerosis. J. Neuroimaging. 2015;25:443–451. - PubMed
-
- Barbosa J.H.O., Santos A.C., Tumas V., Liu M., Zheng W., Haacke E.M., Salmon C.E.G. Quantifying brain iron deposition in patients with Parkinson's disease using quantitative susceptibility mapping, R2 and R2*. Magn. Reson. Imaging. 2015 - PubMed
-
- Brooks B.R., Miller R.G., Swash M., Munsat T.L., World Federation of Neurology Research Group on Motor Neuron Diseases . Presented at the Amyotrophic Lateral Sclerosis and Other Motor Neuron Disorders: Official Publication of the World Federation of Neurology, Research Group on Motor Neuron Diseases. 2000. El Escorial revisited: revised criteria for the diagnosis of amyotrophic lateral sclerosis; pp. 293–299. - PubMed
-
- Cedarbaum J.M., Stambler N., Malta E., Fuller C., Hilt D., Thurmond B., Nakanishi A. The ALSFRS-R: a revised ALS functional rating scale that incorporates assessments of respiratory function. BDNF ALS Study Group (Phase III) J. Neurol. Sci. 1999;169:13–21. - PubMed
-
- Cosottini M., Giannelli M., Siciliano G., Lazzarotti G., Michelassi M.C., Del Corona A., Bartolozzi C., Murri L. Diffusion-tensor MR imaging of corticospinal tract in amyotrophic lateral sclerosis and progressive muscular atrophy. Radiology. 2005;237:258–264. - PubMed
Publication types
MeSH terms
Substances
LinkOut - more resources
Full Text Sources
Other Literature Sources
Medical
Miscellaneous
