. 2017 Apr;16(2):262-272.
doi: 10.1111/acel.12549. Epub 2016 Dec 20.

Identification of miR-31-5p, miR-141-3p, miR-200c-3p, and GLT1 as human liver aging markers sensitive to donor-recipient age-mismatch in transplants

Affiliations

Identification of miR-31-5p, miR-141-3p, miR-200c-3p, and GLT1 as human liver aging markers sensitive to donor-recipient age-mismatch in transplants

Miriam Capri et al. Aging Cell. 2017 Apr.

Abstract

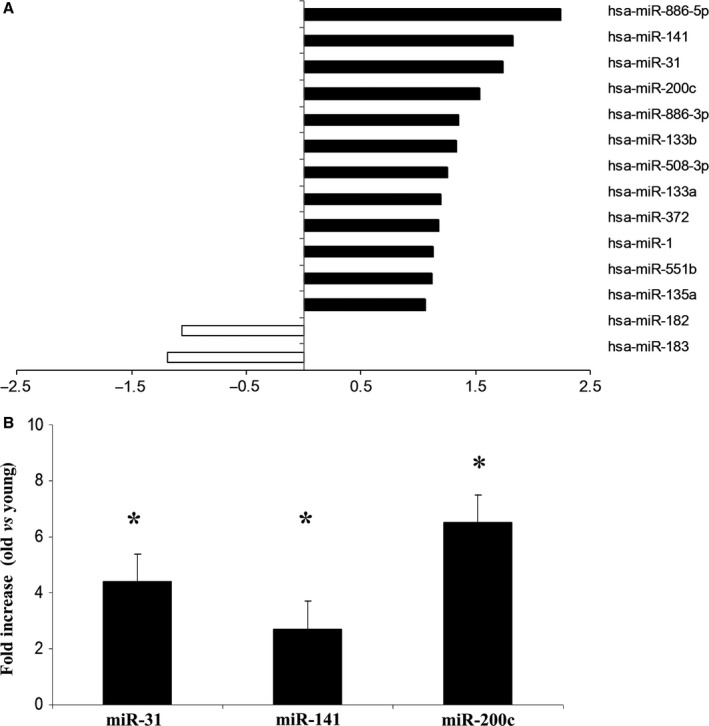
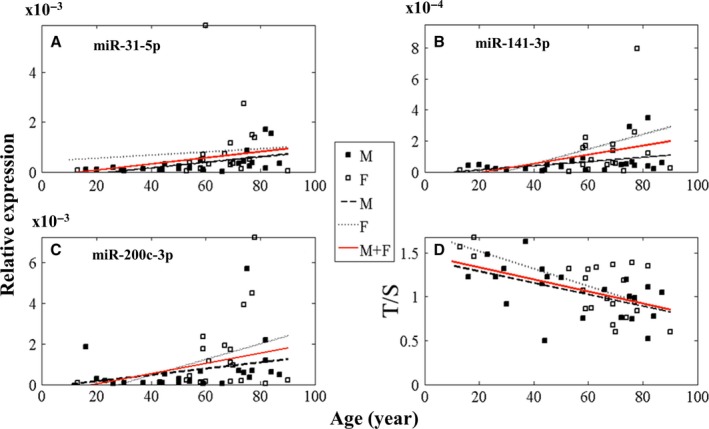
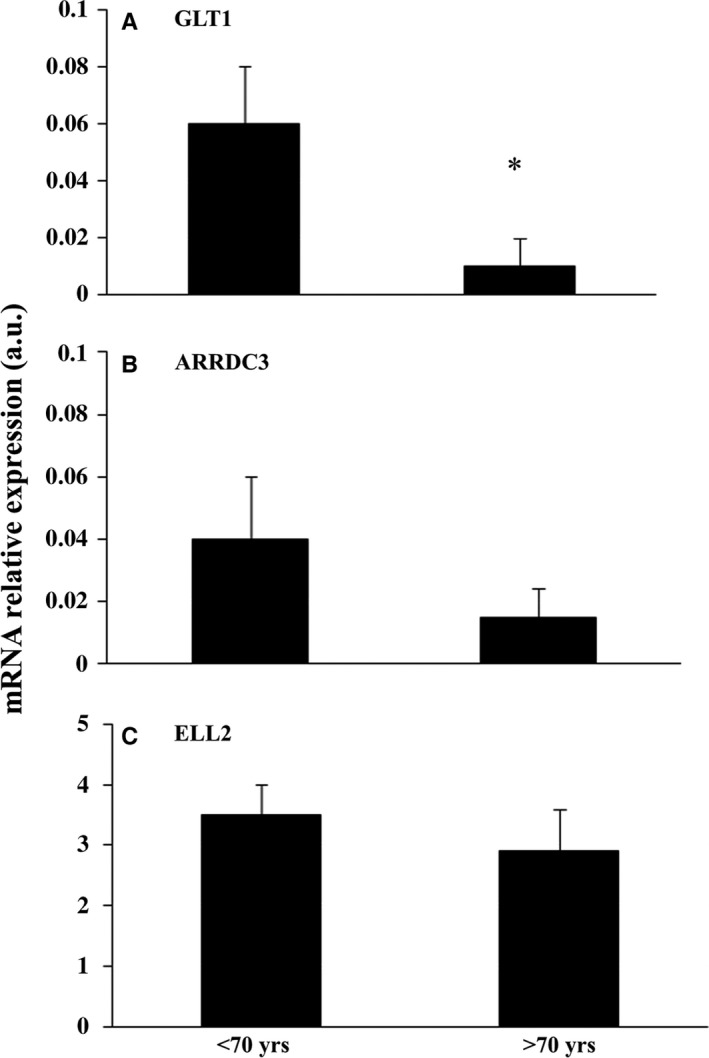
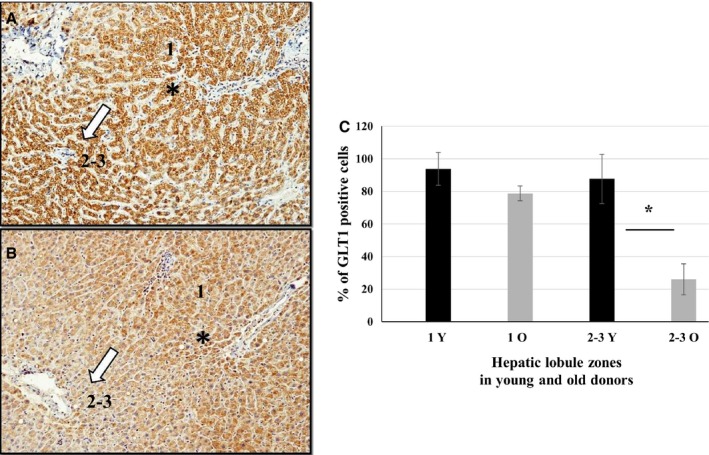
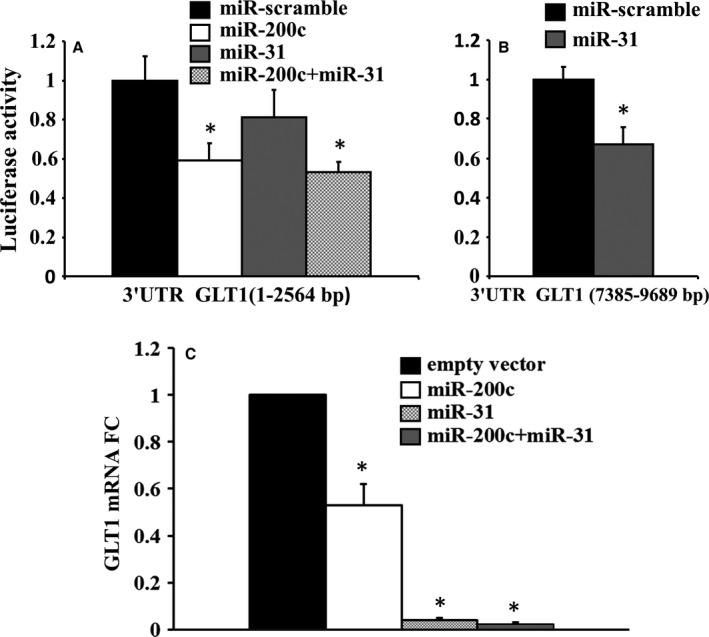
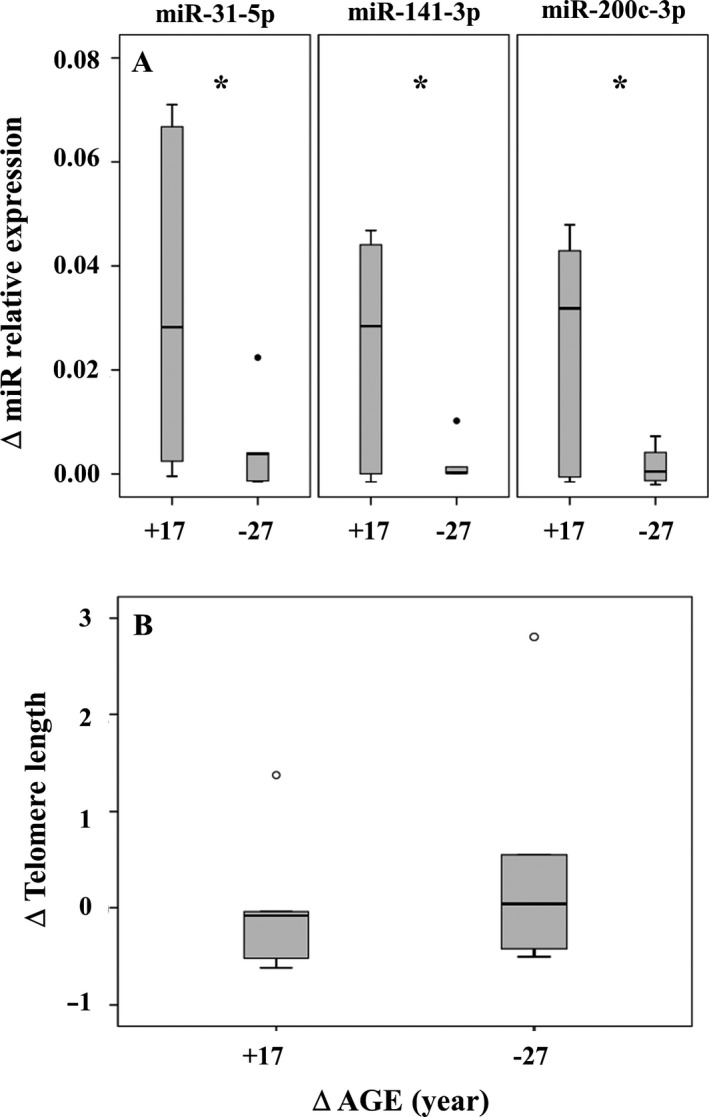
To understand why livers from aged donors are successfully used for transplants, we looked for markers of liver aging in 71 biopsies from donors aged 12-92 years before transplants and in 11 biopsies after transplants with high donor-recipient age-mismatch. We also assessed liver function in 36 age-mismatched recipients. The major findings were the following: (i) miR-31-5p, miR-141-3p, and miR-200c-3p increased with age, as assessed by microRNAs (miRs) and mRNA transcript profiling in 12 biopsies and results were validated by RT-qPCR in a total of 58 biopsies; (ii) telomere length measured by qPCR in 45 samples showed a significant age-dependent shortage; (iii) a bioinformatic approach combining transcriptome and miRs data identified putative miRs targets, the most informative being GLT1, a glutamate transporter expressed in hepatocytes. GLT1 was demonstrated by luciferase assay to be a target of miR-31-5p and miR-200c-3p, and both its mRNA (RT-qPCR) and protein (immunohistochemistry) significantly decreased with age in liver biopsies and in hepatic centrilobular zone, respectively; (iv) miR-31-5p, miR-141-3p and miR-200c-3p expression was significantly affected by recipient age (older environment) as assessed in eleven cases of donor-recipient extreme age-mismatch; (v) the analysis of recipients plasma by N-glycans profiling, capable of assessing liver functions and biological age, showed that liver function recovered after transplants, independently of age-mismatch, and recipients apparently 'rejuvenated' according to their glycomic age. In conclusion, we identified new markers of aging in human liver, their relevance in donor-recipient age-mismatches in transplantation, and offered positive evidence for the use of organs from old donors.

Keywords: GLT1; N-glycans; age-mismatches; allograft; elderly donors; microRNAs; telomere length.


Figures

Figure 1
Figure 1
(A) Age‐related miR profiling results. The most significant results analyzing liver biopsies obtained from 12 men (three old > 70 years vs. nine younger donors). Each bar corresponds to expression fold changes, using ΔCt and ΔΔCt methods with normalization on the median value of miRs expression in each card (see material methods). A 1.5‐fold change or greater was considered significant. (B) MiRs relative expression validation in liver from 26 male donors. miR relative expression by RTqPCR in 26 liver biopsies (nine old > 70 years vs. 17 younger donors). Data were normalized against RNU44 expression levels. *P values <0.05, independent samples t‐test.
Figure 2
Figure 2
MiR‐31‐5p (panel A), miR‐141‐3p (panel B), miR‐200c‐3p (panel C) relative expression and telomere length (T/S, panel D) in 45 liver biopsies from 13 years up to 90 years donors vs. age. Open squares: Females (n 19); closed squares: males (n 26). Red line: linear regression over all samples; dotted line: linear regression over female samples; dashed line: linear regression over male samples. Spearman's correlation coefficient r between age and each parameter (miRs, T/S) is calculated over all samples. Panel A: miR‐31‐5p r = 0.3703, P = 0.0221; panel B: miR‐141‐3p r = 0.3336, P = 0.0407; panel C: miR‐200c‐3p r = 0.3116, P = 0.0568; panel D: telomere length r = −0.4625, P = 0.0035
Figure 3
Figure 3
mRNA expression of GLT1 (SLC1A2, panel A), ARRDC3 (panel B), and ELL2 (panel C) in 26 liver biopsies. RTqPCR expression analyses of mRNA target levels in liver of young (n 14, < 70 years) and old (n 12, ≥ 70 years) donors. Data were normalized against GAPDH expression levels and reported as the mean value ± SD. *P values <0.05, independent samples t‐test.
Figure 4
Figure 4
GLT1 immunohistochemistry analysis of young (Y, panel A) and old (O, panel B) donors. A representative analysis is reported in the panels A and B. Perivenular zones (asterisk, Z‐1) and periportal/centrilobular zones (open arrow, Z‐2‐3) were analyzed in seven young and seven old (≥ 70 years) donors. Data are reported as mean ± SD in panel C: 257 (150 from Y; 107 from O) perivenular zones (Z‐1) and 198 periportal/centrilobular zones (Z‐2‐3) (108 from Y, 90 from O) were scored for GLT1 staining (two grades of intensity were relieved, i.e., weak and strong). *P values <0.05, nonparametric Mann–Whitney U‐test.
Figure 5
Figure 5
Luciferase (panels A, B) and functional assays (panel C). HEK 293 was transfected with firefly luciferase constructs containing different portions indicated in figure of 3′UTR of GLT1 (SLC1A2) gene. A. Each 3′UTR cloned in pEZXMT06 plasmid was cotransfected with a plasmid encoding either miR‐200c or miR‐31 or cotransfected with both miRs. As control, miR‐scramble sequence was used. Values were normalized according to renilla luciferase activity (n = 3 in triplicate; *P < 0.02). miR‐200c downmodulated the luciferase activity of 3′UTR construct. B. The different 3′UTR cloned in pEZXMT06 plasmid was cotransfected with a plasmid encoding either miR‐200c or miR‐31 or miR‐scramble. miR‐31 downmodulated the luciferase activity of 3′UTR construct (n = 3 in triplicate; *P < 0.02). C. A significant decrease in GLT1 mRNA expression was found in HepG2 cells transfected with miR‐31 mimic, miR‐200c mimic, and miR‐31 plus miR‐200c mimics (n = 3; *P < 0.05).
Figure 6
Figure 6
Δ miRs relative expression (panel A) and telomere length (panel B) in liver before (donor) and after (recipient) transplant. A. MiR‐31‐5p; miR‐141‐3p; miR‐200c‐3p were evaluated in 11 recipients: six older than their donors (Δ age average: +17 years); five younger than their donors (Δ age average: −27 years) after 15 ± 7 months and 10 ± 2 months from transplant, respectively. B. Telomere lengths were evaluated in the same donor–recipients (except one). *miR‐31‐5p; miR‐141‐3p; miR‐200c‐3p: P values = 0.05; 0.03; 0.02, respectively (one‐side paired samples t‐test).
Figure 7
Figure 7
Plasma Glycotests. A. Glycotest values of 14 recipients before and after liver transplant and of ten age‐matched healthy volunteers. The box‐plots show median, minimal and maximal values (whiskers), mean (red cross) interquartile ranges (box), as well as outliers (blue circles) for the log ratio of relative intensity of the N‐glycan features listed over the plots referring to each Glycotest. Differences before and after transplantation were tested by Wilcoxon signed‐ranks differences post‐transplantation, and healthy volunteers were tested by Kruskal–Wallis. For each comparison, the P ‐values are indicated. B. Glycotest values of recipients after transplant, stratified in three groups (A, B, C) according to the age‐mismatches between donors and recipients: A. Donors younger (31 ± 15.6 years) than recipients (54.9 ± 8.3 years; n = 9) with age‐mismatch range from −42 to −14 years; B. Donors and recipients with similar ages (n = 9), age‐mismatch range from −7 to +8 years; C. Donors older (76.3 ± 9.3 years) than recipients (46.4 ± 10 years; n = 18) with age‐mismatch range from +53 to +12 years. Differences among the groups were tested using Kruskal–Wallis.

References

    1. Agrawal P, Kurcon T, Pilobello KT, Rakus JF, Koppolu S, Liu Z, Batista BS, Eng WS, Hsu KL, Liang Y, Mahal LK (2014) Mapping posttranscriptional regulation of the human glycome uncovers microRNA defining the glycocode. Proc. Natl. Acad. Sci. USA. 111, 4338–4343. - PMC - PubMed
    1. Albertini MC, Olivieri F, Lazzarini R, Pilolli F, Galli F, Spada G, Accorsi A, Rippo MR, Procopio AD (2011) Predicting microRNA modulation in human prostate cancer using a simple String IDentifier (SID1.0). J. Biomed. Inform. 44, 615–620. - PubMed
    1. Banaudha K, Kaliszewski M, Korolnek T, Florea L, Yeung ML, Jeang KT, Kumar A (2011) MicroRNA silencing of tumor suppressor DLC‐1 promotes efficient hepatitis C virus replication in primary human hepatocytes. Hepatology 53, 53–61. - PubMed
    1. Bates DJ, Li N, Liang R, Sarojini H, An J, Masternak MM, Bartke A, Wang E (2010) MicroRNA regulation in Ames dwarf mouse liver may contribute to delayed aging. Aging Cell 9, 1–18. - PMC - PubMed
    1. Berger UV, Hediger MA (2006) Distribution of the glutamate transporters GLT‐1 (SLC1A2) and GLAST (SLC1A3) in peripheral organs. Anat. Embryol. 211, 595–606. - PubMed

MeSH terms

LinkOut - more resources