. 2017 Apr;16(2):281-292.
doi: 10.1111/acel.12551. Epub 2016 Dec 20.

TRIAD3/RNF216 mutations associated with Gordon Holmes syndrome lead to synaptic and cognitive impairments via Arc misregulation

Affiliations

TRIAD3/RNF216 mutations associated with Gordon Holmes syndrome lead to synaptic and cognitive impairments via Arc misregulation

Nilofer Husain et al. Aging Cell. 2017 Apr.

Abstract

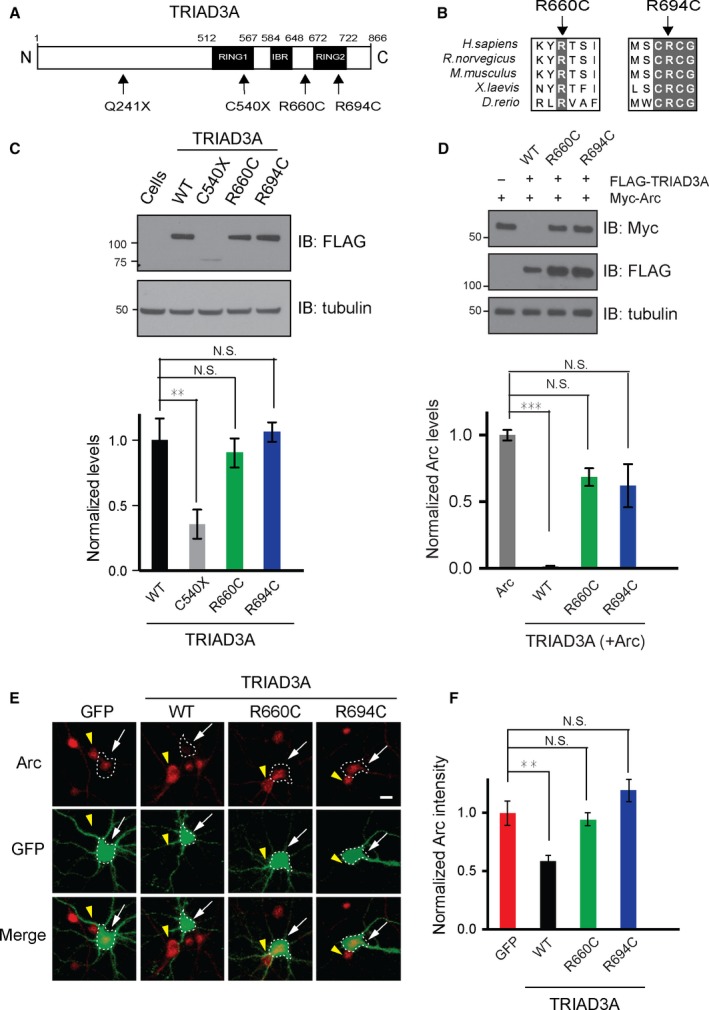
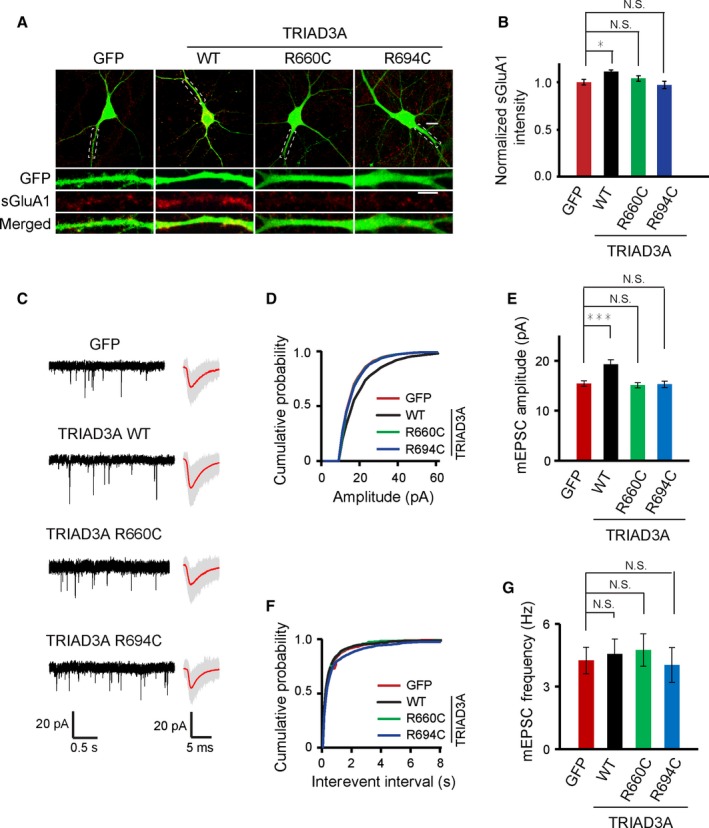
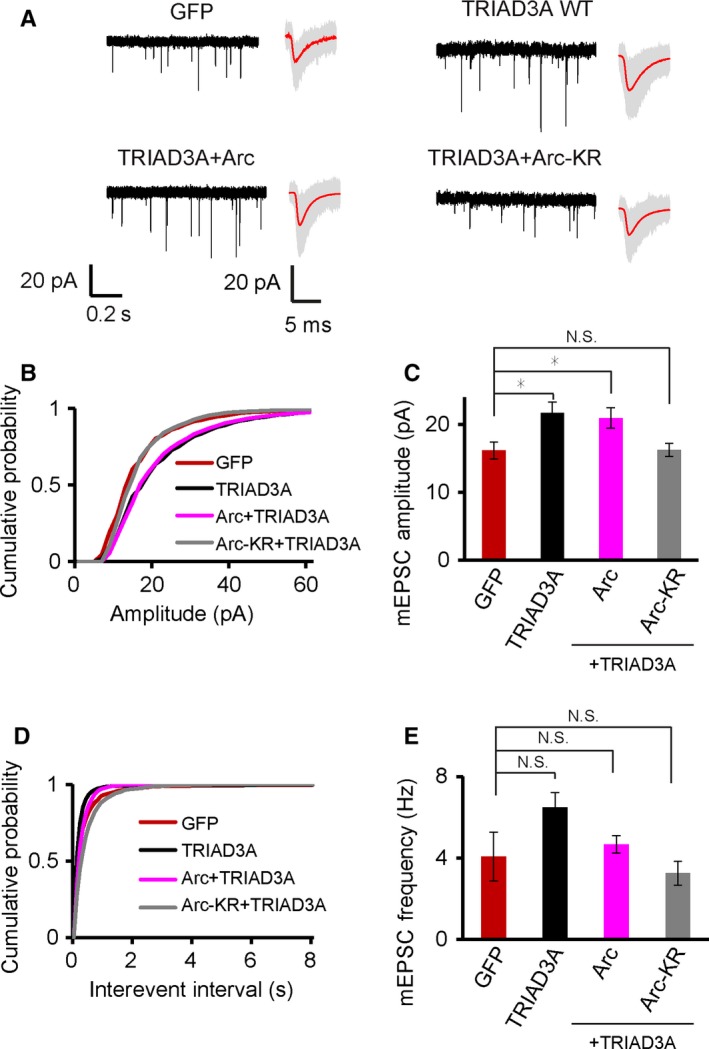
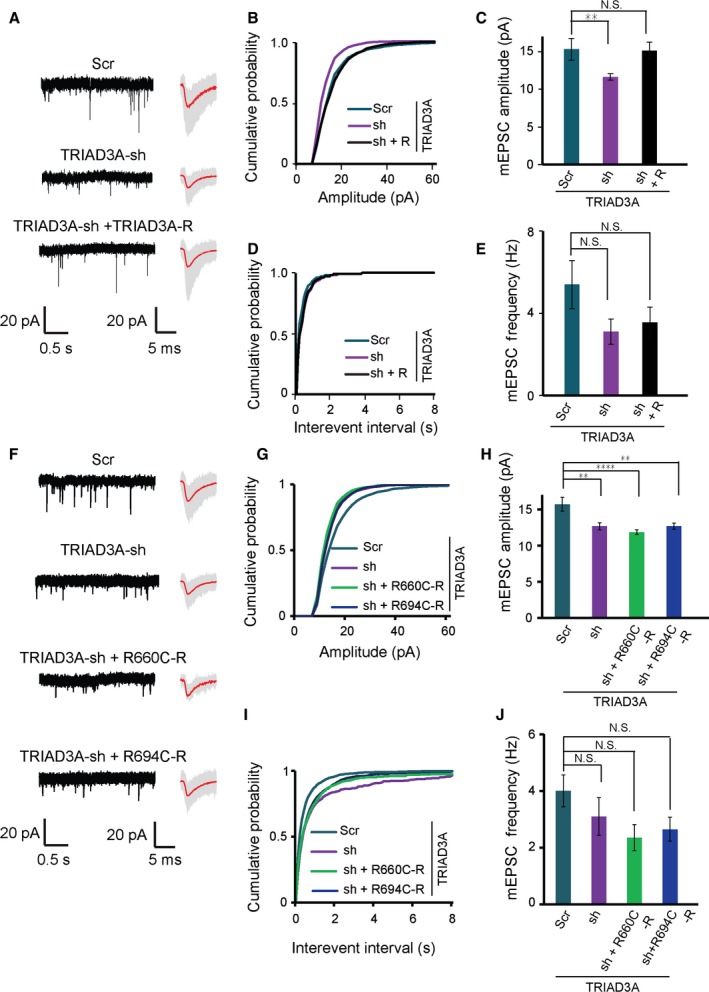
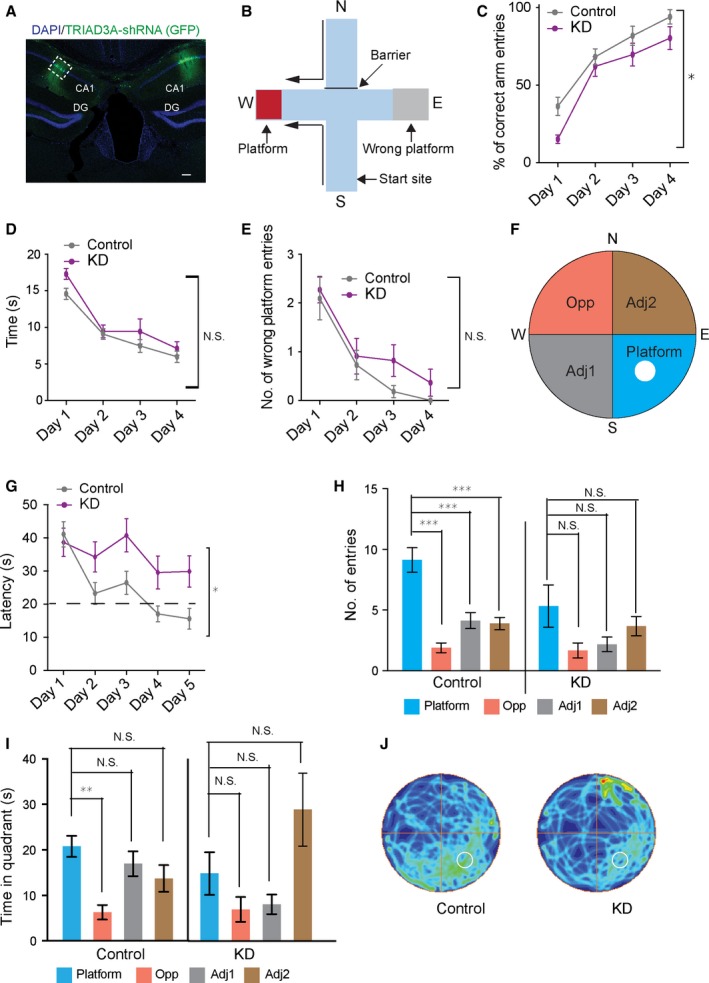
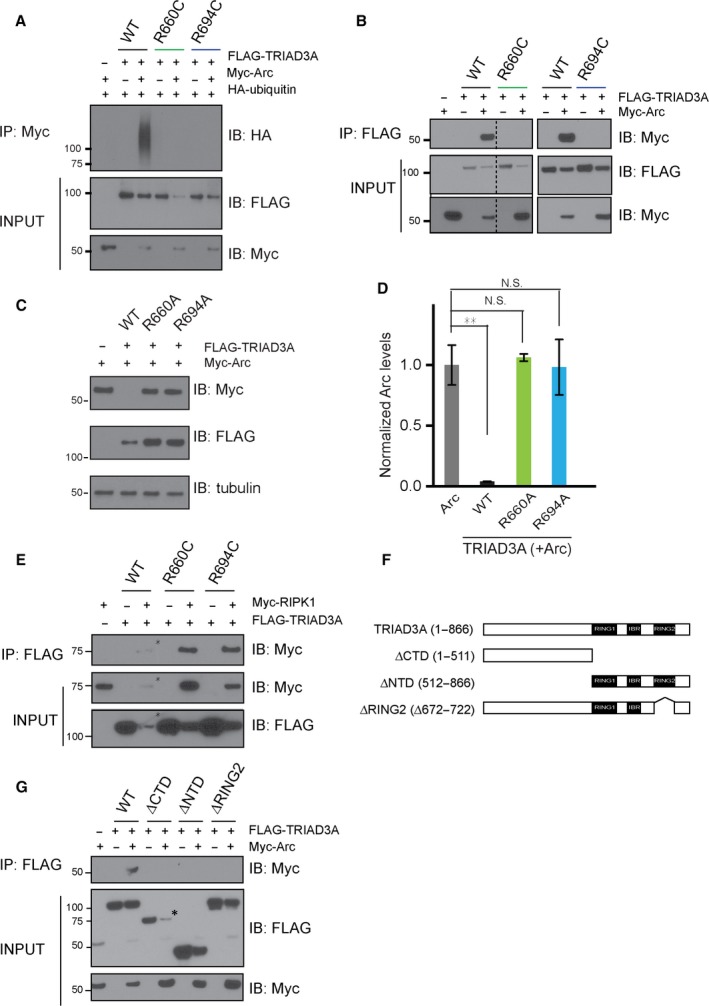
Multiple loss-of-function mutations in TRIAD3 (a.k.a. RNF216) have recently been identified in patients suffering from Gordon Holmes syndrome (GHS), characterized by cognitive decline, dementia, and movement disorders. TRIAD3A is an E3 ubiquitin ligase that recognizes and facilitates the ubiquitination of its target for degradation by the ubiquitin-proteasome system (UPS). Here, we demonstrate that two of these missense substitutions in TRIAD3 (R660C and R694C) could not regulate the degradation of their neuronal target, activity-regulated cytoskeletal-associated protein (Arc/Arg 3.1), whose expression is critical for synaptic plasticity and memory. The synaptic deficits due to the loss of endogenous TRIAD3A could not be rescued by TRIAD3A harboring GHS-associated missense mutations. Moreover, we demonstrate that the loss of endogenous TRIAD3A in the mouse hippocampal CA1 region led to deficits in spatial learning and memory. Finally, we show that these missense mutations abolished the interaction of TRIAD3A with Arc, disrupting Arc ubiquitination, and consequently Arc degradation. Our current findings of Arc misregulation by TRIAD3A variants suggest that loss-of-function mutations in TRIAD3A may contribute to dementia observed in patients with GHS driven by dysfunctional UPS components, leading to cognitive impairments through the synaptic protein Arc.

Keywords: Gordon Holmes syndrome; TRIAD3; activity-regulated cytoskeletal protein (Arc/Arg 3.1); behavior; dementia; learning and memory; synapse; ubiquitination.


Figures

Figure 1
Figure 1
TRIAD3A variants do not degrade Arc. (A) TRIAD3A is an 866‐aa‐long protein (white) consisting of two RING domains, RING1 and RING2, which are separated by an in‐between RING fingers (IBR) domain. The positions of the four variants identified in patients with GHS are labeled. (B) TRIAD3A residues R660 and R694 are conserved across different organisms (human, rat, mouse, frog, and zebrafish). (C) Top panel: Western blot analyses were performed on HEK293T lysates overexpressing FLAG‐tagged TRIAD3A variants and blotted with an anti‐FLAG antibody and an anti‐tubulin antibody (loading control). Bottom panel: Quantification of TRIAD3A and TRIAD3A variants are depicted as the mean ± SEM (one‐way ANOVA, **P < 0.01, n = 4). (D) Top panel: HEK293T cells were cotransfected with 0.25 μg of Arc and 1 μg of WT TRIAD3A or TRIAD3A variants as indicated. Reduction in Arc levels is observed when Arc (α‐Myc) is co‐expressed with WT TRIAD3A, but not TRIAD3A point mutants. Bottom panel: Quantification of Arc levels when 1.0 μg WT TRIAD3A or TRIAD3A variants were overexpressed in HEK293T cells. The data represent the mean ± SEM. Statistical significance was assessed by one‐way ANOVA and Student's t‐test (***P < 0.001), n = 3. (E) Representative images of cultured cortical neurons transfected with GFP, WT TRIAD3A, TRIAD3A‐R660C (R660C), or TRIAD3A‐R694C (R694C). The white arrows indicate a transfected neuron whereas the yellow arrowhead indicates an untransfected neuron. Scale bar, 5 μm. (F) Histograms of results for GFP (n = 19), TRIAD3A (n = 34), R660C (n = 48), or R694C (n = 32). All histogram data are shown as the mean ± SEM. Statistical significance was assessed by one‐way ANOVA (*P < 0.05, **P < 0.01, ***P < 0.001).
Figure 2
Figure 2
Increase in synaptic strength is impaired by the overexpression of the TRIAD3A variants. (A) Representative images of cortical neurons overexpressing GFP (control), wild‐type TRIAD3A (WT), TRIAD3A‐R660C (R660C), or TRIAD3A‐R694C (R694C) obtained after live antibody feeding with an anti‐GluA1 antibody are shown. Scale bars: 10 μm in the top panel and 5 μm in the bottom panel, respectively. (B) Quantification of surface GluA1 levels as the mean ± SEM is shown (P < 0.05). (C) Representative gap‐free recorded traces (left) and averaged mEPSC waveform (right) are shown for GFP (control), wild‐type TRIAD3A (WT), TRIAD3A‐R660C (R660C), or TRIAD3A‐R694C (R694C). In the averaged mEPSC waveform panel, gray traces indicate the overlaid raw traces and the red line indicates the average. (D,F) Cumulative plots and histograms (E,G) of mEPSC amplitude and frequency for GFP (n = 32), TRIAD3A (n = 36), R660C (n = 30), and R694C (n = 30). All histogram data are shown as the mean ± SEM. Statistical significance was assessed by one‐way ANOVA (*P < 0.05; ***P < 0.001).
Figure 3
Figure 3
The increase in basal synaptic transmission by TRIAD3A overexpression is reversed by expression of Arc mutant that cannot be ubiquitinated. (A) Representative gap‐free recorded trace (left) and averaged mEPSC waveform (right) are shown for GFP, TRIAD3A‐WT (TRIAD3A) cotransfected with Arc WT (Arc) or Arc‐K268R/K269R (Arc‐KR). In the averaged mEPSC waveform panel, gray traces indicate the overlaid raw traces and the red line indicates the average. (B,D) Cumulative plot and (C,E) histograms of mEPSC amplitude and frequency for GFP (n = 14), TRIAD3A (n = 12), TRIAD3A + Arc (n = 16), and TRIAD3A + Arc‐KR (n = 15). All histogram data are shown as the mean ± SEM. Statistical significance was assessed by one‐way ANOVA (*P < 0.05).
Figure 4
Figure 4
The decrease in synaptic strength by TRIAD3A knockdown cannot be rescued by TRIAD3A mutants. (A) Representative gap‐free recorded trace (left) and averaged mEPSC waveform (right) are shown for scrambled shRNA (Scr), TRIAD3A‐shRNA (TRIAD3A‐sh), or TRIAD3A‐shRNA cotransfected with shRNA‐resistant TRIAD3A (TRIAD3A‐sh + TRIAD3A‐R). In the averaged mEPSC waveform panel, gray traces indicate the overlaid raw traces and the red line indicates the average. (B,D) Cumulative plot and (C,E) histograms of mEPSC amplitude and frequency for Scr (n = 14), sh (n = 14), and sh + TRIAD3A‐R (n = 12; **P < 0.01). (F) Representative gap‐free recorded trace (left) and averaged mEPSC waveform (right) are shown for cortical neurons transfected with scrambled shRNA (Scr), TRIAD3A‐shRNA (TRIAD3A‐sh), or TRIAD3A‐shRNA cotransfected with shRNA‐resistant TRIAD3A variants (TRIAD3A‐sh + R660C‐R and TRIAD3A‐sh + R694C‐R). In the averaged mEPSC waveform panel, gray traces indicate the overlaid raw traces and the red line indicates the average. (G–J) mEPSC for knockdown rescue of the TRIAD3A variants (n = 25, 28, 21, 23 for Scr, sh, sh + R660C, and sh + R694C, respectively). All histogram data are shown as the mean ± SEM. Statistical significance was assessed by one‐way ANOVA (****P < 0.0001; **P < 0.01).
Figure 5
Figure 5
Loss of TRIAD3A in the CA1 region of the mouse hippocampus impairs spatial memory. (A) Coronal mouse brain section with the shRNA virus‐infected CA1 region as indicated by the GFP signal. Scale bar, 100 μm. (B) Schematic representation of the water‐cross maze experiment. The four arms are labeled north (N), south (S), east (E), and west (W). The location of the platform is shown. (C) The percentages of correct arm entries calculated from the six trials each day are shown. The KD group is deficient in locating the platform as accurately as the control group (two‐way ANOVA followed by Sidak's post hoc test, *P < 0.05). The time taken by the KD and control groups to reach the platform (latency) (D) and the number of wrong platform visits (E) over the 4 days of training are shown. Statistical significance was assessed by two‐way ANOVA and Student's t‐test (n = 11 for the KD group and n = 11 for the control group). (F) Scheme of the Morris water maze with the reference points used in the protocol and the names of the quadrants that are used for the analysis. The platform was located in the S‐E quadrant of the pool. (G) Latency to reach the platform within the 5 days of training is shown. The control group learned the location of the platform, but the KD group did not (two‐way ANOVA followed by Bonferroni post hoc comparison, *P < 0.05; control: n = 8; KD: n = 6). The dotted line indicates the threshold for the animal to acquire learning (20 s to reach the platform). Number of entries (H) and time spent (I) in the different quadrants of the pool during the probe test on the 6th day, 24 h after the last learning trial. Data are presented as the means ± SEM. *P < 0.05, **P < 0.01, and ***P < 0.001; ANOVA Bonferroni post hoc comparison in (H,I). (J) Group occupancy plot for control and KD mice is shown. The platform was located in the lower right quadrant prior to the probe trial and is depicted by a dotted white circle. The value for the maximum occupancy is the maximum found in any of the plots.
Figure 6
Figure 6
Intact TRIAD3A is required for Arc degradation, ubiquitination, and binding. (A) Ubiquitination assay was performed by transfecting HEK293T cells with Myc‐tagged Arc, HA‐tagged ubiquitin, and FLAG‐tagged TRIAD3A/TRIAD3A variants. The α‐HA (ubiquitin) immunoblot after IP with anti‐Myc beads is shown in the top panel. Only WT TRIAD3A can ubiquitinate Arc; the TRIAD3A variants cannot. The INPUT (2% of entire lysate) samples, which were immunoblotted (IB) with the antibodies indicated, are shown in the bottom two panels. (B) Co‐IP was performed using HEK293T cell lysates cotransfected with Myc‐tagged Arc and FLAG‐tagged TRIAD3A/TRIAD3A variants. IP was performed using α‐FLAG beads and then IB with α‐Myc to probe for Arc pull‐down. The INPUT (2% of entire lysate) samples show the expression of Arc and TRIAD3A in the lysate before IP. The dotted line indicates that the samples were from the same gel, but the lanes were noncontiguous. (C) Top panel: HEK293T cells were cotransfected with 0.25 μg of Arc and 1 μg of WT TRIAD3A and TRIAD3A alanine variants as indicated. Bottom panel: Quantification of Arc levels upon TRIAD3A WT or variants overexpression in HEK293T cells. The data represent the mean ± SEM. Statistical significance was assessed by one‐way ANOVA and Student's t‐test (**P < 0.01), n = 3. (D) Co‐IP was performed using HEK293T cell lysates cotransfected with Myc‐tagged RIPK1 and FLAG‐tagged TRIAD3A/TRIAD3A variants. IP was performed using α‐FLAG beads and then IB with α‐Myc to probe for RIPK1 pull‐down. RIPK1 binds to WT TRIAD3A and TRIAD3A variants. The INPUT (2% of entire lysate) samples show the expression of RIPK1 and TRIAD3A in the lysate before IP. (E) Schematic of the TRIAD3A protein indicating the truncations that were generated. (F) Co‐IP was performed using HEK293T cell lysates cotransfected with Myc‐tagged Arc and FLAG‐tagged TRIAD3A/TRIAD3A truncated constructs. IP was performed using α‐FLAG beads and then IB with α‐Myc to probe for Arc pull‐down. The INPUT (2% of entire lysate) samples show the expression of Arc and TRIAD3A in the lysate before IP. (*) indicates lower protein levels.

References

    1. Abs R, Van Vleymen E, Parizel PM, Van Acker K, Martin M, Martin JJ (1990) Congenital cerebellar hypoplasia and hypogonadotropic hypogonadism. J. Neurol. Sci. 98, 259–265. - PubMed
    1. Alqwaifly M, Bohlega S (2016) Ataxia and hypogonadotropic hypogonadism with intrafamilial variability caused by RNF216 mutation. Neurol. Int. 8, 6444. - PMC - PubMed
    1. Berciano J, Amado JA, Freijanes J, Rebollo M, Vaquero A (1982) Familial cerebellar ataxia and hypogonadotropic hypogonadism: evidence for hypothalamic LHRH deficiency. J. Neurol. Neurosurg. Psychiatry 45, 747–751. - PMC - PubMed
    1. Chen D, Li X, Zhai Z, Shu HB (2002) A novel zinc finger protein interacts with receptor‐interacting protein (RIP) and inhibits tumor necrosis factor (TNF)‐ and IL1‐induced NF‐kappa B activation. J. Biol. Chem. 277, 15985–15991. - PubMed
    1. Chowdhury S, Shepherd JD, Okuno H, Lyford G, Petralia RS, Plath N, Kuhl D, Huganir RL, Worley PF (2006) Arc/Arg3.1 interacts with the endocytic machinery to regulate AMPA receptor trafficking. Neuron 52, 445–459. - PMC - PubMed

Publication types

MeSH terms

Supplementary concepts

LinkOut - more resources