. 2016 Dec 20:6:39326.
doi: 10.1038/srep39326.

High resolution 3D imaging of living cells with sub-optical wavelength phonons

Affiliations

High resolution 3D imaging of living cells with sub-optical wavelength phonons

Fernando Pérez-Cota et al. Sci Rep. .

Abstract

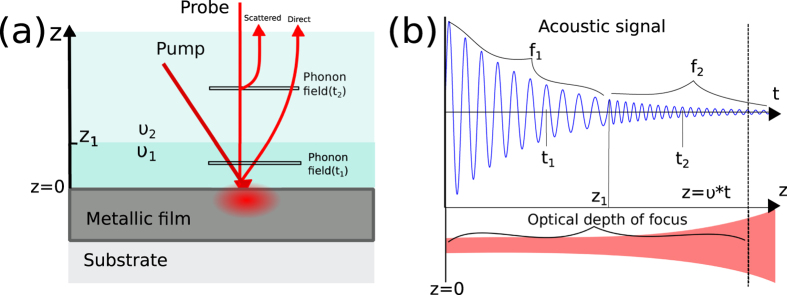
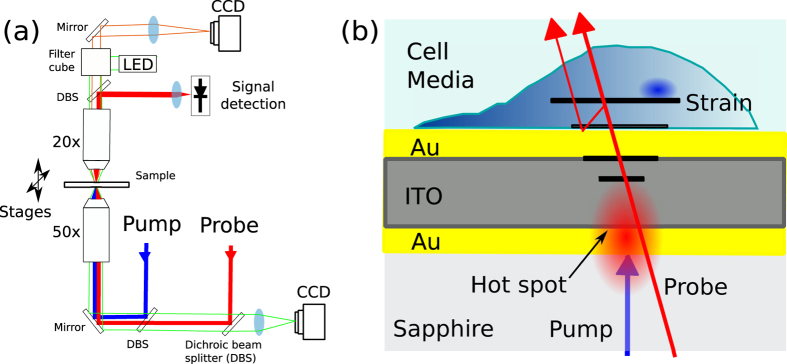
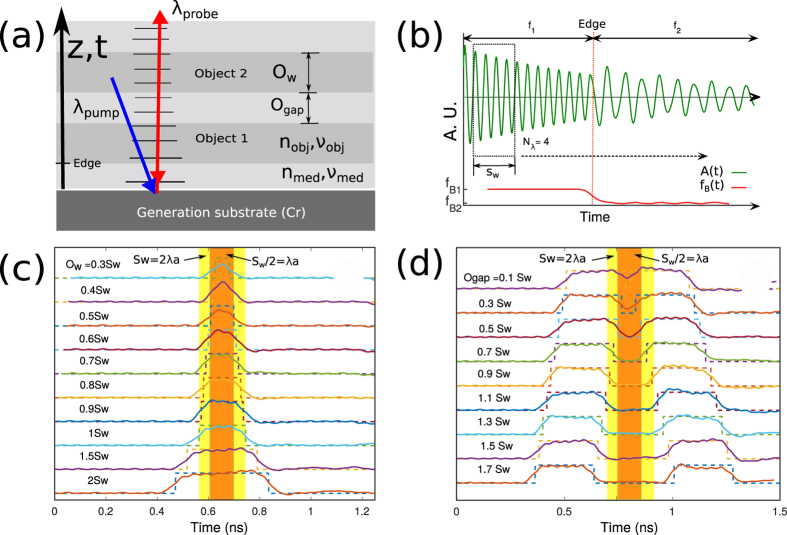
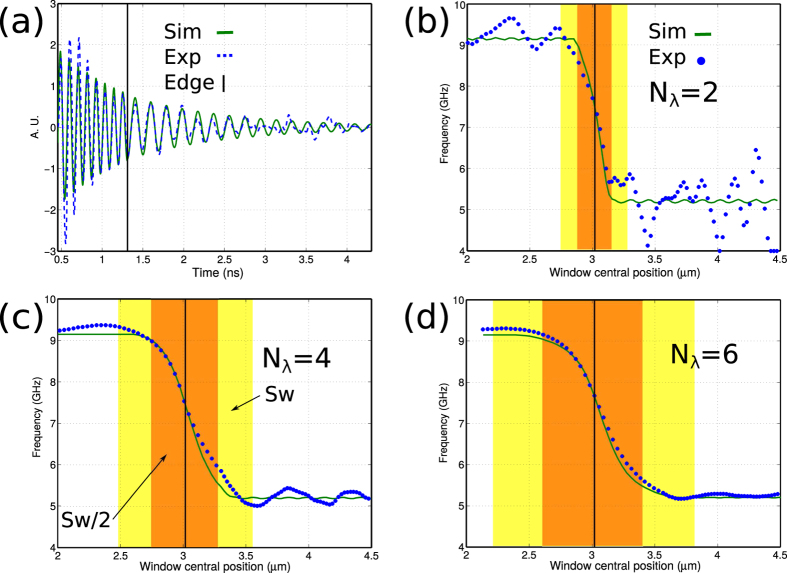
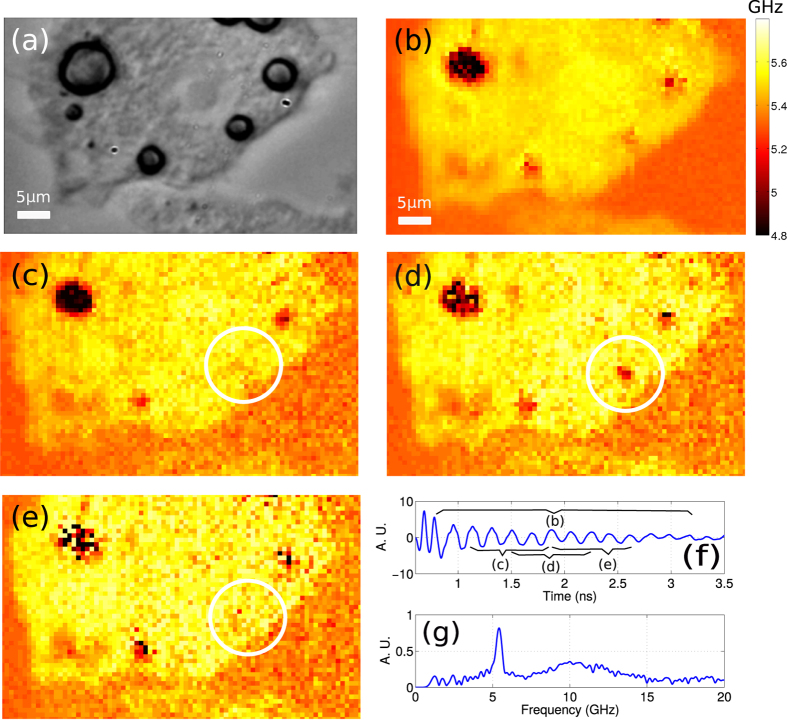
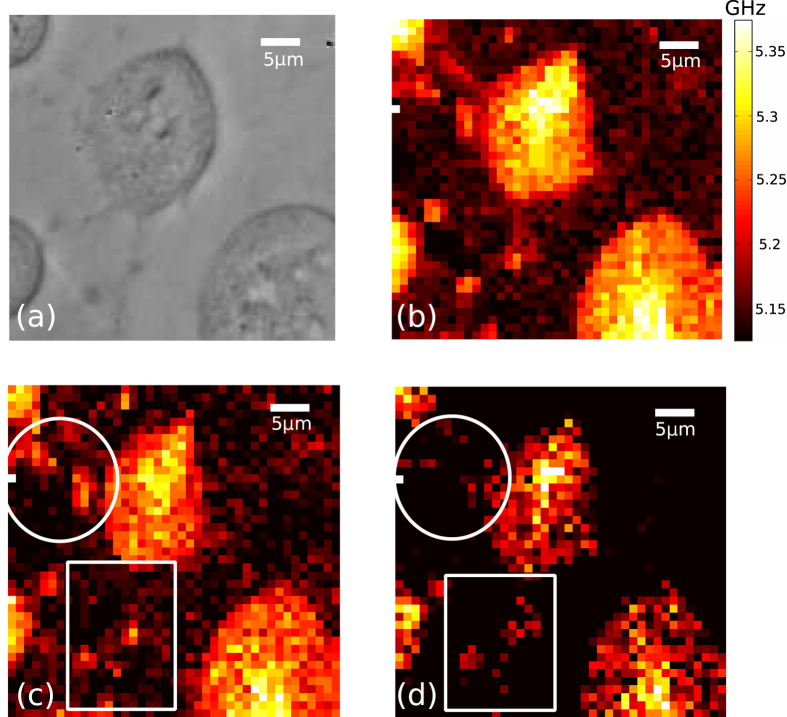
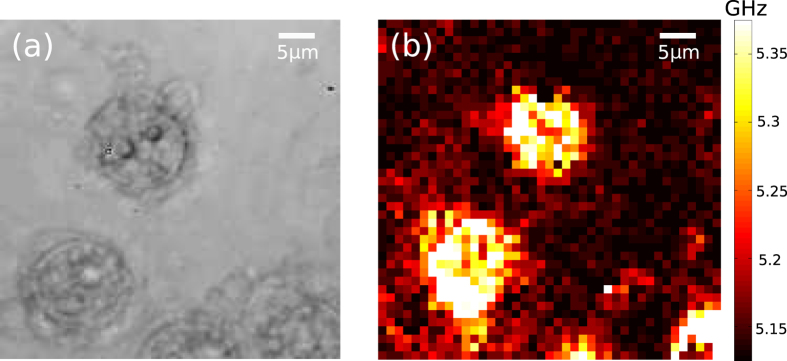
Label-free imaging of living cells below the optical diffraction limit poses great challenges for optical microscopy. Biologically relevant structural information remains below the Rayleigh limit and beyond the reach of conventional microscopes. Super-resolution techniques are typically based on the non-linear and stochastic response of fluorescent labels which can be toxic and interfere with cell function. In this paper we present, for the first time, imaging of live cells using sub-optical wavelength phonons. The axial imaging resolution of our system is determined by the acoustic wavelength (λa = λprobe/2n) and not on the NA of the optics allowing sub-optical wavelength acoustic sectioning of samples using the time of flight. The transverse resolution is currently limited to the optical spot size. The contrast mechanism is significantly determined by the mechanical properties of the cells and requires no additional contrast agent, stain or label to image the cell structure. The ability to breach the optical diffraction limit to image living cells acoustically promises to bring a new suite of imaging technologies to bear in answering exigent questions in cell biology and biomedicine.


Figures

Figure 1
Figure 1. Phononic measurement of transparent materials.
In (a), a light pulse (pump) is used to thermoelastically generate a coherent phonon field in the metallic film. The phonon field (shown at two positions in time, t1 and t2, by thin horizontal bars) is probed by a second light beam (probe). The interference of both direct and scattered probe beams induces an oscillation in the detected probe light intensity. The frequency of this oscillation fB is a function of the speed of sound. As the phonon field travels from one material with speed of sound ν1 to another material with speed of sound ν2, the detected frequency changes accordingly as shown in (b). As the phonon wavelength is shorter than the optical, it is possible to section the optical volume by post-processing without the need of further acquisition, mechanical positioning or change of focus.
Figure 2
Figure 2. Experimental schematic.
(a) Experimental setup. Two pulsed lasers in ASOPS pump-probe configuration are combined by an objective lens (0.55 NA) and focused into the transducer substrate interface where the probe beam is captured by a second objective (0.42 NA) and detected in a photodiode. The system is built around a microscope to enable complementary optical imaging. A fluorescence detection arrangement allows the state of a cell to be assessed. (b) Transducer and sample arrangement. The pump beam is absorbed while the probe beam is transmitted by the transducer (with dimensions Au = 20 nm, ITO = 140 nm and Au = 20 nm) to allow detection while protecting the cell from optical exposure. The substrate is sapphire to prevent temperature rise.
Figure 3
Figure 3. Simulated measurements and axial response upon stimulation.
(a) Schematic of the simulated geometry. (b) Simulation of an edge response to represent sectioning. (c) Simulated response from a single object with various sizes for Nλ = 2. (d) Simulated response by two near objects at various edge to edge distances using Nλ = 2. Resolution in both cases is half of the measuring window Sw/2.
Figure 4
Figure 4. Experimental measurement of edge response between polystyrene and water.
(a) Experimental and simulated (fitted) traces with a sharp edge made out of polystyrene-water transition. (b) Edge response with Nλ = 2. (c) Edge response with Nλ = 4. (d) Edge response with Nλ = 6. In all Nλ cases the resolution is half of the section width.
Figure 5
Figure 5. Imaging of an adipose cell using ~5 GHz phonons.
(a) Optical picture taken with a conventional brightfield microscope showing an adipose cell. Fat droplets are clearly visible. (b) The Brillouin frequency map of the area shown in (a). This map was obtained using the complete temporal extent of the detected signals. (ce) Subsections of the measured volume. The central position of the windows in the z direction are 0.6,1 and 1.4 μm to figures (ce) respectively. The fat droplet marked with a circle appears and disappears within the measured volume. (f) Typical time trace observed from the cell cytoplasm shown as a star in (a). (g) Fourier transform of the time trace presented in (f) showing the Brillouin frequency peak.
Figure 6
Figure 6. Imaging of live 3T3 cells with phonons.
(a) Optical image of the scanned area. (b) Brillouin shift measured from (a) sampling every 1 μm, taking ~1.5 s per point and a total of 38 minutes total acquisition time. (c) Section obtained at d = 1 μm. (d) Section obtained at d = ~1.8 μm. As sound propagates, thin filopodia (marked by white circle, square) are resolved axially as the section moves deeper into the cell.
Figure 7
Figure 7. Imaging of delipidated cells using phonons.
(a) Brightfield image of 3T3 fibroblast cells. (b) Map of the Brillouin shift obtained from the cell presented in (a). The appearance of the cells is considerable different than the living cells shown in Fig. 6, their range of acoustic frequencies is also significantly larger.

References

    1. Zernike F. Phase contrast, a new method for the microscopic observation of transparent objects part II. Physica 9, 974–986 (1942).
    1. Lichtman J. W. & Conchello J.-A. Fluorescence microscopy. Nature methods 2, 910–9 (2005). - PubMed
    1. Rothmund G. et al.. Confocal laser scanning microscopy as a new valuable tool in the diagnosis of onychomycosis - comparison of six diagnostic methods. Mycoses 56, 47–55 (2013). - PubMed
    1. Kherlopian A. R. et al.. A review of imaging techniques for systems biology. BMC systems biology 2, 74 (2008). - PMC - PubMed
    1. Nägerl U. V., Willig K. I., Hein B., Hell S. W. & Bonhoeffer T. Live-cell imaging of dendritic spines by STED microscopy. Proceedings of the National Academy of Sciences of the United States of America 105, 18982–7 (2008). - PMC - PubMed

Publication types

LinkOut - more resources