

Regional synchrony in full-scale activated sludge bioreactors due to deterministic microbial community assembly
- PMID: 27996980
- PMCID: PMC5270562
- DOI: 10.1038/ismej.2016.121
Regional synchrony in full-scale activated sludge bioreactors due to deterministic microbial community assembly
Abstract
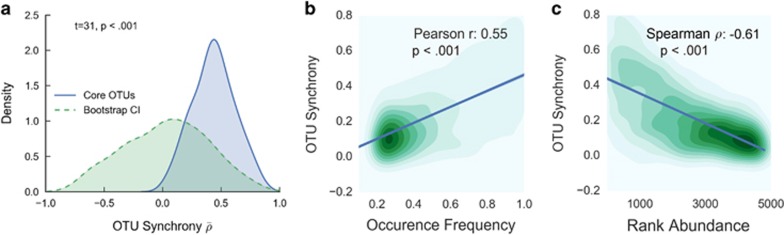
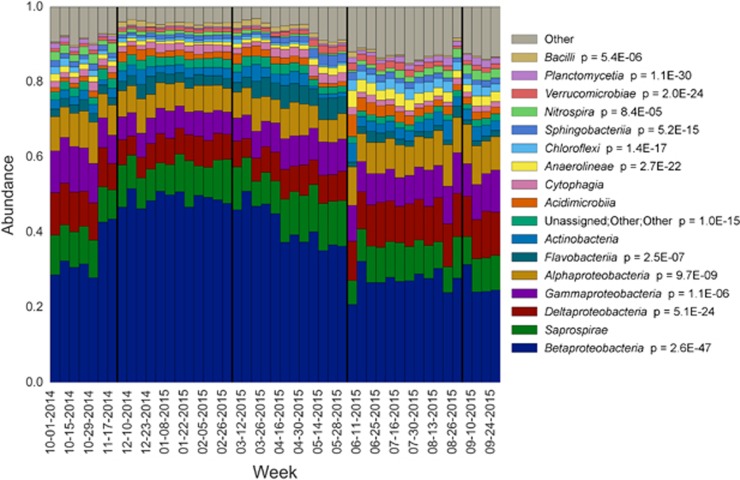
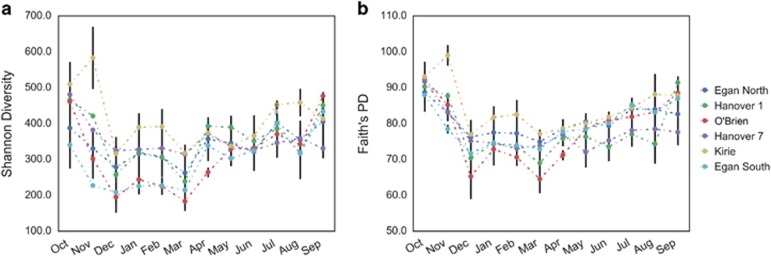
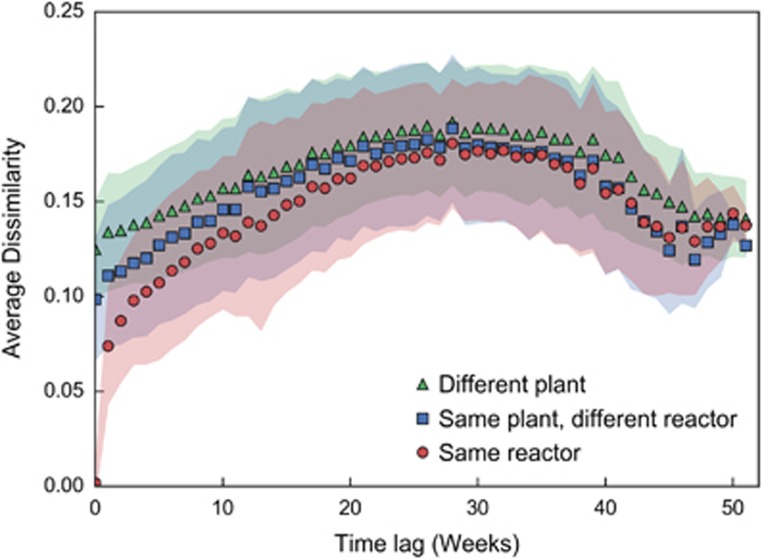
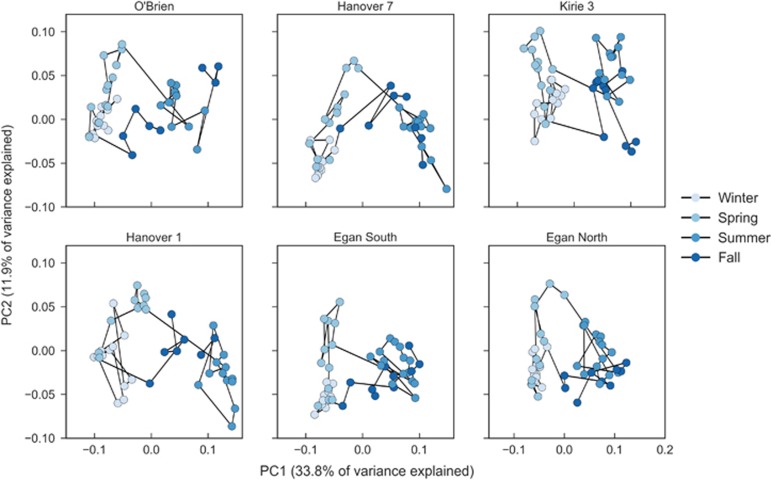
Seasonal community structure and regionally synchronous population dynamics have been observed in natural microbial ecosystems, but have not been well documented in wastewater treatment bioreactors. Few studies of community dynamics in full-scale activated sludge systems facing similar meteorological conditions have been done to compare the importance of deterministic and neutral community assembly mechanisms. We subjected weekly activated sludge samples from six regional full-scale bioreactors at four wastewater treatment plants obtained over 1 year to Illumina sequencing of 16S ribosomal RNA genes, resulting in a library of over 17 million sequences. All samples derived from reactors treating primarily municipal wastewater. Despite variation in operational characteristics and location, communities displayed temporal synchrony at the individual operational taxonomic unit (OTU), broad phylogenetic affiliation and community-wide scale. Bioreactor communities were dominated by 134 abundant and highly regionally synchronized OTU populations that accounted for over 50% of the total reads. Non-core OTUs displayed abundance-dependent population synchrony. Alpha diversity varied by reactor, but showed a highly reproducible and synchronous seasonal fluctuation. Community similarity was dominated by seasonal changes, but individual reactors maintained minor stable differences after 1 year. Finally, the impacts of mass migration driven by direct biomass transfers between reactors was investigated, but had no significant effect on community similarity or diversity in the sink community. Our results show that population dynamics in activated sludge bioreactors are consistent with niche-driven assembly guided by seasonal temperature fluctuations.
Figures
Similar articles
-
Influence of influent wastewater communities on temporal variation of activated sludge communities.Water Res. 2015 Apr 15;73:132-44. doi: 10.1016/j.watres.2015.01.014. Epub 2015 Jan 22. Water Res. 2015. PMID: 25655320
-
Dissecting microbial community structure and methane-producing pathways of a full-scale anaerobic reactor digesting activated sludge from wastewater treatment by metagenomic sequencing.Microb Cell Fact. 2015 Mar 14;14:33. doi: 10.1186/s12934-015-0218-4. Microb Cell Fact. 2015. PMID: 25880314 Free PMC article.
-
Seasonal Dynamics of the Activated Sludge Microbiome in Sequencing Batch Reactors, Assessed Using 16S rRNA Transcript Amplicon Sequencing.Appl Environ Microbiol. 2020 Sep 17;86(19):e00597-20. doi: 10.1128/AEM.00597-20. Print 2020 Sep 17. Appl Environ Microbiol. 2020. PMID: 32709723 Free PMC article.
-
Upflow anaerobic sludge blanket reactor--a review.Indian J Environ Health. 2001 Apr;43(2):1-82. Indian J Environ Health. 2001. PMID: 12397675 Review.
-
Exploring the feasibility of sewage treatment by algal-bacterial consortia.Crit Rev Biotechnol. 2020 Mar;40(2):169-179. doi: 10.1080/07388551.2019.1709796. Epub 2020 Jan 6. Crit Rev Biotechnol. 2020. PMID: 31906713 Review.
Cited by
-
Thickness determines microbial community structure and function in nitrifying biofilms via deterministic assembly.Sci Rep. 2019 Mar 25;9(1):5110. doi: 10.1038/s41598-019-41542-1. Sci Rep. 2019. PMID: 30911066 Free PMC article.
-
Composition and Dynamics of the Activated Sludge Microbiome during Seasonal Nitrification Failure.Sci Rep. 2019 Mar 14;9(1):4565. doi: 10.1038/s41598-019-40872-4. Sci Rep. 2019. PMID: 30872659 Free PMC article.
-
Microbial Dynamics of Biosand Filters and Contributions of the Microbial Food Web to Effective Treatment of Wastewater-Impacted Water Sources.Appl Environ Microbiol. 2019 Aug 14;85(17):e01142-19. doi: 10.1128/AEM.01142-19. Print 2019 Sep 1. Appl Environ Microbiol. 2019. PMID: 31227556 Free PMC article.
-
Seasonal prevalence of bacteria in the outflow of two full-scale municipal wastewater treatment plants.Sci Rep. 2023 Jun 30;13(1):10608. doi: 10.1038/s41598-023-37744-3. Sci Rep. 2023. PMID: 37391517 Free PMC article.
-
Genome-Resolved Metatranscriptomics Provide Insights on Immigration Influence in Structuring Microbial Community Assembly of a Full-Scale Aerobic Granular Sludge Plant.Environ Sci Technol. 2025 Apr 1;59(12):6126-6141. doi: 10.1021/acs.est.4c14471. Epub 2025 Mar 19. Environ Sci Technol. 2025. PMID: 40106496 Free PMC article.
References
-
- Aitchison J. (1982). The statistical analysis of compositional data. J R Stat Soc B 44: 139–177.
-
- Andersson AF, Riemann L, Bertilsson S. (2009). Pyrosequencing reveals contrasting seasonal dynamics of taxa within Baltic Sea bacterioplankton communities. ISME J 4: 171–181. - PubMed
-
- Bjørnstad ON, Ims RA, Lambin X. (1999). Spatial population dynamics: analyzing patterns and processes of population synchrony. Trends Ecol Evol 14: 427–432. - PubMed
MeSH terms
Substances
LinkOut - more resources
Full Text Sources
Other Literature Sources
