. 2017 May 1;525(7):1668-1684.
doi: 10.1002/cne.24158. Epub 2017 Feb 22.

Descending projections from the basal forebrain to the orexin neurons in mice

Affiliations

Descending projections from the basal forebrain to the orexin neurons in mice

Lindsay J Agostinelli et al. J Comp Neurol. .

Abstract

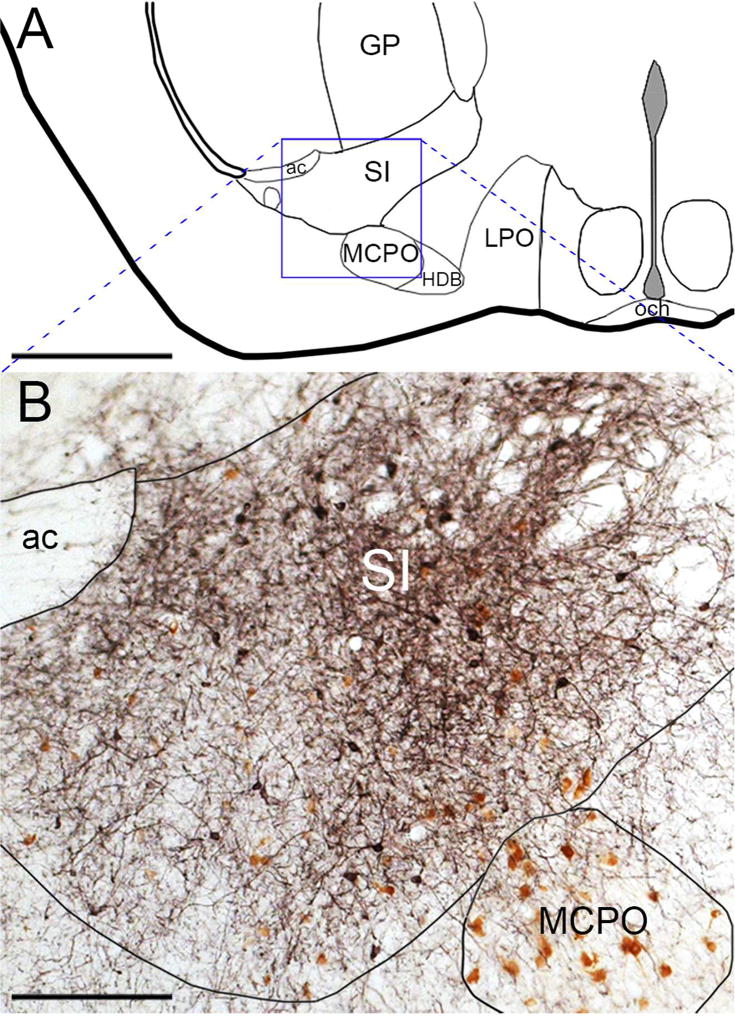
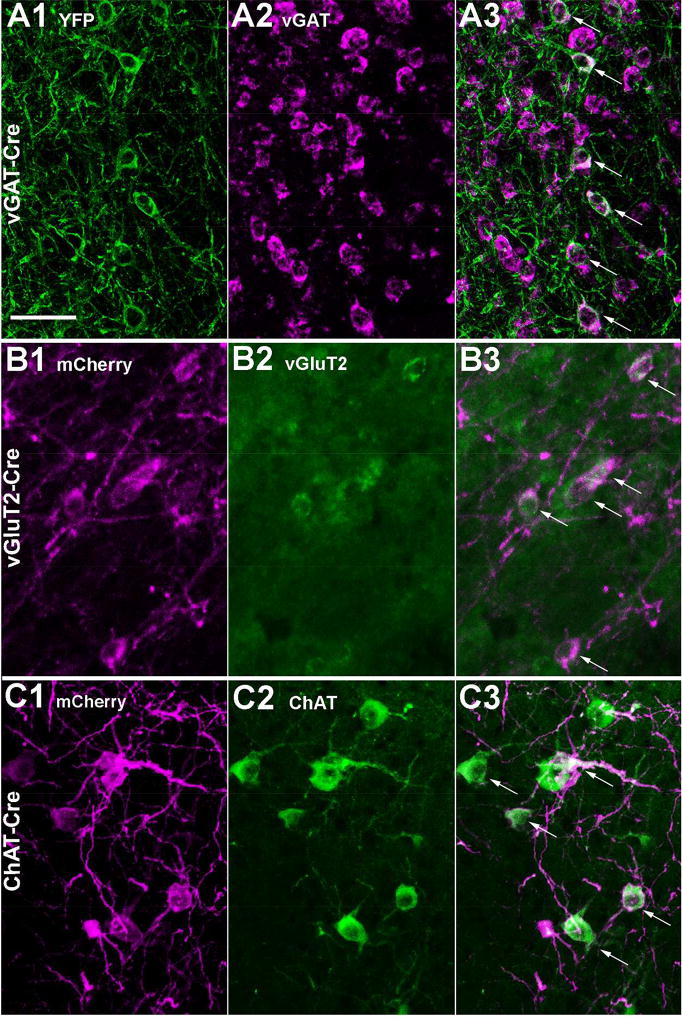
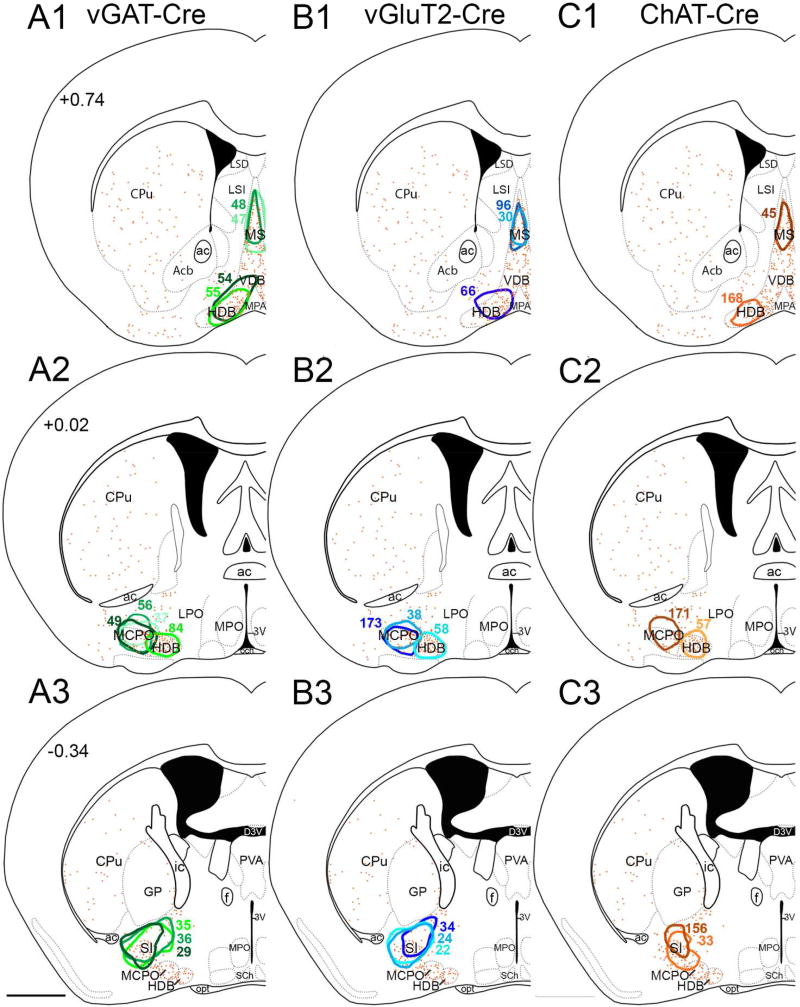
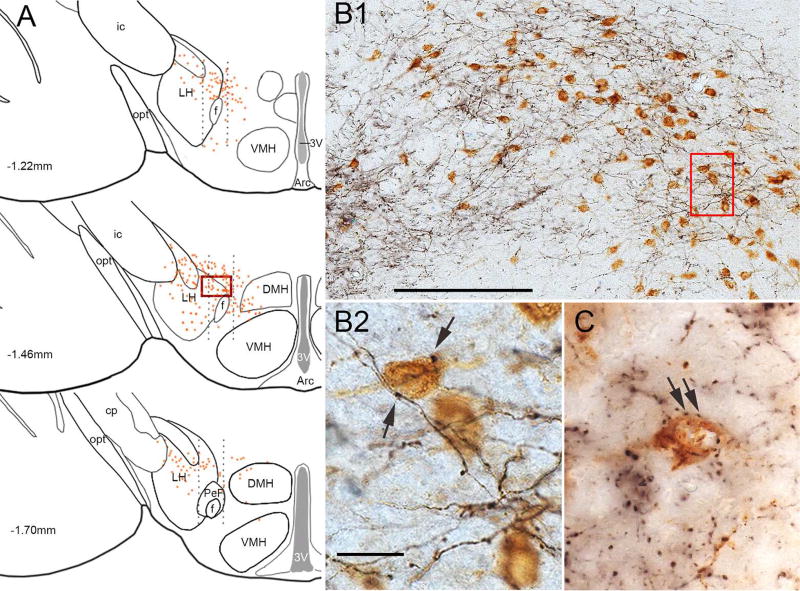
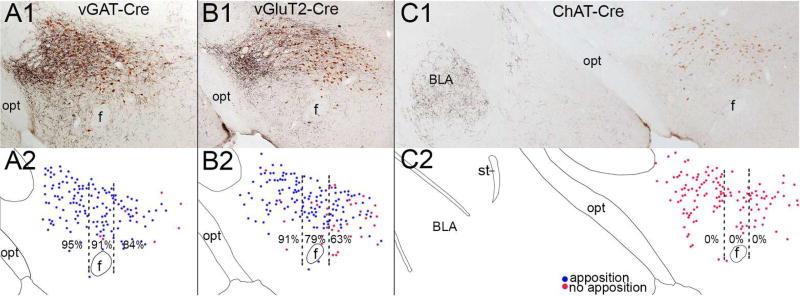
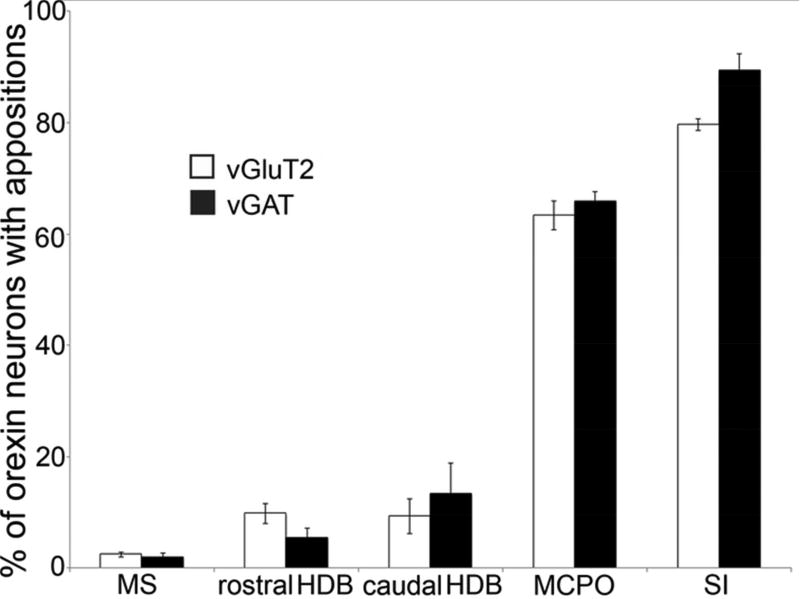
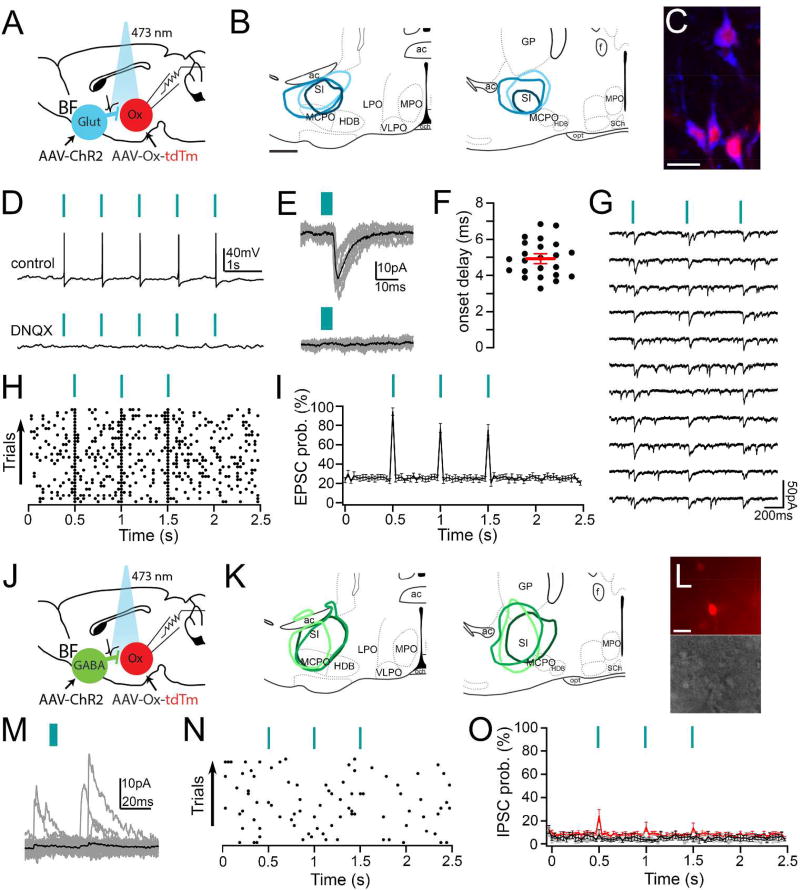
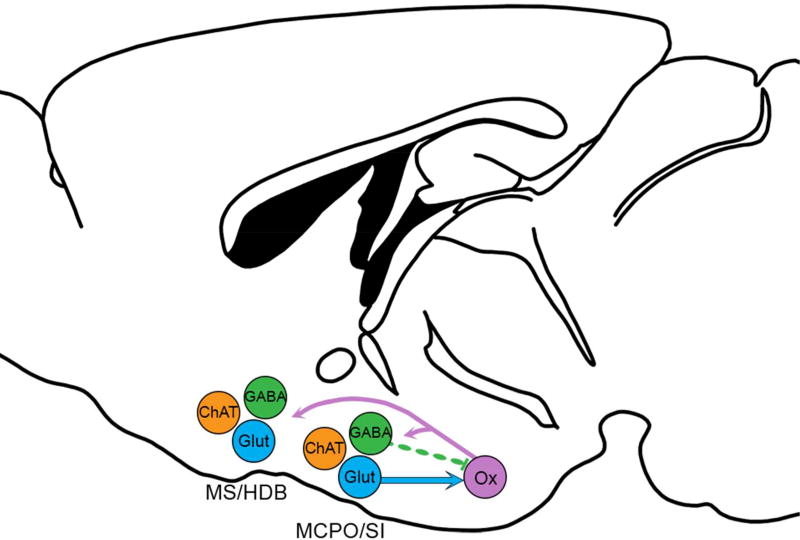
The orexin (hypocretin) neurons play an essential role in promoting arousal, and loss of the orexin neurons results in narcolepsy, a condition characterized by chronic sleepiness and cataplexy. The orexin neurons excite wake-promoting neurons in the basal forebrain (BF), and a reciprocal projection from the BF back to the orexin neurons may help promote arousal and motivation. The BF contains at least three different cell types (cholinergic, glutamatergic, and γ-aminobutyric acid (GABA)ergic neurons) across its different regions (medial septum, diagonal band, magnocellular preoptic area, and substantia innominata). Given the neurochemical and anatomical heterogeneity of the BF, we mapped the pattern of BF projections to the orexin neurons across multiple BF regions and neuronal types. We performed conditional anterograde tracing using mice that express Cre recombinase only in neurons producing acetylcholine, glutamate, or GABA. We found that the orexin neurons are heavily apposed by axon terminals of glutamatergic and GABAergic neurons of the substantia innominata (SI) and magnocellular preoptic area, but there was no innervation by the cholinergic neurons. Channelrhodopsin-assisted circuit mapping (CRACM) demonstrated that glutamatergic SI neurons frequently form functional synapses with the orexin neurons, but, surprisingly, functional synapses from SI GABAergic neurons were rare. Considering their strong reciprocal connections, BF and orexin neurons likely work in concert to promote arousal, motivation, and other behaviors. J. Comp. Neurol. 525:1668-1684, 2017. © 2016 Wiley Periodicals, Inc.

Keywords: CRACM; RRID: AB_10013483; RRID: AB_11180610; RRID: AB_262156; RRID: AB_653610; anterograde; hypocretin; lateral hypothalamus; magnocellular preoptic; mice; substantia innominata.


Conflict of interest statement

Conflicts of Interest: None of the authors have any conflicts.

Figures

Figure 1
Figure 1. A typical AAV-ChR2 injection site in the SI
(A) Diagram of the SI/MCPO region. (B) DsRed antisera (black) robustly labels ChR2-mCherry fusion protein in neuronal soma and axons of a vGAT-Cre mouse. DAB (brown) labels ChAT neurons in the SI and MCPO. Scale bars are 1 mm in A and 200 µm in B.
Figure 2
Figure 2. Selective expression of marker proteins in SI neuronal populations
(A1) In a vGAT-cre mouse, injection of AAV-ChR2-YFP results in robust GFP immunoreactivity in neurons of the SI. (A2–A3) In situ hybridization for vGAT mRNA and merged image; arrows mark double labeled soma. (B1) In a vGluT2-Cre mouse, injection of AAV-ChR2-mCherry produces strong mCherry labeling. (B2–B3) vGluT2 mRNA and merged image. (C) In a ChAT-Cre mouse, injection of AAV-ChR2-mCherry produces strong mCherry labeling. (C1–C2) Immunolabeling for ChAT and merged image. Scale bar is 50 µm.
Figure 3
Figure 3. Distribution of injection sites
(A1–A3) BF injection sites from vGAT-Cre mice, (B1–B3) vGluT2-Cre mice, and (C1–C3) ChAT-Cre mice. Colored outlines show the center of each injection site. Orange dots show the distribution of cholinergic neurons, and atlas levels are per Franklin and Paxinos, 2007. Scale bar is 1 mm.
Figure 4
Figure 4. SI innervation of the orexin neurons
(A) We analyzed three sections (spaced 240 µm apart) through the rostral-caudal extent of the orexin field. Dotted black lines indicate the lateral, perifornical, and medial divisions of the orexin field; orange dots represent individual orexin neurons. (B1) Higher power image of the boxed area in A shows that mCherry-labeled glutamatergic axons (black) are dense within the orexin field, and (B2) Higher power image of the boxed area in B1 shows that mCherry-labeled boutons (arrows) closely appose orexin neurons (brown). (C) After injection of AAV-synaptophysin-mCherry, mCherry-labeled, GABAergic presynaptic terminals (black) closely appose orexin neurons (brown). Scale bars in B1 and B2 are 200 µm and 25 µm, respectively.
Figure 5
Figure 5. Variations in SI appositions across the orexin field
(A–B) In vGAT-cre and vGluT2-cre mice, mCherry-labeled SI fibers (black) heavily innervate the orexin neurons (brown). (C) In Chat-cre mice, cholinergic fibers from the SI do not innervate the orexin neurons, but they heavily innervate the basolateral amygdala (BLA). (A2–C2) Drawings of the above photos showing the pattern of orexin neurons apposed (blue dots) or not apposed (red dots) by SI terminals from individual mice. Percentages are the mean number of orexin neurons with appositions in the lateral, perifornical, and medial parts of the orexin field across three mice of each cre line.
Figure 6
Figure 6. Percentage of orexin neurons with appositions from different BF regions and cell types
SI and MCPO heavily innervate the orexin neurons while MS and HDB innervation is minimal.
Figure 7
Figure 7. Channelrodopsin-2-assisted circuit mapping (CRACM) to test functional connectivity of SI projections to the orexin neurons
(A) We injected AAV-ChR2-YFP (AAV-ChR2) into the SI of vGluT2-Cre mice, and we injected AAV-horexin-tdTomato (AAV-Ox-tdTm) in the ipsilateral orexin field to label orexin neurons. We recorded from orexin neurons that expressed tdTomato and used blue light pulses to stimulate glutamate release from SI glutamatergic terminals. (B) Three representative AAV-ChR2-YFP injection sites used for CRACM (scale bar = 500 µm). (C) After injection of AAV-horexin-tdTomato, lateral hypothalamic neurons are labeled for orexin-A (pseudocolored blue) and tdTomato (red), scale bar = 20 µm. (D) Photostimulation of glutamatergic inputs from the SI reliably evokes action potentials in orexin neurons that are blocked by DNQX 20 µM (current clamp recordings; blue lines signify 5 ms light pulses). (E) Photostimulation also evokes glutamatergic EPSCs in orexin neurons that are blocked by DNQX (bottom trace) (voltage-clamp recordings Vh = −60 mV; grey traces are single trials; black are the average responses). (F) Photostimulation evokes very short latency EPSCs (black dots are mean latencies in individual orexin neurons; red line is the population mean ± SEM; n = 23). (G) Photo-evoked EPSCs recorded in TTX (1 µM + 4-AP 1 mM), indicating monosynaptic connectivity. (H) Raster plot of glutamatergic EPSCs in orexin neurons after three light pulses (30 ms bins). (I) Average EPSC probability was high in 23 out of 25 recorded orexin neurons with three light pulses. (J) We injected AAV-ChR2-YFP into the SI of vGAT-Cre mice, and used 5 ms blue light pulses to stimulate GABA release from SI GABAergic terminals. (K) Schematic of three representative AAV-CHR2-YFP injections used for CRACM in vGAT-cre mice. (L) An example of a recorded slice containing orexin neurons expressing tdTomato (top) and visualized under IR-DIC system during whole-cell recordings (scale bar: 25 µm). (M) Orexin neurons receive spontaneous GABAergic IPSCs, but these events are not synchronized to the photostimulation of the GABAergic terminals (voltage clamp traces in a representative orexin neuron recorded with the K-gluconate based pipette solution, Vh = 0 mV). (N) Raster plot of GABAergic IPSCs in an orexin neuron after three light pulses. (O) Three light pulses did not increase the average IPSC probability in all 5 orexin neurons recorded with the K-gluconate based pipette solution (grey trace) or in all 8 orexin neurons recorded in Cs-methane-sulfonate-based pipette solution (black trace). Light pulses induced IPSCs in only 4 out of 26 orexin neurons recorded with the KCl-based pipette solution (red trace).
Figure 8
Figure 8. Schematic of BF projections
Reciprocal projections between the BF and orexin neurons. Previous studies show that the orexin neurons innervate cholinergic and non-cholinergic neurons of the entire BF. Glutamatergic (Glut) neurons of the MCPO and SI heavily innervate and excite the orexin neurons. GABAergic (GABA) neurons of these regions project heavily to the orexin neurons but rarely form functional synapses on orexin neurons. Non-cholinergic projections from the MS and HDB are light. Cholinergic (ChAT) BF neurons do not project to the orexin neurons.

References

    1. Adamantidis A, Carter MC, de Lecea L. Optogenetic deconstruction of sleep-wake circuitry in the brain. Front Mol Neurosci. 2010;2:31. - PMC - PubMed
    1. Alheid GF. Extended amygdala and basal forebrain. Ann N Y Acad Sci. 2003;985:185–205. - PubMed
    1. Arrigoni E, Mochizuki T, Scammell TE. Activation of the basal forebrain by the orexin/hypocretin neurones. Acta Physiol (Oxf) 2010;198(3):223–235. - PMC - PubMed
    1. Bayer L, Eggermann E, Serafin M, Grivel J, Machard D, Muhlethaler M, Jones BE. Opposite effects of noradrenaline and acetylcholine upon hypocretin/orexin versus melanin concentrating hormone neurons in rat hypothalamic slices. Neuroscience. 2005;130(4):807–811. - PubMed
    1. Blanco-Centurion CA, Shiromani A, Winston E, Shiromani PJ. Effects of hypocretin-1 in 192-IgG-saporin-lesioned rats. Eur J Neurosci. 2006;24(7):2084–2088. - PubMed