. 2017 Jan;42(1):77-83.
doi: 10.1139/apnm-2016-0346. Epub 2016 Nov 18.

Inhibition of the gut enzyme intestinal alkaline phosphatase may explain how aspartame promotes glucose intolerance and obesity in mice

Affiliations

Inhibition of the gut enzyme intestinal alkaline phosphatase may explain how aspartame promotes glucose intolerance and obesity in mice

Sarah S Gul et al. Appl Physiol Nutr Metab. 2017 Jan.

Abstract

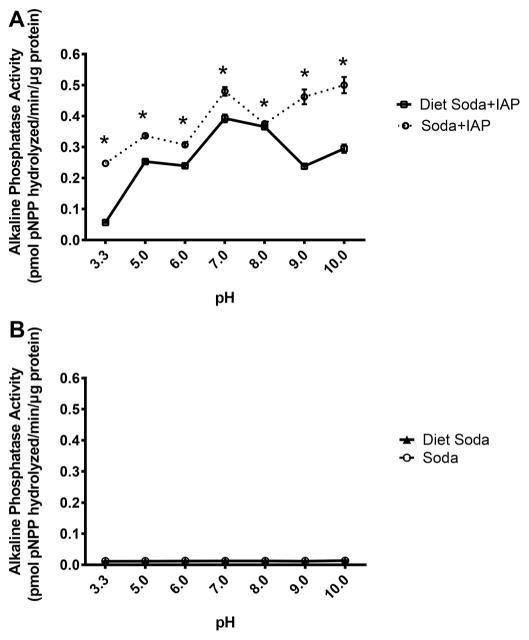
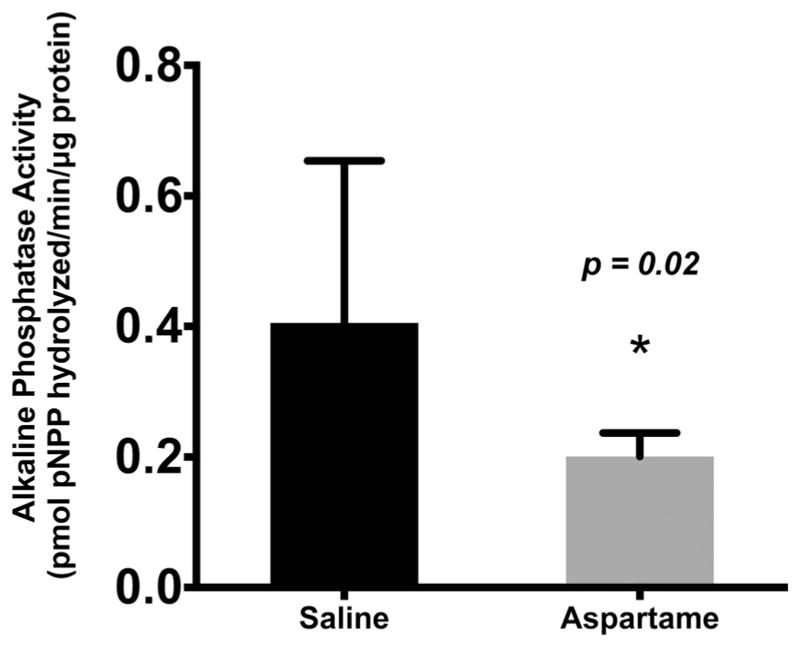
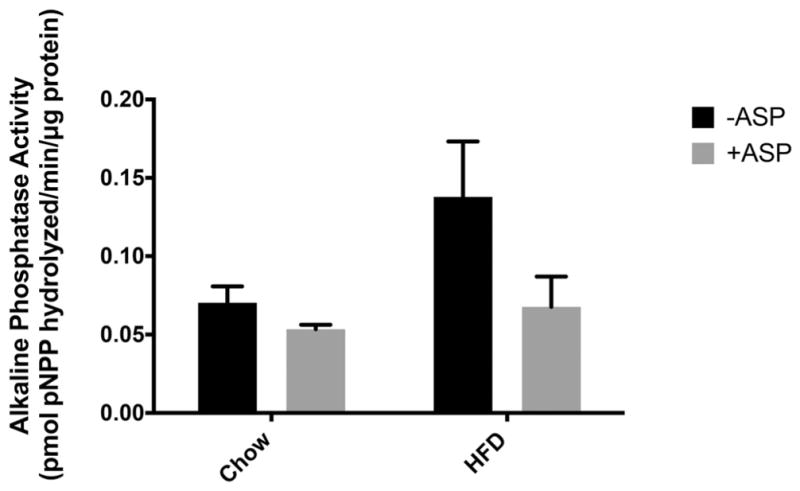
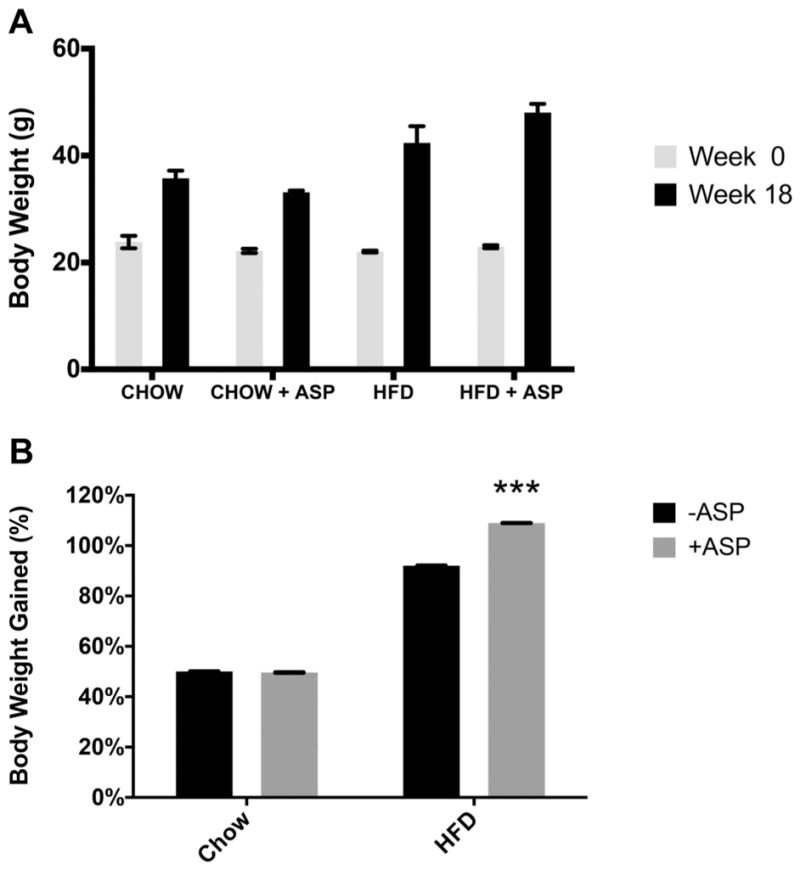
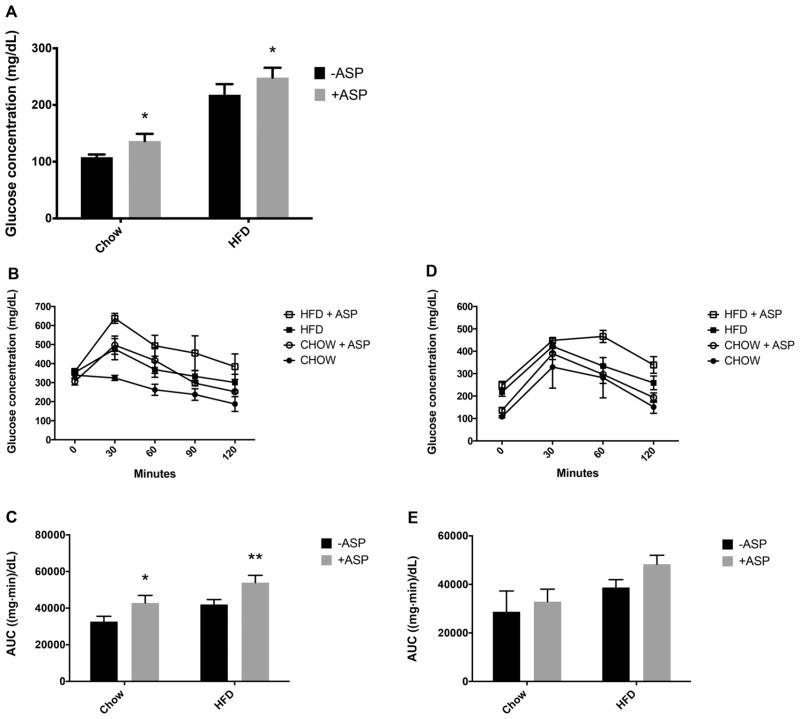
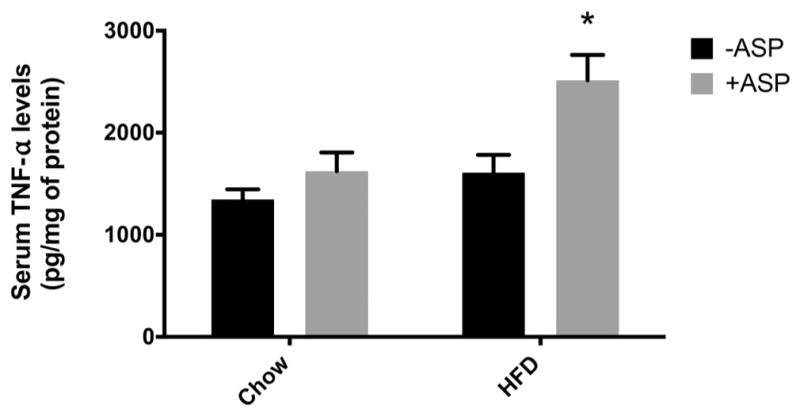
Diet soda consumption has not been associated with tangible weight loss. Aspartame (ASP) commonly substitutes sugar and one of its breakdown products is phenylalanine (PHE), a known inhibitor of intestinal alkaline phosphatase (IAP), a gut enzyme shown to prevent metabolic syndrome in mice. We hypothesized that ASP consumption might contribute to the development of metabolic syndrome based on PHE's inhibition of endogenous IAP. The design of the study was such that for the in vitro model, IAP was added to diet and regular soda, and IAP activity was measured. For the acute model, a closed bowel loop was created in mice. ASP or water was instilled into it and IAP activity was measured. For the chronic model, mice were fed chow or high-fat diet (HFD) with/without ASP in the drinking water for 18 weeks. The results were that for the in vitro study, IAP activity was lower (p < 0.05) in solutions containing ASP compared with controls. For the acute model, endogenous IAP activity was reduced by 50% in the ASP group compared with controls (0.2 ± 0.03 vs 0.4 ± 0.24) (p = 0.02). For the chronic model, mice in the HFD + ASP group gained more weight compared with the HFD + water group (48.1 ± 1.6 vs 42.4 ± 3.1, p = 0.0001). Significant difference in glucose intolerance between the HFD ± ASP groups (53 913 ± 4000.58 (mg·min)/dL vs 42 003.75 ± 5331.61 (mg·min)/dL, respectively, p = 0.02). Fasting glucose and serum tumor necrosis factor-alpha levels were significantly higher in the HFD + ASP group (1.23- and 0.87-fold increases, respectively, p = 0.006 and p = 0.01). In conclusion, endogenous IAP's protective effects in regard to the metabolic syndrome may be inhibited by PHE, a metabolite of ASP, perhaps explaining the lack of expected weight loss and metabolic improvements associated with diet drinks.

Keywords: alcaline phosphatase intestinale; aspartame; diet-induced insulin resistance; insulin resistance; insulinorésistance; insulinorésistance induite par la diète; intestinal alkaline phosphatase; non-nutritive sweeteners; noncaloric sweeteners; obesity; obésité; édulcorants non caloriques; édulcorants non nutritifs.


Conflict of interest statement

Conflict of interest statement

The authors declare no conflicting financial interests.

Figures

Fig. 1
Fig. 1
Effect of aspartame on intestinal alkaline phosphatase (IAP) activity in vitro in the pH range 3.3–10. Diet soda contains aspartame, but regular soda does not. Without adding IAP to the soda solutions, no alkaline phosphatase activity was present (A). After adding IAP to the drink solutions, IAP was most significantly inhibited by the aspartame in the diet soda with basic pHs resembling the duodenal environment (B). Values are means ± SE, n = 3. pPNNP, p-nitrophenyl phosphate. *, Significant change from regular soda baseline as determined by t tests at each pH data point, p < 0.05.
Fig. 2
Fig. 2
Effect of aspartame on the activity of intraluminal intestinal alkaline phosphatase (IAP) in an isolated bowel loop in mice. When aspartame is instilled in a closed bowel loop, IAP activity is significantly inhibited compared with a saline control (p = 0.02). Values are means ± SE, n = 5. pPNNP, p-nitrophenyl phosphate. *, Significant change from saline baseline, p < 0.05.
Fig. 3
Fig. 3
Effect of drinking-water aspartame (ASP) on intraluminal intestinal alkaline phosphatase (IAP) activity in mice fed a chow diet or high-fat diet (HFD). A trend was seen where +ASP groups had decreased intestinal alkaline phosphatase activity, but this difference was not significant with a 2-way ANOVA (p = 0.3). Values are means ± SE, n = 4. +ASP, solutions containing ASP; −ASP, controls without ASP; pPNNP, p-nitrophenyl phosphate.
Fig. 4
Fig. 4
Effect of high-fat diet (HFD) and aspartame (ASP) on mouse weight. Mouse weight was measured at week 0, then the mice were fed a chow diet ± ASP or HFD ± ASP; weight was again measured after 18 weeks (A). Although percent body weight gain (B) was not significantly different for the chow diet groups, percent body weight gain was significantly increased for the HFD group with ASP (p < 0.0001). A 2-way ANOVA test showed that ASP and diet both significantly affected weight. Values are means ± SE, n = 4. +ASP, solutions containing ASP; −ASP, controls without ASP. ***, Significant change from respective diet and −ASP baseline via Tukey’s multiple comparison test, p < 0.0001.
Fig. 5
Fig. 5
Effects of aspartame (ASP) on glucose tolerance on mice with a chow diet ± ASP or a high-fat diet (HFD) ± ASP. Fasting blood sugar following 16 h of fasting (A). Blood glucose was measured over time following 6 h (B) and 16 h (D) of fasting. The total area under the curve (AUC) of the blood glucose graphs was calculated after the 6-h (C) and 16-h (E) fasting periods to express glucose tolerance. A 2-way ANOVA showed that ASP and diet both significantly affect glucose tolerance after 6 h of fasting. Values are means ± SE, n = 4. +ASP, solutions containing ASP; −ASP, controls without ASP. *, Significant change from respective diet and −ASP baseline via Tukey’s multiple comparison test, p < 0.05. **, p < 0.01.
Fig. 6
Fig. 6
Effect of aspartame (ASP) on serum tumor necrosis factor alpha (TNF-α) levels on mice with a chow diet ± ASP or a high-fat diet (HFD) ± ASP. A 2-way ANOVA showed that ASP and diet both significantly affect serum TNF-α levels (p = 0.005). There was a significant increase in serum TNF-α in high-fat diet (HFD) + ASP (p = 0.009). Values are means ± SE, n = 4. +ASP, solutions containing ASP; −ASP, controls without ASP. *, Significant change from respective diet and −ASP baseline via Tukey’s multiple comparison test, p < 0.05.

References

    1. Alleva R, Borghi B, Santarelli L, Strafella E, Carbonari D, Bracci M, Tomasetti M. In vitro effect of aspartame in angiogenesis induction. Toxicol In Vitro. 2011;25:286–293. doi: 10.1016/j.tiv.2010.09.002. - DOI - PubMed
    1. Anton SD, Martin CK, Han H, Coulon S, Cefalu WT, Geiselman P, Williamson DA. Effects of stevia, aspartame, and sucrose on food intake, satiety, and postprandial glucose and insulin levels. Appetite. 2010;55:37–43. doi: 10.1016/j.appet.2010.03.009. - DOI - PMC - PubMed
    1. Araujo JR, Martel F, Keating E. Exposure to non-nutritive sweeteners during pregnancy and lactation: impact in programming of metabolic diseases in the progeny later in life. Reprod Toxicol. 2014;49:196–201. doi: 10.1016/j.reprotox.2014.09.007. - DOI - PubMed
    1. Azad MB, Sharma AK, de Souza RJ, Dolinsky VW, Becker AB, Mandhane PJ, et al. Association between artificially sweetened beverage consumption during pregnancy and infant body mass index. JAMA Pediatr. 2016;170:662–670. doi: 10.1001/jamapediatrics.2016.0301. - DOI - PubMed
    1. Bachmanov AA, Tordoff MG, Beauchamp GK. Sweetener preference of C57BL/6ByJ and 129P3/J mice. Chem Senses. 2001;26:905–913. doi: 10.1093/chemse/26.7.905. - DOI - PMC - PubMed

MeSH terms