. 2016 Dec 20;9(1):156-172.
doi: 10.18632/aging.101145.

Salvia miltiorrhiza bunge increases estrogen level without side effects on reproductive tissues in immature/ovariectomized mice

Affiliations

Salvia miltiorrhiza bunge increases estrogen level without side effects on reproductive tissues in immature/ovariectomized mice

Ying Xu et al. Aging (Albany NY). .

Abstract

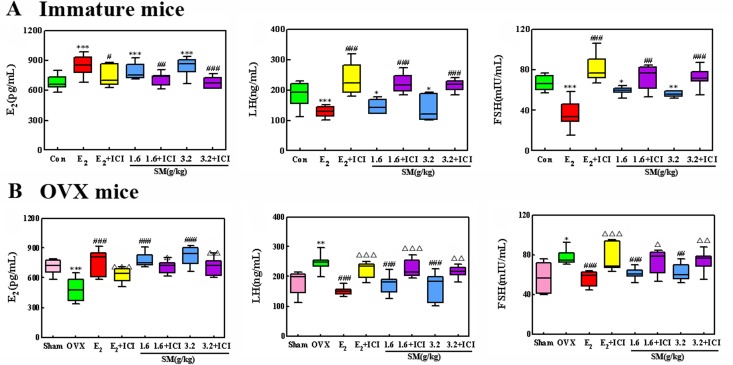
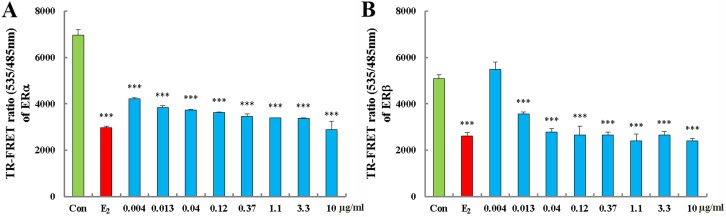
Salvia miltiorrhiza bunge(SM) is a popular herb for alleviating menopausal symptoms, although the scientific evidence of applying SM to estrogen replacement therapy is limited. In this study, we characterized the estrogenic activity of SM using in vivo models of immature and ovariectomized (OVX) mice and performed in vitro studies focusing on the estrogen receptor (ER) pathway for further molecular characterizations. SM treatments demonstrated significant estrogenic activity by promoting the development of uterus and vagina in immature mice, restoring the estrus cycle and reversing the atrophy of reproductive tissues in OVX mice, as well as increasing the expressions of ERα and ERβ at protein and mRNA level in the reproductive tissues. Meanwhile, SM significantly increased estradiol in serum, and decreased follicle-stimulating hormone (FSH) and luteinizing hormone (LH) in the circulation of immature and OVX mice. SM could stimulate the binding effect of ERα and ERβ, and significantly induce ERα/β-estrogen response element (ERE) luciferase reporter gene expression. All these activities were inhibited by the ER antagonist ICI182, 780. This study demonstrates SM exerts estrogenic effects by stimulating biosynthesis of estrogen and increasing ERs in target tissues without side effects on reproductive tissues and through ER-ERE-dependent pathway.

Keywords: Salvia miltiorrhiza bunge; estrogen receptor antagonist ICI182, 780; estrogen receptors; estrogenic effect; reproductive target tissue.


Conflict of interest statement

CONFLICTS OF INTEREST

The authors declare no conflict of interest.

Figures

Figure 1
Figure 1. The effect of Salvia miltiorrhiza bunge (SM) on the estrous cycle
ICI refers to the estrogen antagonist ICI182, 780 and E2 to 17β -estradiol. (A) The estrous cycle of the Immature mice, (i) the control group with untreated; (ii) Treated with estradiol (E2) ; (iii) Treated with Salvia miltiorrhiza bunge (SM) and (iV) Treated with Salvia miltiorrhiza bunge (SM) with estrogen receptor antagonist (ICI182, 780). (B) The estrous cycle of the OVX mice, (i) Ovariectomized (OVX) mice untreated; (ii) Sham group with untreated; (iii) Treated with Salvia miltiorrhiza bunge (SM) and (iV) Treated with Salvia miltiorrhiza bunge (SM) with estrogen receptor antagonist (ICI182, 780).
Figure 2
Figure 2. The effects of SM on uterine, body weights and adrenal gland
(A) The uterine weights of immature mice were measured at the end of the 7-day treatment period. (B) The uterus index for ovariectomized (OVX) mice was measured at the end of the 4-week treatment period. (C) Body weights of OVX mice were measured once per week for 4 weeks. (D) The adrenal gland index of ovariectomized (OVX) mice was measured at the end of the 4-week treatment period. Data are the mean and standard deviation (SD) of samples from 10 mice. P values are for the one-way analysis of variance (ANOVA) comparing the treatment group with untreated mice. (A) ***P < 0.001, **P < 0.01 and *P < 0.05 compared with the Con group; ###P < 0.001 compared with the SM group or E2 group; (B, C, D)***P < 0.001 and *P < 0.05 compared with the Sham group;###P < 0.001 and #P < 0.05 compared with the OVX group;Δ Δ Δ P < 0.001, Δ ΔP < 0.01, and ΔP < 0.05 compared with the SM group or E2 group.
Figure 3
Figure 3. The effects of SM on serum estradiol (E2), luteinizing hormone (LH) and follicle-stimulating hormone (FSH) in immature and ovariectomized (OVX) mice
(A) Serum levels of E2, LH and FSH from immature mice and (B) serum levels of E2, LH and FSH from ovariectomized (OVX) mice were measured at the end of the treatment period. Data are the mean and standard deviation (SD) of samples from 10 mice. P values are for the one-way analysis of variance (ANOVA) comparing treatment groups with untreated mice. (A) ***P < 0.001, **P < 0.01 and *P < 0.05 compared with the Con group; ###P < 0.001;##P < 0.01 and #P < 0.05 compared with the SM group or E2 group; (B)***P < 0.001;**P < 0.01 and *P < 0.05 compared with the Sham group;###P < 0.001 and ##P < 0.01 compared with the OVX group; Δ Δ ΔP < 0.001, Δ ΔP < 0.01, andΔ ΔP < 0.05 compared with the SM group or E2 group.
Figure 4
Figure 4. The effects of SM on the histology of the uterus and vagina in immature and ovariectomized (OVX) mice
Representative photomicrographs taken at 200-X magnifiation of uterine in immature mice; 100-X magnifiation of uterine in ovariectomized (OVX) mice and 400-X magnifiation of vaginal sections. (A, B) are the histology of the uterus and vagina in immature mice. (C, D) are the histology of the uterus and vagina in ovariectomized (OVX) mice. The treatment groups in immature mice are shown: (i) control group; (ii) treated with E2; (iii) treated with E2 and ICI; (iv) treated with SM at 1.6 g/kg; (v) treated with SM at 1.6 g/kg and ICI, (vi) treated with SM at 3.2 g/kg; (vii) treated with SM at 3.2 g/kg and ICI. The treatment groups in OVX mice are shown: (i) sham-operated mice; (ii) untreated OVX mice; (iii) treated with E2; (iv) treated with E2 and ICI, (v) treated with SM at 1.6 g/kg; (vi) treated with SM at 1.6 g/kg and ICI; (vii) treated with SM at 3.2 g/kg; (viii) treated with SM at 3.2 g/kg and ICI.
Figure 5
Figure 5. The effects of SM on the expressions of estrogen receptor ERα and β in the uterus and vagina
ERs expressions were assessed by immunohistochemistry. Representative photomicrographs taken at 200-X magnifiation of uterine in immature mice; 100-X magnifiation of uterine in ovariectomized (OVX) mice and 400-X magnifiation of vaginal sections. (A) show expression of ERs in immature mice. Treatment groups are shown: (i) control group; (ii) treated with E2; (iii) treated with E2 and ICI; (iv) treated with SM at 1.6 g/kg; (v) treated with SM at 1.6 g/kg and ICI, (vi) treated with SM at 3.2 g/kg; (vii) treated with SM at 3.2 g/kg and ICI. (B) show the expression of ERs in the ovariectomized (OVX) mice. Treatment groups are shown: (i) sham-operated mice; (ii) untreated OVX mice; (iii) treated with E2; (iv) treated with E2 and ICI, (v) treated with SM at 1.6 g/kg; (vi) treated with SM at 1.6 g/kg and ICI; (vii) treated with SM at 3.2 g/kg; (viii) treated with SM at 3.2 g/kg and ICI. Data are the mean and standard deviation from 10 mice. P values are for the one-way analysis of variance comparing the treatment group with untreated mice. (A) ***P < 0.001, **P < 0.01 and *P < 0.05 compared with the Con group; ###P < 0.001 and ##P < 0.01compared with the SM group or E2 group;▴▴P < 0.01 and P < 0.05 compared with the ERα. (B)***P < 0.001 compared with the Sham group;###P < 0.001 and ##P < 0.05 compared with the OVX group; Δ Δ ΔP < 0.001 compared with the SM group or E2 group.
Figure 6
Figure 6. The effects of SM on the protein and gene expression of estrogen receptor ERα and ERβ in the uterus and vagina of mice
Western-blot (A, C) and Realtime PCR (B, D) analysis was carried out as described in the Methods. Representative blots are shown above, and quantitative analyses are shown below. P values are for one-way analysis of variance (ANOVA) comparing treatment groups with untreated mice. (A, B) ***P < 0.001, **P < 0.01 and *P < 0.05 compared with the Con group; ###P < 0.001 and ##P < 0.01compared with the SM group or E2 group;▴▴P < 0.01 compared with the ERα. (C, D)***P < 0.001 compared with the Sham group;###P < 0.001, ##P < 0.01and #P < 0.05 compared with the OVX group; Δ Δ ΔP < 0.001 and Δ ΔP < 0.01compared with the SM group or E2 group.
Figure 7
Figure 7. Effect of SM on viability of MCF-7 cells
Cell proliferation was carried out as described in the Materials and Methods. Results are expressed relative to the growth of cells treated with 1% dimethylsulfoxide (DMSO). Data are the mean ± standard deviation of quadruplicate analyses, expressed relative to that of treatment with 0.1% DMSO. ***p < 0.001, *p < 0.05 compared to Con; ###p < 0.001, compared to SM or 0.01 μM E2.
Figure 8
Figure 8. Effect of SM on ability of ERα binding (A) and ERβ (B)
Each data point represents the mean ±standard of triplicate samples. ***p < 0.001 compared to Con.
Figure 9
Figure 9. Activity of SM on estrogen receptor ERα (A) and ERβ (B) -estrogen response element (ERE) luciferases reporter gene expression
Data are the mean ± standard deviation of quadruplicate analyses, expressed relative to that of treatment with 0.1% DMSO. P values are for one-way analysis of variance (ANOVA) comparing treatment groups with untreated mice. ***P < 0.01, **P < 0.01 and *P < 0.05 compared with Con group; ###p < 0.001, compared to SM or 0.01 μM E2.

Similar articles

Cited by

References

    1. Burger H. Hormone replacement therapy in the post-Women's Health Initiative era. Report a meeting held in Funchal, Madeira, February 24-25. Climacteric. 2003:11–36. - PubMed
    1. Grady D. Postmenopausal hormones--therapy for symptoms only. N Engl J Med. 2003;348:1835–37. doi: 10.1056/NEJMp030038. - DOI - PubMed
    1. Fernandez E, Gallus S, Bosetti C, Franceschi S, Negri E, La Vecchia C. Hormone replacement therapy and cancer risk: a systematic analysis from a network of case-control studies. Int J Cancer. 2003;105:408–12. doi: 10.1002/ijc.11083. - DOI - PubMed
    1. Humphries KH, Gill S, Mansour J. Risks and benefits of hormone replacement therapy: the evidence speaks. CMAJ. 2003;168:1001–10. - PMC - PubMed
    1. Barone M, Tanzi S, Lofano K, Scavo MP, Guido R, Demarinis L, Principi MB, Bucci A, Di Leo A. Estrogens, phytoestrogens and colorectal neoproliferative lesions. Genes Nutr. 2008;3:7–13. doi: 10.1007/s12263-008-0081-6. - DOI - PMC - PubMed

MeSH terms