

Genomic and transcriptomic analysis of imatinib resistance in gastrointestinal stromal tumors
- PMID: 27997714
- PMCID: PMC5324566
- DOI: 10.1002/gcc.22438
Genomic and transcriptomic analysis of imatinib resistance in gastrointestinal stromal tumors
Abstract
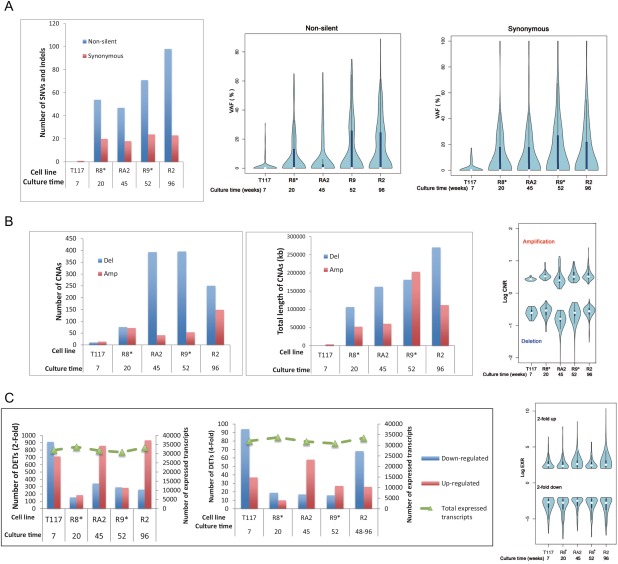
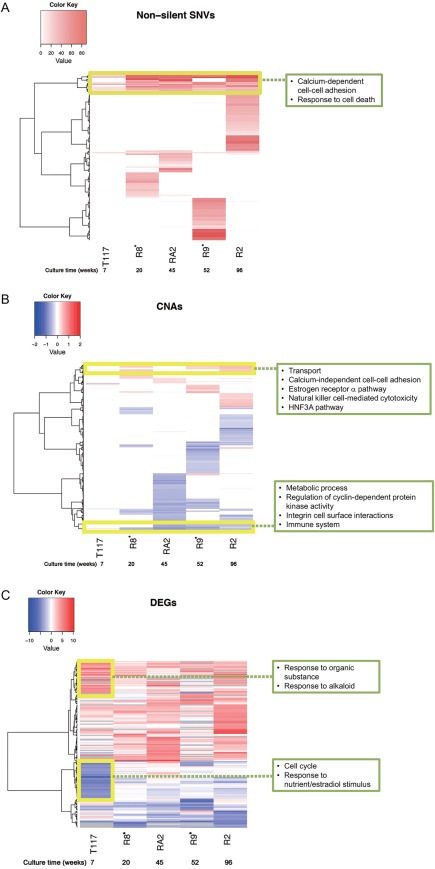
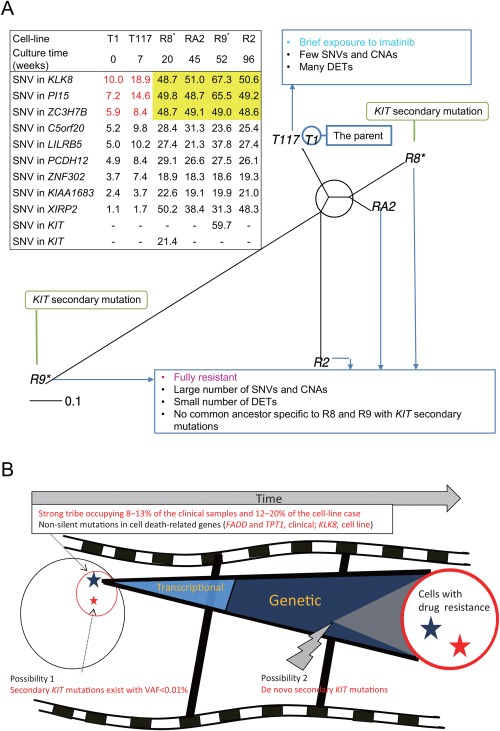
Gastrointestinal stromal tumors represent the most common mesenchymal tumor of the digestive tract, driven by gain-of-function mutations in KIT. Despite its proven benefits, half of the patients treated with imatinib show disease progression within 2 years due to secondary resistance mutations in KIT. It remains unclear how the genomic and transcriptomic features change during the acquisition of imatinib resistance. Here, we performed exome sequencing and microarray transcription analysis for four imatinib-resistant cell lines and one cell line briefly exposed to imatinib. We also performed exome sequencing of clinical tumor samples. The cell line briefly exposed to imatinib exhibited few single-nucleotide variants and copy-number alterations, but showed marked upregulation of genes related to detoxification and downregulation of genes involved in cell cycle progression. Meanwhile, resistant cell lines harbored numerous genomic changes: amplified genes related to detoxification and deleted genes with cyclin-dependent kinase activity. Some variants in the resistant samples were traced back to the drug-sensitive samples, indicating the presence of ancestral subpopulations. The subpopulations carried variants associated with cell death. Pre-existing cancer cells with genetic alterations promoting apoptosis resistance may serve as a basis whereby cancer cells with critical mutations, such as secondary KIT mutations, can establish full imatinib resistance. © 2017 The Authors Genes, Chromosomes and Cancer Published by Wiley Periodicals, Inc.
© 2017 The Authors Genes, Chromosomes and Cancer Published by Wiley Periodicals, Inc.
Figures
References
-
- Antonescu CR, Besmer P, Guo T, Arkun K, Hom G, Koryotowski B, Leversha MA, Jeffrey PD, Desantis D, Singer S, Brennan MF, Maki RG, DeMatteo RP. 2005. Acquired resistance to imatinib in gastrointestinal stromal tumor occurs through secondary gene mutation. Clin Cancer Res 11:4182–4190. - PubMed
-
- Bauer S, Yu LK, Demetri GD, Fletcher JA. 2006. Heat shock protein 90 inhibition in imatinib‐resistant gastrointestinal stromal tumor. Cancer Res 66:9153–9161. - PubMed
-
- Blanke CD, Rankin C, Demetri GD, Ryan CW, von Mehren M, Benjamin RS, Raymond AK, Bramwell VH, Baker LH, Maki RG, Tanaka M, Hecht JR, Heinrich MC, Fletcher CD, Crowley JJ, Borden EC. 2008. Phase III randomized, intergroup trial assessing imatinib mesylate at two dose levels in patients with unresectable or metastatic gastrointestinal stromal tumors expressing the kit receptor tyrosine kinase: S0033. J Clin Oncol 26:626–632. - PubMed
-
- Cane S, Bignotti E, Bellone S, Palmieri M, De las Casas L, Roman JJ, Pecorelli S, Cannon MJ, O'Brien T, Santin AD. 2004. The novel serine protease tumor‐associated differentially expressed gene‐14 (KLK8/Neuropsin/Ovasin) is highly overexpressed in cervical cancer. Am J Obstet Gynecol 190:60–66. - PubMed
-
- Corless CL. 2014. Gastrointestinal stromal tumors: what do we know now? Mod Pathol 27:S1–S16. - PubMed
Publication types
MeSH terms
Substances
LinkOut - more resources
Full Text Sources
Other Literature Sources
Molecular Biology Databases
Research Materials
