. 2017 Apr;27(4):359-377.
doi: 10.1002/hipo.22696. Epub 2017 Feb 2.

Behavior-dependent activity patterns of GABAergic long-range projecting neurons in the rat hippocampus

Affiliations

Behavior-dependent activity patterns of GABAergic long-range projecting neurons in the rat hippocampus

Linda Katona et al. Hippocampus. 2017 Apr.

Abstract

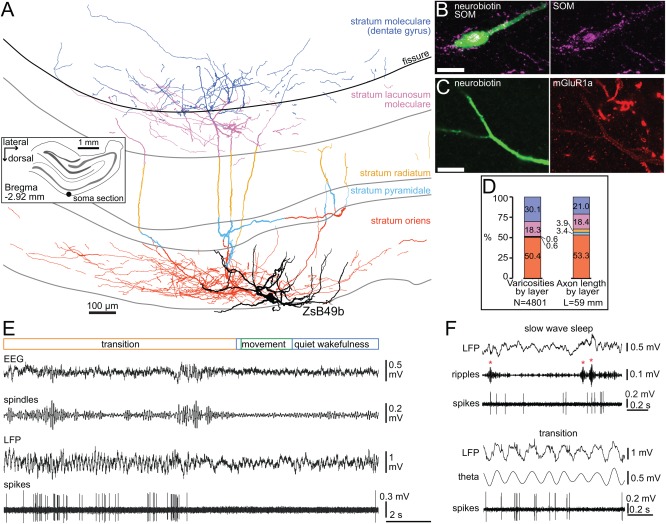
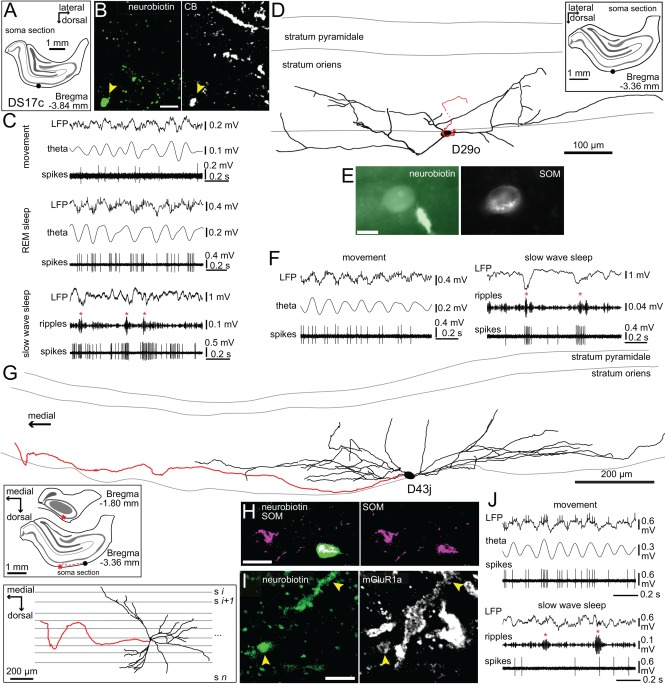
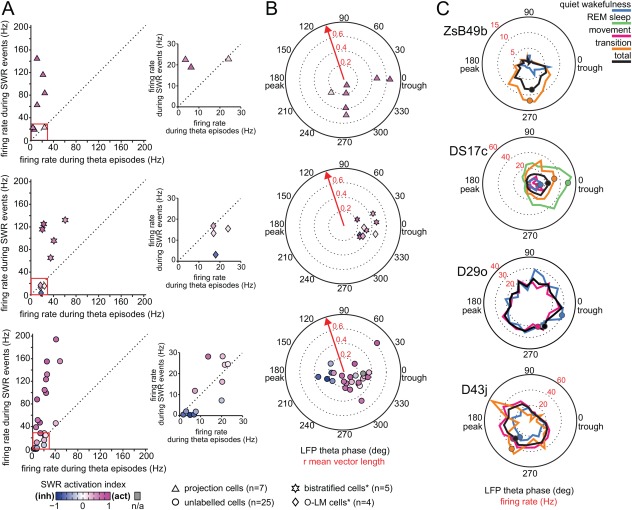
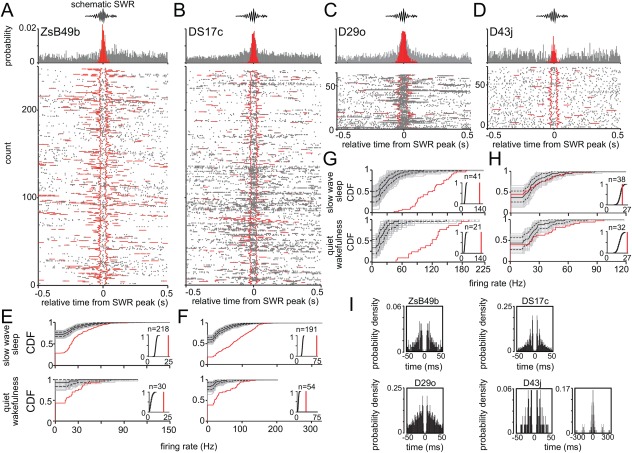
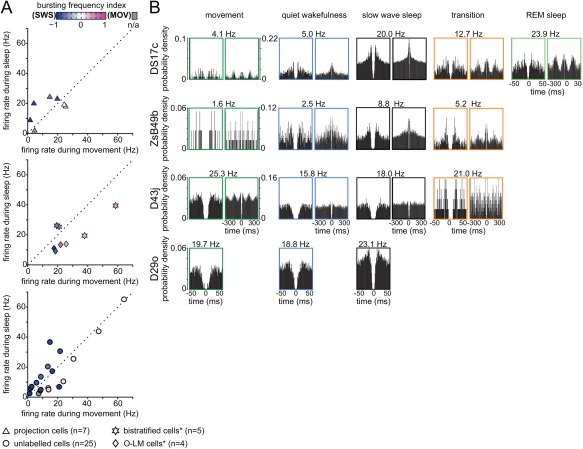
Long-range glutamatergic and GABAergic projections participate in temporal coordination of neuronal activity in distributed cortical areas. In the hippocampus, GABAergic neurons project to the medial septum and retrohippocampal areas. Many GABAergic projection cells express somatostatin (SOM+) and, together with locally terminating SOM+ bistratified and O-LM cells, contribute to dendritic inhibition of pyramidal cells. We tested the hypothesis that diversity in SOM+ cells reflects temporal specialization during behavior using extracellular single cell recording and juxtacellular neurobiotin-labeling in freely moving rats. We have demonstrated that rare GABAergic projection neurons discharge rhythmically and are remarkably diverse. During sharp wave-ripples, most projection cells, including a novel SOM+ GABAergic back-projecting cell, increased their activity similar to bistratified cells, but unlike O-LM cells. During movement, most projection cells discharged along the descending slope of theta cycles, but some fired at the trough jointly with bistratified and O-LM cells. The specialization of hippocampal SOM+ projection neurons complements the action of local interneurons in differentially phasing inputs from the CA3 area to CA1 pyramidal cell dendrites during sleep and wakefulness. Our observations suggest that GABAergic projection cells mediate the behavior- and network state-dependent binding of neuronal assemblies amongst functionally-related brain regions by transmitting local rhythmic entrainment of neurons in CA1 to neuronal populations in other areas. © 2016 The Authors Hippocampus Published by Wiley Periodicals, Inc.

Keywords: CA1; dendritic inhibition; sharp wave-ripples; somatostatin; theta oscillations.


Figures

Figure 1
Figure 1
Behavior related activity of a novel back‐projecting non‐pyramidal cell (ZsB49b) in the hippocampal CA1 area. (A) Reconstruction of the labeled neuron. Note the target layer selectivity of the axon (color‐coded by layers) innervating strongly strata oriens and lacunosum moleculare, crossing the hippocampal fissure and forming a wide axonal plexus in the outer third part of dentate molecular layer. The soma and horizontally oriented dendrites (black) were located in stratum oriens. Inset, location of the cell body (black dot) in stratum oriens in a coronal section, left hemisphere. Shaded gray areas delineate the pyramidal and granule cell layers. (B) The neurobiotin‐labeled cell body and a proximal dendrite (green) were immunopositive for somatostatin (confocal microscopic image, maximum intensity projection, z stack, height 14 μm). Scale bar, 10 μm. (C) The dendritic membrane of the labeled neuron was enriched in the metabotropic glutamate receptor type 1 alpha (single plane image). Scale bar, 10 μm. (D) Proportions of axon varicosities and axon length quantified by target layers, showing preference for stratum oriens and a significant back‐projection to the molecular layer (color coding as in A). (E) Recording trace of the activity pattern of this neuron; when the rat roused the cell became inactive for a few seconds. (F) Top, Recording trace of the activity of the neuron during slow wave sleep enriched in hippocampal SWRs (red asterisks). Bottom, a transition period towards arousal with prominent hippocampal theta oscillations. Spindles, filtered 7–14 Hz; ripples, filtered 130–230 Hz; theta, filtered 5–12 Hz.
Figure 2
Figure 2
Behavior related activity of horizontal SOM‐expressing non‐pyramidal cells (DS17c, D29o and D43j) in the hippocampal CA1 area. (A) The location of the cell body of DS17c (black dot) was extrapolated from the convergence of dendrites in a coronal section of the right hemisphere. Shaded gray areas delineate the pyramidal and granule cell layers also in subsequent insets. (B) The neurobiotin filled dendrite (arrowhead) was immunopositive for calbindin (confocal microscopic single plane image). Scale bar, 5 μm. (C) Recording traces of the activity of DS17c during movement and REM sleep with prominent theta oscillations and during slow wave sleep with hippocampal SWRs (red asterisks). (D) Reconstruction of the neuron D29o with soma and the dendritic tree (four 70‐μm‐thick sections) in stratum oriens and the axon originating from a proximal dendrite and projecting caudally towards the subiculum; it could be followed through ten sections from the soma spanning ∼0.7 mm where the labeling faded. Inset, location of the cell body (black dot) in stratum oriens of the right hemisphere. (E) The neurobiotin‐filled cell body (green) was immunopositive for somatostatin (single plane epifluorescence image). Scale bar, 10 μm. (F) Recording traces of the activity of D29o during movement with prominent theta oscillations and during slow wave sleep enriched in hippocampal SWRs. (G) Reconstruction of the cell body, extensive dendritic tree (black, ten 70‐μm‐thick sections) and the initial portion of the main axon (red, four 70‐μm‐thick sections) of cell D43j. The projection axon travelled in rostro‐medial direction and was last observed in the anterior tip of the hippocampus (see top inset) before the signal faded. Inset top, location of the soma (black dot) in stratum oriens and of the projection route (red asterisk) of the axon, right hemisphere. Inset bottom, reconstruction viewed from top of the brain. (H) The neurobiotin‐labeled soma (green) was immunopositive for somatostatin (confocal maximum intensity projection, z stack, height 4.2 μm). Scale bar, 20 μm. (I) Weak immunoreactivity for metabotropic glutamate receptor type 1 alpha was localized in the labeled dendrites located amongst strongly immunopositive neurons (white, confocal maximum intensity projection, z stack, height 3.6 μm). Scale bar, 5 μm. (J) Recording traces of the activity of D43j during movement with prominent theta oscillations and during slow wave sleep with hippocampal SWRs. Theta, filtered 5–12 Hz; ripples, filtered, 130–230 Hz.
Figure 3
Figure 3
Comparison of oscillatory network state dependent firing rate and spike timing of hippocampal non‐pyramidal cells. (A) Left, comparison of the firing rate of individual neurons recorded in stratum oriens and at the border between strata oriens/pyramidale during theta episodes and SWR events (different symbols used for neuron categories). Right, enlarged firing rate range of 0–30 Hz (red box) for clarity. Note that the majority of cells, including projection cells and bistratified cells, but not O‐LM cells, fired at higher rates during SWR events than during theta episodes. Color coding of symbols represents the SWR‐related activity of each neuron (see methods). Note high SWR activation indices for the majority of neurons (shades of magenta) demonstrating strong increases in firing rates occurring during SWRs as compared to periods outside SWRs. *, data taken from Katona et al. 2014 for comparison. (B) Preferred mean firing phases of individual neurons during theta oscillations and the strength of their spike coupling to theta cycles (dotted circles along red arrow). Top, note that five out of seven labeled projection cells increased their firing rate during the descending slope of theta oscillatory cycles (around 270 deg); two neurons were strongly coupled to the trough of theta cycles, similar to bistratified and O‐LM cells. As a group, most recorded neurons increased their firing rates at and around the trough of theta cycles. Same symbols and color coding used as in A. *, data taken from Katona et al. 2014 for comparison. (C) Distribution of firing phases (color‐coded by behavioral states) and associated firing rates (red numbers) of the labeled GABAergic projection neurons during theta frequency oscillations. Mean preferential theta phases (colored dots) plotted only for theta periods when the cells were significantly coupled to theta oscillatory cycles. Note strong tuning of three of the neurons and the broad distribution of firing phases and associated firing rates for cell D29o.
Figure 4
Figure 4
Activity of labeled GABAergic projection cells during SWRs. (A–D) Average firing probability densities and raster plots of the labeled neurons during SWRs (red bars in histogram) compared to the ± 0.5 s surrounding the peak of SWRs (gray bars in histogram). Most neurons fired with higher probability during SWRs compared to the ± 0.5 s surrounding the peak of SWR events. Raster plots were aligned to the peak SWR‐power. Red lines delineate the beginnings and ends or the duration of ripple events outside the reference SWRs. (E–H) Distribution of SWR‐related firing rates displayed as cumulative distribution functions (CDFs) during sleep and wakefulness. Surrogate sets of 1000 firing rate‐distributions are shown (gray; median, solid black; 95% confidence intervals, dashed lines). Insets, comparison of mean SWR‐related firing rates (red lines) with the distribution of mean SWR‐related rates (black lines) from the surrogate sets. (E–G) The measured distribution of firing rates (red) was significantly right‐shifted from the median (black) of the surrogate set demonstrating strong increases in activity during SWR events over the full range of firing rates (cells ZsB49b, DS17c and D29o; P < 0.05; two‐sample KS test, for both states) or when comparing mean SWR‐related rates (P < 0.05, relative to the surrogate CDF, for both states). (H) During sleep, the measured rates of D43j (red) were similar to those expected from the surrogate distributions (P = 0.4; two‐sample KS test). During wakefulness, the measured distribution of firing rates (red) was significantly right‐shifted (P < 0.05; two‐sample KS test) from the median of the surrogate set (black). Insets, the mean SWR‐related firing rate (red line) was higher than expected from the distribution of surrogate mean SWR‐related rates (black line) during both, sleep and wakefulness (P < 0.05, relative to the surrogate CDF). (I) Spikes triggered autocorrelograms during SWR events. Note short interval peaks demonstrating ripple‐rhythmic spiking of some neurons. Time axes were limited to 50 ms and 300 ms, bin width was set to 1 and 3 ms, respectively.
Figure 5
Figure 5
Behavioral state dependent action potential firing rate and pattern of in vivo recorded non‐pyramidal cells in stratum oriens. (A) Changes in firing rate of individual neurons recorded in stratum oriens and at the border between strata oriens/pyramidale during behavior (different symbols show neuron categorization). Note the wide range in the behavior‐related firing rates of neurons. Top, four out of seven labeled projection cells were more active during sleep than during movement. Color coding represents changes in bursting frequency during sleep and movement (see methods). *, data taken from Katona et al. 2014 for comparison. (B) Behavioral state specific action potential autocorrelograms of the labeled GABAergic projection neurons show great variation; mean firing rates are shown on top. Time axes were limited to 50 ms (left) and 300 ms (right), bin width was set to 1 and 3 ms, respectively.

Similar articles

Cited by

References

    1. Acsády L, Görcs TJ, Freund TF. 1996. Different populations of vasoactive intestinal polypeptide‐immunoreactive interneurons are specialized to control pyramidal cells or interneurons in the hippocampus. Neuroscience 73:317–334. - PubMed
    1. Ali AB, Thomson AM. 1998. Facilitating pyramid to horizontal oriens‐alveus interneurone inputs: Dual intracellular recordings in slices of rat hippocampus. J Physiol 507:185–199. - PMC - PubMed
    1. Amaral DG, Witter MP. 1989. The three‐dimensional organization of the hippocampal formation: A review of anatomical data. Neuroscience 31:571–591. - PubMed
    1. Biró ÁA, Holderith NB, Nusser Z. 2005. Quantal size is independent of the release probability at hippocampal excitatory synapses. J Neurosci 25:223–232. - PMC - PubMed
    1. Blasco‐Ibáñez JM, Freund TF. 1995. Synaptic input of horizontal interneurons in Stratum Oriens of the hippocampal CA1 subfield: Structural basis of feed‐back activation. Eur J Neurosci 7:2170–2180. - PubMed

Publication types