

Review
doi: 10.1186/s13059-016-1127-5.
Methylome evolution in plants
Affiliations
- PMID: 27998290
- PMCID: PMC5175322
- DOI: 10.1186/s13059-016-1127-5
Item in Clipboard
Review
Methylome evolution in plants
Genome Biol.
.
Erratum in
-
Erratum to: Methylome Evolution in plants.Genome Biol. 2017 Feb 27;18(1):41. doi: 10.1186/s13059-017-1176-4. Genome Biol. 2017. PMID: 28241876 Free PMC article. No abstract available.
Abstract
Despite major progress in dissecting the molecular pathways that control DNA methylation patterns in plants, little is known about the mechanisms that shape plant methylomes over evolutionary time. Drawing on recent intra- and interspecific epigenomic studies, we show that methylome evolution over long timescales is largely a byproduct of genomic changes. By contrast, methylome evolution over short timescales appears to be driven mainly by spontaneous epimutational events. We argue that novel methods based on analyses of the methylation site frequency spectrum (mSFS) of natural populations can provide deeper insights into the evolutionary forces that act at each timescale.
Figures
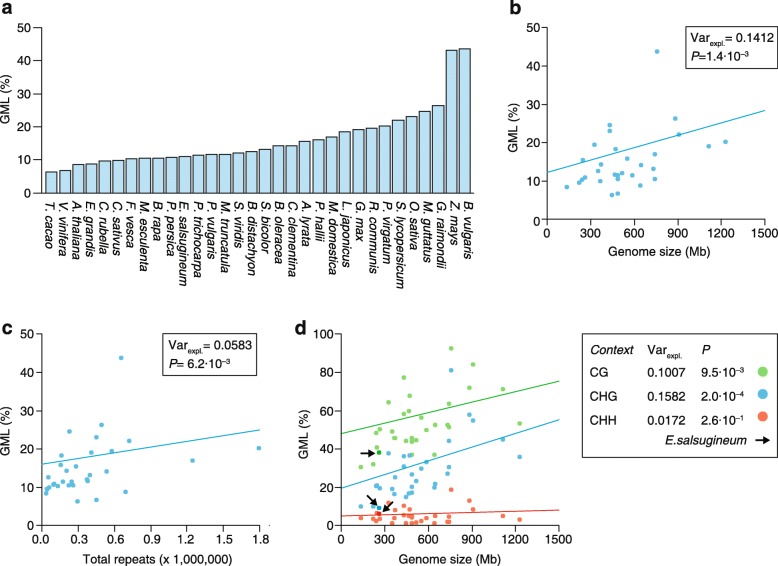
a Overview of genome-wide methylation levels (GMLs) in 32 angiosperm species as determined from whole-genome bisulfite sequencing data. GMLs approximate the percentage of all cytosines in the genome that are methylated. b Phylogeny-adjusted regression fit shows that genome size is positively correlated with GMLs, explaining about 14% of interspecific variation in GMLs (Var
expl.). c Phylogeny-adjusted regression fit shows that the total number of annotated repeats is positively correlated with GMLs, explaining about 6% of interspecific variation in GMLs (Var
expl.). d Phylogeny-adjusted regression fits show that genome size is correlated with context-specific GMLs in contexts CG and CHG, but not in context CHH. The arrow points to Eutrema salsugineum, a natural CMT3 mutant, which shows relatively low CHG- and CG-specific GMLs. Note: Zea mays was excluded from all regression analyses as it is an influential outlier because of its large genome size
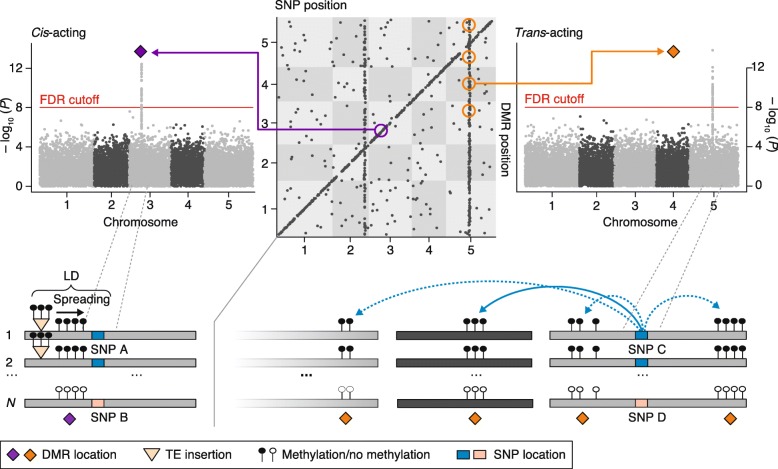
Schematic summary of a methylation quantitative trait locus (meQTL) mapping study in A. thaliana natural accessions. In the cis-trans plot (top middle panel), each dot represents a significant association between a single nucleotide polymorphism (SNP) and a differentially methylated region (DMR). All cis associations map along the diagonal, while trans associations are visible as vertical bands. An example of a commonly detected cis association is shown in the left panel. The SNP-DMR association is a byproduct of linkage disequilibrium (LD) between the SNP and an often undetected transposable element (TE) insertion that has spread methylation into its flanking region. An example of a commonly detected trans- association is shown in the right panel, where a SNP is associated with multiple DMRs across the genome. Such pleiotropic effects can be the result of SNPs in transcription factor genes or methyltransferase genes
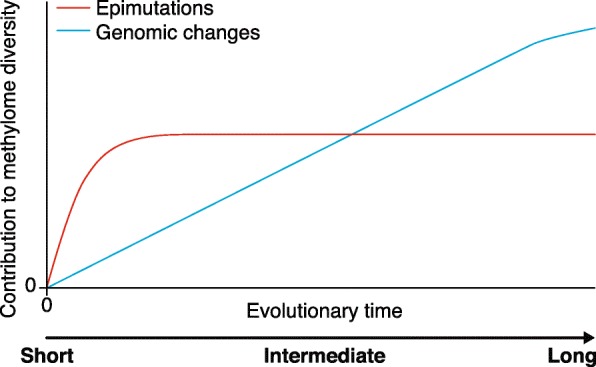
We propose a heuristic model whereby genomic changes and spontaneous epimutations occur simultaneously, and contribute to interspecific or intraspecific methylome diversity over evolutionary time. For illustrative purposes, we assume that lineages descended from a common founder plant at time 0. The rapid accumulation of heritable epimutations dominates methylome diversity over short timescales but quickly converges to an equilibrium diversity value that is defined by the magnitude of forward and backward epimutation rates as well as by their ratios (i.e., the epimutation bias parameter). By contrast, genomic changes accumulate more gradually among lineages, and begin to dominate methylome diversity after longer evolutionary divergence times. An important empirical challenge is to delineate the relative contributions of these two processes based on methylome diversity data collected at any point along this evolutionary trajectory. Recent theoretical models for the analysis of the methylation site frequency spectrum (mSFS) provide an important step in this direction
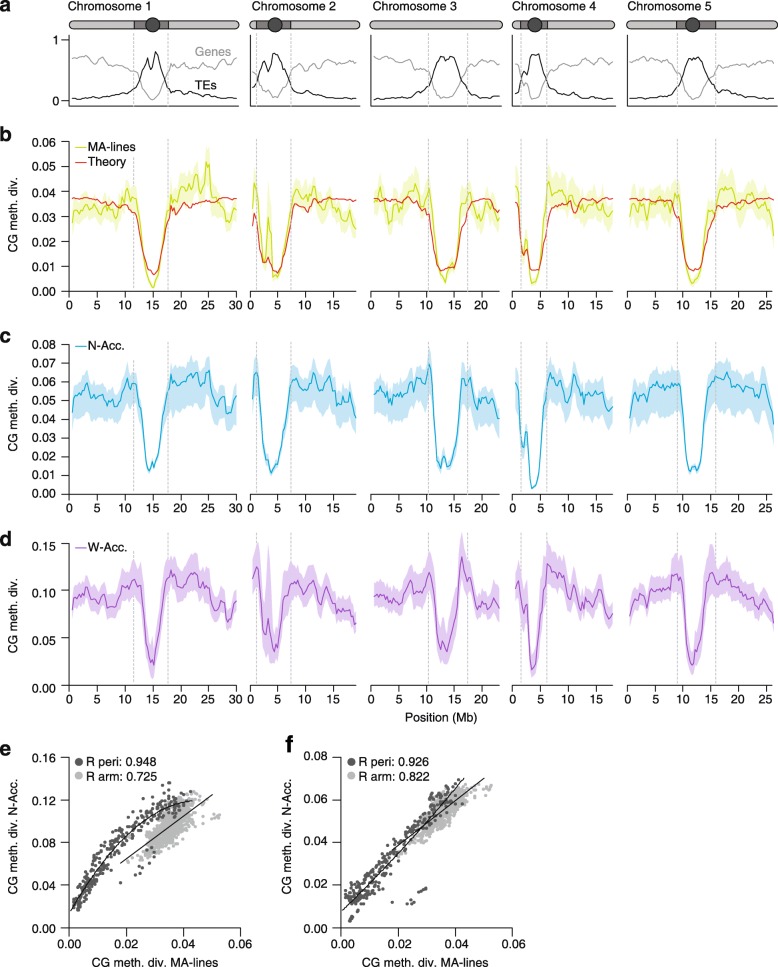
a Gene (light gray) and transposable element (TE) (dark gray) densities along the A. thaliana genome (Columbia reference). A schematic representation of the five chromosomes is shown above (circle, centromere; dark gray, pericentromeric region; light gray, arm). b Annotation-specific CG epimutations produce distinct methylome diversity (CG meth. div.) patterns among mutation accumulation lines (MA-lines) that have diverged for merely 30 generations (average diversity was calculated in 1 Mb sliding windows, step size 100 kb). These diversity patterns can be predicted from annotation-specific estimates of epimutation rate and the density distribution of annotation units along the genome (red theoretical line). c CG methylome diversity (CG meth. div.) patterns among 13 North American accessions (N-Acc.) (after around 200 generations of divergence). d Methylome diversity patterns among 138 worldwide accessions (W-Acc.) (after several hundred thousand years of divergence). e CG methylome diversity patterns are significantly correlated between the MA-lines and the W-Acc., both in pericentromeric (peri) regions (dark gray dots) as well as in euchromatic chromosome arms (light gray dots). f These correlations are even stronger when MA-lines are compared to the N-Acc., suggesting that the accumulation of DNA sequence polymorphism has perturbed epimutation-induced methylome diversity patterns over time
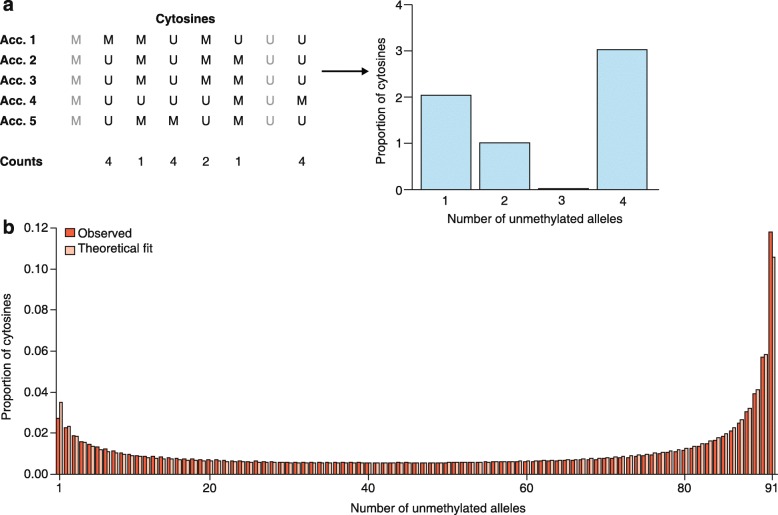
a Simplification of the reconstruction of a methylation site frequency spectrum (mSFS). In this example, we consider a sample size of five accessions (Acc.), and eight sites among which two (in gray) are monomorphic and thus discarded for the mSFS. For each cytosine, each accession might exhibit a methylated (M) or an unmethylated (U) state. For the mSFS, counts are taken of the number of accessions that are unmethylated for that cytosine. These counts define discrete epiallelic classes (number of unmethylated alleles). b The observed frequencies of each epiallelic class is determined, in this case, from genic CG sites of 92 A. thaliana worldwide natural accessions (red bars), along with the maximum likelihood estimate based on the theoretical result of Charlesworth and Jain [123] (pink bars). The theoretical model (see Box 1) provides an accurate fit to the observed genic CG methylation diversity patterns, suggesting that CG epimutations are a major factor in shaping methylome diversity in natural populations of A. thaliana over evolutionary timescales
References
Publication types
MeSH terms
LinkOut - more resources
Full Text Sources
Other Literature Sources
