. 2017 Jan;214(1):49-58.
doi: 10.1084/jem.20161649. Epub 2016 Dec 20.

The cell cycle restricts activation-induced cytidine deaminase activity to early G1

Affiliations

The cell cycle restricts activation-induced cytidine deaminase activity to early G1

Qiao Wang et al. J Exp Med. 2017 Jan.

Abstract

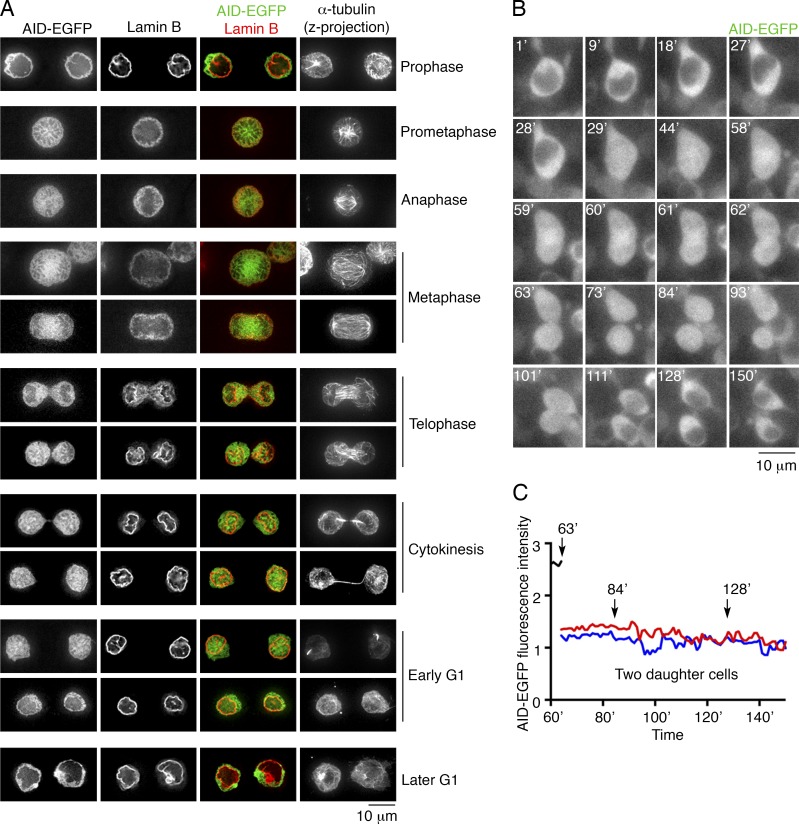
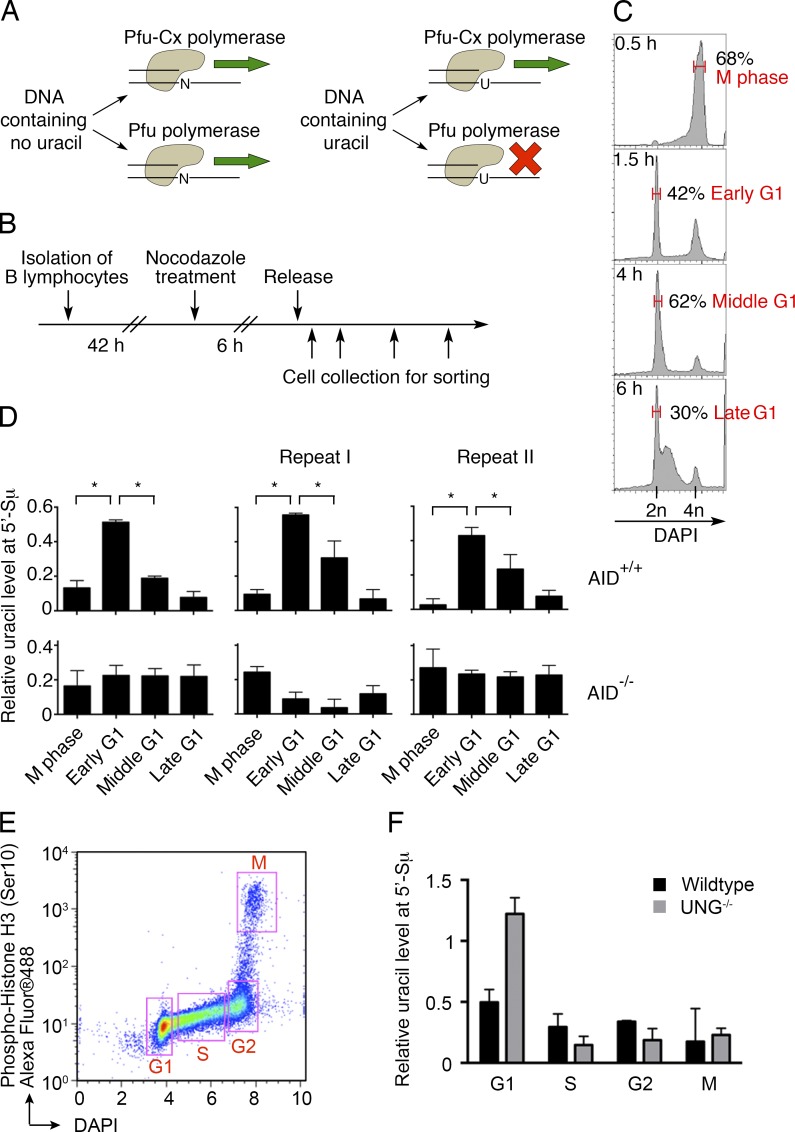
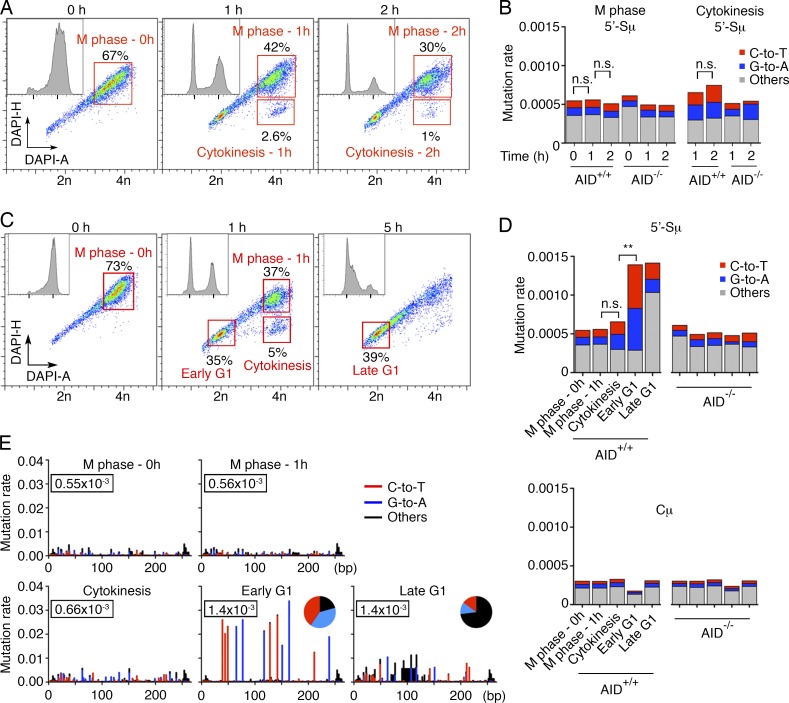
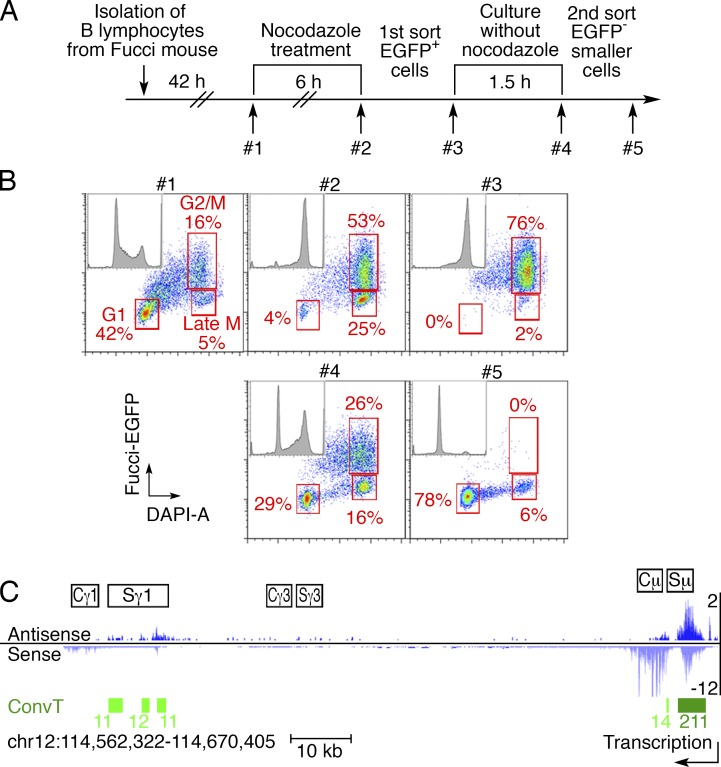
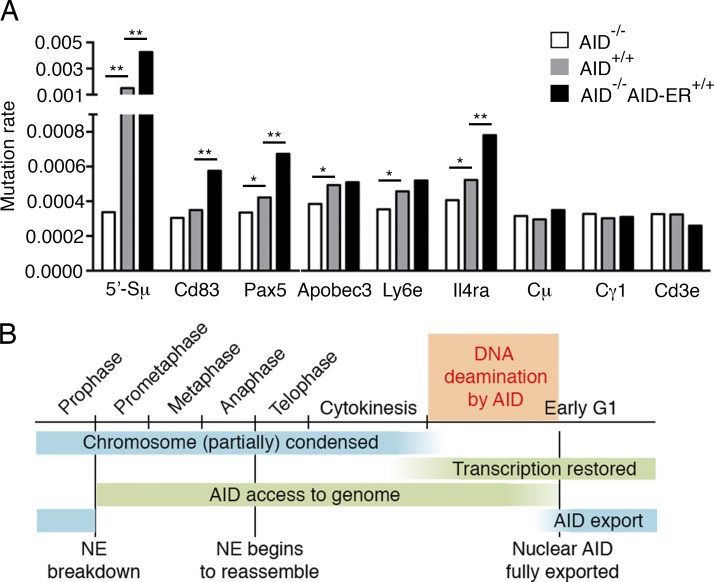
Activation-induced cytidine deaminase (AID) converts cytosine into uracil to initiate somatic hypermutation (SHM) and class switch recombination (CSR) of antibody genes. In addition, this enzyme produces DNA lesions at off-target sites that lead to mutations and chromosome translocations. However, AID is mostly cytoplasmic, and how and exactly when it accesses nuclear DNA remains enigmatic. Here, we show that AID is transiently in spatial contact with genomic DNA from the time the nuclear membrane breaks down in prometaphase until early G1, when it is actively exported into the cytoplasm. Consistent with this observation, the immunoglobulin (Igh) gene deamination as measured by uracil accumulation occurs primarily in early G1 after chromosomes decondense. Altering the timing of cell cycle-regulated AID nuclear residence increases DNA damage at off-target sites. Thus, the cell cycle-controlled breakdown and reassembly of the nuclear membrane and the restoration of transcription after mitosis constitute an essential time window for AID-induced deamination, and provide a novel DNA damage mechanism restricted to early G1.


Figures

Figure 1.
Figure 1.
AID accesses the genome during mitosis, cytokinesis, and a short time period in the early phase of G1. (A) Subcellular localization of AID-EGFP from mitosis to G1. AID-EGFP (green) and Lamin B (red, nuclear envelope) are represented by single optical slices (35–40 z-slices each cell). A projection of all slices of α-tubulin shows the microtubule network. The combination of nuclear envelope and microtubule network allows determination of the cell cycle stage. Bar, 10 µm. Three independent experiments. (B) Time-lapse imaging of AID-EGFP–expressing B cells during cell division (see Video 1). Single optical z-slices are shown for each time point (indicated in minutes in the top left corner). Bar, 10 µm. Two independent experiments were performed. (C) Relative fluorescence intensity of AID-EGFP after cell division. Total AID-EGFP fluorescence was measured over time, and no significant changes in total fluorescence are recorded in the daughter cells (red and blue lines).
Figure 2.
Figure 2.
Uracil-qPCR detects uracil accumulation at the antibody 5′-Sμ region. (A) Diagram of how Pfu polymerase and its mutant Pfu-Cx act on DNA. Uracil-free DNA can be amplified by both Pfu and Pfu-Cx polymerases (left). The lack of uracil recognition by Pfu-Cx polymerase allows it to replicate uracil-containing DNA, whereas Pfu polymerase stalls (right). This differential ability to amplify uracil-containing DNA is harnessed to measure the relative level of uracil (see Materials and methods; Horváth and Vértessy, 2010). (B) Experimental layout. In vitro–activated B lymphocytes were arrested with nocodazole 42 h after stimulation. 6 h later, nocodazole was removed and B cells were collected for analysis at different time points. (C) DAPI staining for DNA content at the indicated time points upon nocodazole release. Red, the sorted populations for experiments in Fig. 2 D and Fig. S2 (E and F). Upon release, B cells were still mainly in M phase at 0.5 h, whereas the released G1 population increased to ∼40% at 1.5 h (early G1) and 60% at 4 h (middle G1). At 6 h, some cells entered S phase, and 30% were still in G1 (late G1). (D) Relative uracil levels at the antibody 5′-Sμ region, as determined by Uracil-qPCR (see Materials and methods). AID-proficient and -deficient cells are compared. Error bars, SEM; *, P < 0.01, two-tailed Student t test. Three independent experiments are shown. (E) Diagram of the sorting strategy for the analysis of G1, S, G2, and M cells. In vitro–activated B cells at different cell cycle stages were sorted according to phospho-Histone H3 (Ser10) and DNA content (DAPI). (F) The relative uracil levels at 5′-Sμ at different cell cycle stages were determined by Uracil-qPCR in WT and UNG-deficient B cells. One experiment is shown.
Figure 3.
Figure 3.
AID-induced deamination at antibody switch region is restricted to early G1. (A and B) Prolonged staying in M phase upon nocodazole release does not significantly increase the level of AID-induced mutations. (A) Cell cycle distribution of In vitro–cultured B lymphocytes at different time points upon nocodazole release. Cells in M, cytokinesis, and G1 are resolved by combining DNA fluorescence peak (DAPI-H) and intensity (DAPI-A; Gasnereau et al., 2007). Insets show DAPI-A profiles only. Nocodazole-treated cells were collected at 0, 1, and 2 h after release. In red are the sorted cell populations analyzed in Fig. 3 B. (B) Mutation rates at 5′-Sμ, as determined by MutPE-Seq. Red, blue, and gray represent C-to-T, G-to-A, and all other mutations, respectively. n.s., nonsignificant, one-tailed bootstrap test. One experiment is shown. (C) Nocodazole-treated cells were collected at 0, 1, and 5 h after release for mutational analysis with Pfu-Cx. Red, the sorted cell populations analyzed in D and E. (D and E) Mutation frequencies at 5′-Sμ are shown as a histogram (D) or at single-nucleotide resolution (E). The numbers in the rectangles indicate the overall mutation rate. Red, blue, and black represent C-to-T, G-to-A, and all other mutations, respectively. n.s., nonsignificant; **, P < 0.01, one-tailed bootstrap test. Two independent experiments were performed.
Figure 4.
Figure 4.
Convergent transcription is detected at Igh switch regions in early G1 cells. (A) Experimental layout of the double-sorting strategy to isolate live early G1 cells. After 6-h nocodazole treatment, the Fucci-EGFP+ B cells (mostly M phase) were sorted and replated in nocodazole-free medium for 1.5 h. After the second sort, EGFP small cells (mostly early G1) were purified (see Materials and methods). (B) FACS analysis of the double-sorting strategy. At each step, a small aliquot of cells was fixed and stained with DAPI (quality control, #1–#5). G1, G2/M, and late M populations (including cells in cytokinesis) are indicated on the representative plots. (C) GRO-Seq and convergent transcription (ConvT) profiles at the Igh locus in early G1 cells. Sense (light blue) and antisense transcription (dark blue) are displayed. ConvT regions are shown as green bars, and the numbers indicate the levels of ConvT, which were calculated by the geometric means of sense and antisense transcription reads as described previously (Meng et al., 2014). The arrow shows the direction of sense transcription. Two independent experiments were performed.
Figure 5.
Figure 5.
Extended presence of AID in the nucleus causes more mutations. (A) Relative mutation rates at 5′-Sμ, AID off-target sites (Cd83, Pax5, Apobec3, Ly6e, and Il4ra), and non-AID targets (Cμ, Cγ1, and Cd3e), revealed by MutPE-Seq. *, P < 0.05; **, P < 0.01, one-tailed bootstrap test. Two independent experiments were performed. (B) Proposed model. AID induces deamination at the Igh gene only during a short time window in early G1. Before then, although AID has spatial contact with chromosomes after breakdown of the nuclear envelope (NE), chromosomal DNA is condensed and not available for deamination. Shortly thereafter, AID is quickly exported into the cytoplasm by Crm1-mediated nuclear export. During the rest of the cell cycle, AID is cytoplasmic and no significant AID activity is detected. Therefore, this limited time window for AID to induce deamination is the combined consequence of transient nuclear residence of AID and the recovered transcription in the early G1 phase. The AID-induced uracil in this short time period is processed in G1 to enable SHM and CSR.

References

    1. Alt F.W., Zhang Y., Meng F.L., Guo C., and Schwer B.. 2013. Mechanisms of programmed DNA lesions and genomic instability in the immune system. Cell. 152:417–429. 10.1016/j.cell.2013.01.007 - DOI - PMC - PubMed
    1. Anderson D.J., and Hetzer M.W.. 2007. Nuclear envelope formation by chromatin-mediated reorganization of the endoplasmic reticulum. Nat. Cell Biol. 9:1160–1166. 10.1038/ncb1636 - DOI - PubMed
    1. Casellas R., Basu U., Yewdell W.T., Chaudhuri J., Robbiani D.F., and Di Noia J.M.. 2016. Mutations, kataegis and translocations in B cells: understanding AID promiscuous activity. Nat. Rev. Immunol. 16:164–176. 10.1038/nri.2016.2 - DOI - PMC - PubMed
    1. Chaudhuri J., Tian M., Khuong C., Chua K., Pinaud E., and Alt F.W.. 2003. Transcription-targeted DNA deamination by the AID antibody diversification enzyme. Nature. 422:726–730. 10.1038/nature01574 - DOI - PubMed
    1. Crouch E.E., Li Z., Takizawa M., Fichtner-Feigl S., Gourzi P., Montaño C., Feigenbaum L., Wilson P., Janz S., Papavasiliou F.N., and Casellas R.. 2007. Regulation of AID expression in the immune response. J. Exp. Med. 204:1145–1156. 10.1084/jem.20061952 - DOI - PMC - PubMed

Publication types

Substances