

CymeR: cytometry analysis using KNIME, docker and R
- PMID: 27998935
- PMCID: PMC5870801
- DOI: 10.1093/bioinformatics/btw707
CymeR: cytometry analysis using KNIME, docker and R
Abstract
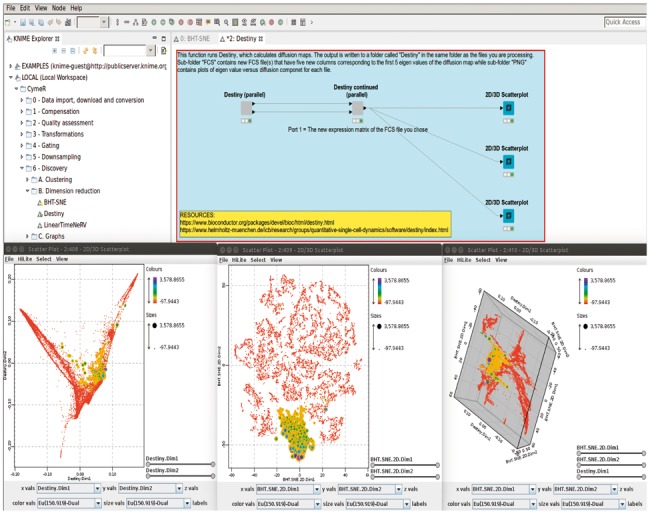
Summary: Here we present open-source software for the analysis of high-dimensional cytometry data using state of the art algorithms. Importantly, use of the software requires no programming ability, and output files can either be interrogated directly in CymeR or they can be used downstream with any other cytometric data analysis platform. Also, because we use Docker to integrate the multitude of components that form the basis of CymeR, we have additionally developed a proof-of-concept of how future open-source bioinformatic programs with graphical user interfaces could be developed.
Availability and implementation: CymeR is open-source software that ties several components into a single program that is perhaps best thought of as a self-contained data analysis operating system. Please see https://github.com/bmuchmore/CymeR/wiki for detailed installation instructions.
Contact: brian.muchmore@genyo.es or marta.alarcon@genyo.es.
© The Author 2016. Published by Oxford University Press.
Figures
References
-
- Angerer P. et al. (2015) Destiny: diffusion maps for large-scale single-cell data in R. Bioinformatics, 25, 2078–2079. - PubMed
-
- Becher B. et al. (2014) High-dimensional analysis of the murine myeloid cell system. Nat. Immunol., 12, 1181–1189. - PubMed
-
- Berthold M.R. et al. (2008) KNIME: the Konstanz information miner In: Preisach C., et al (eds.) Data Analysis, Machine Learning and Applications: Studies in Classification, Data Analysis, and Knowledge Organization, vol. 1 Springer, Berlin, Heidelberg, pp. 319–326.
-
- Chen T.J. et al. (2014) Cytobank: providing an analytics platform for community cytometry data analysis and collaboration. Curr. Top. Microbiol. Immunol., 377, 127–157. - PubMed
MeSH terms
LinkOut - more resources
Full Text Sources
Other Literature Sources
