. 2017 Jan 31;8(5):7740-7752.
doi: 10.18632/oncotarget.13946.

Leptin-Notch signaling axis is involved in pancreatic cancer progression

Affiliations

Leptin-Notch signaling axis is involved in pancreatic cancer progression

Adriana Harbuzariu et al. Oncotarget. .

Abstract

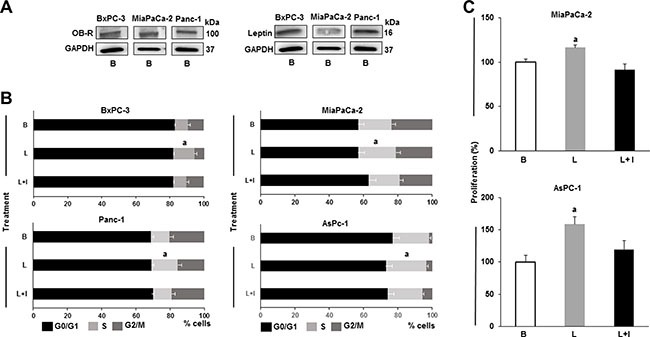
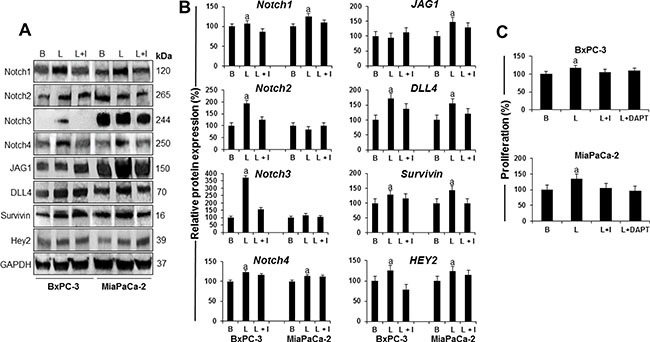
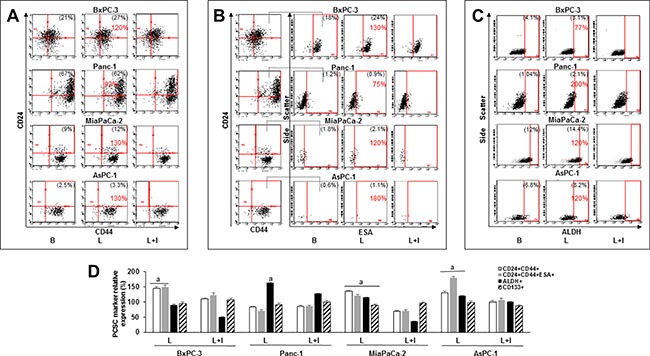
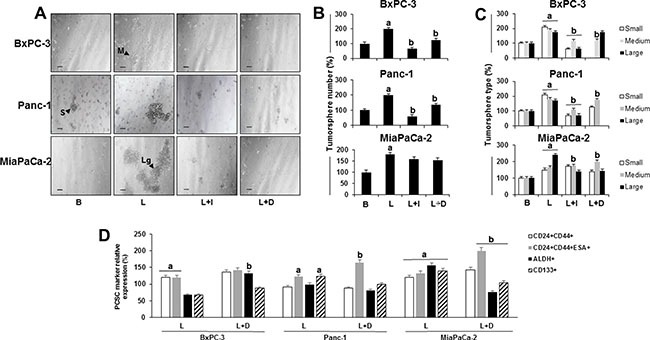
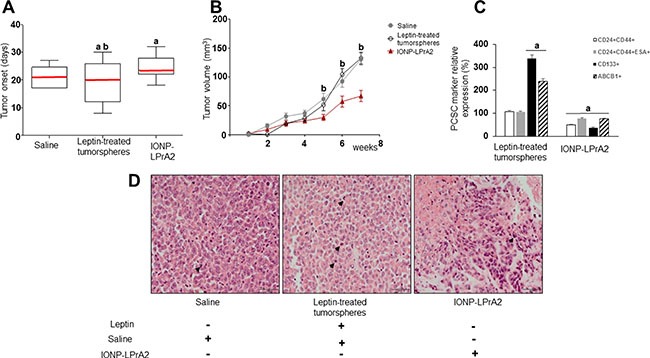
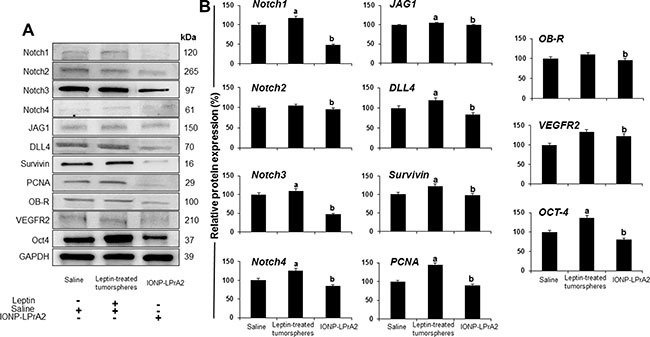
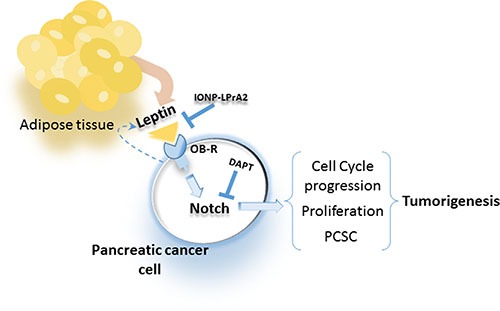
Pancreatic cancer (PC) shows a high death rate. PC incidence and prognosis are affected by obesity, a pandemic characterized by high levels of leptin. Notch is upregulated by leptin in breast cancer. Thus, leptin and Notch crosstalk could influence PC progression. Here we investigated in PC cell lines (BxPC-3, MiaPaCa-2, Panc-1, AsPC-1), derived tumorspheres and xenografts whether a functional leptin-Notch axis affects PC progression and expansion of pancreatic cancer stem cells (PCSC). PC cells and tumorspheres were treated with leptin and inhibitors of Notch (gamma-secretase inhibitor, DAPT) and leptin (iron oxide nanoparticle-leptin peptide receptor antagonist 2, IONP-LPrA2). Leptin treatment increased cell cycle progression and proliferation, and the expression of Notch receptors, ligands and targeted molecules (Notch1-4, DLL4, JAG1, Survivin and Hey2), PCSC markers (CD24/CD44/ESA, ALDH, CD133, Oct-4), ABCB1 protein, as well as tumorsphere formation. Leptin-induced effects on PC and tumorspheres were decreased by IONP-LPrA2 and DAPT. PC cells secreted leptin and expressed the leptin receptor, OB-R, which indicates a leptin autocrine/paracrine signaling loop could also affect tumor progression. IONP-LPrA2 treatment delayed the onset of MiaPaCa-2 xenografts, and decreased tumor growth and the expression of proliferation and PCSC markers. Present data suggest that leptin-Notch axis is involved in PC. PC has no targeted therapy and is mainly treated with chemotherapy, whose efficiency could be decreased by leptin and Notch activities. Thus, the leptin-Notch axis could be a novel therapeutic target, particularly for obese PC patients.

Keywords: Notch; leptin; leptin peptide receptor antagonist LPrA2; pancreatic cancer; pancreatic cancer stem cells.


Conflict of interest statement

CONFLICTS OF INTEREST

The authors declare no potential conflicts of interest.

Figures

Figure 1
Figure 1. Leptin is a proliferator factor for PC cells
(A) Leptin and leptin receptor (OB-R) are expressed in PC cells. Representative western blot results for leptin and OB-R expression. (B) Leptin induces PC cell S-phase progression. (C) Leptin induces PC cell proliferation. Whole cell lysates were analyzed by western blot. GAPDH was used as protein loading control. Cell cycle progression was measured by image cytometry. Cell proliferation was assessed using Vybrant MTT assay kit. PC cells (B×PC-3, MiaPaCa-2, Panc-1 and AsPC-1) were cultured in medium containing leptin and IONP-LPrA2. Basal condition (untreated) was used as control (100%). Effects of treatments on cell cycle progression and proliferation were expressed as % of control. Data are representative from three independent experiments; a: p ≤ 0.05 compared to basal condition. B = basal; L = leptin (1.2 nM); L+I = leptin (1.2 nM) + IONP-LPrA2 (0.0036 pM).
Figure 2
Figure 2. Leptin-induced Notch is linked to proliferation of PC cells
(A) Representative western blot results of leptin induction of Notch receptors, ligands and targeted molecules in PC cells. (B) Quantitative analysis of leptin-induced effects on Notch, ligands and targets. (C) Effects of DAPT (a gamma secretase inhibitor) and IONP-LPrA2 (a leptin signaling inhibitor) on leptin-induced proliferation of PC cells. BxPC-3 and MiaPaCa-2 cells were treated with leptin and IONP-LPrA2 for 24 hours. Whole cell lysates were analyzed by western blot. GAPDH was used as protein loading control. Proliferation was determined by MTT assay. PC cells were treated with leptin, IONP-LPrA2 and DAPT for 24 h. Basal (untreated) condition was used as control (100%). Data are expressed as % of control and represent at least three independent experiments. B = basal; L = leptin (1.2 nM); I = IONP-LPrA2 (0.0036 pM); L+I = leptin (1.2 nM) + IONP-LPrA2 (0.0036 pM); L+DAPT = leptin(1.2 nM) + DAPT (20 μM); a: p ≤ 0.05 compared to basal condition.
Figure 3
Figure 3. Leptin increases PC stem cell (PCSC) populations
Representative dot plots of PC cells expressing (A) CD24+CD44+, (B) CD24+CD44+ESA+ and (C) ALDH+. (D) Relative expression of CD24+CD44+, CD24+CD44+ESA+, ALDH+ and CD133+ in PC cell lines. PC cells were cultured in medium containing leptin and IONP-LPrA2 for 24 hours (AsPC-1), 48 hours (Panc-1) and 72 hours (BxPC-3 and MiaPaCa-2). The expression of PCSC markers was determined by flow cytometry analysis. Basal condition (untreated) was used as control (100%). Effects of treatments on PCSC were expressed as % of control. Percent of positive cells for the PCSC markers is shown in parenthesis in basal and leptin-treated conditions. Percent of change compared to basal is shown in red. All experiments were performed in triplicate. B = basal; L = leptin (1.2 nM); L+I = leptin (1.2 nM) + IONP-LPrA2 (0.0036 pM IONP); a: p ≤ 0.05 compared to control.
Figure 4
Figure 4. Effects of leptin and Notch on number and size of primary tumorspheres and PC stem cells (PCSC)
(A) Representative images of tumorspheres (scale bar = 60 μm) (B) Number of PC tumorspheres (C) Number of PC tumorspheres by size (D) Relative expression of PCSC markers in cells from PC tumorspheres. BxPC-3, Panc-1 and MiaPaCa-2 cells (20,000 cells/well in low attachment plates) were cultured in Mammocult medium containing leptin, IONP-LPrA2 and DAPT (γ-secretase inhibitor-GSI) for 1 week. Tumorsphere number and size were determined under microscope and PCSC markers were assessed by flow cytometry analysis. Basal condition (untreated) was used as control (100%). Effects of treatment on tumorspheres and PCSC markers was expressed as % of control. All experiments were performed in triplicate. a:p ≤ 0.05 when compared to control; b: p ≤ 0.05 when compared to leptin. B = basal; L = leptin (1.2 nM); L+I = leptin (1.2 nM) + IONP-LPrA2 (0.0036 pM); L+D = leptin (1.2 nM) + DAPT (20 μM); S = small tumorsphere; M = medium tumorsphere; Lg = large tumorsphere.
Figure 5
Figure 5. Leptin induces PC xenograft onset, growth and cancer stem cells (PCSC)
(A) PC xenograft onset (B) PC xenograft growth (C) Relative expression of PCSC markers in PC xenografts (D) PC xenograft histology. H&E stained tumor sections after 7 weeks of treatment. One representative tumor specimen is presented; black arrow heads point to PC cells in mitosis. Immunocompromised mice (n = 21) were implanted in their flanks with MiaPaCa-2 cells (5,000 cells/matrigel 1:1) obtained from tumorspheres cultured in basal medium (n = 14) or containing leptin (1.2 nM; n = 7). The mice implanted with PC cells cultured in basal medium were treated with saline (sham control; n = 7) or IONP-LPrA2 (50 μl/0.0036 pM; n = 7) twice per week for 7 weeks. Mice implanted with cells from leptin-treated tumorspheres received saline (n = 7). Mean values of tumor onset in the treatment groups are represented by a red line. PCSC markers were determined by flow cytometry analysis. Mice treated with saline were used as control (100%). Effects of treatment on PCSC markers were expressed as % of control. All experiments were performed in triplicate. a:p ≤ 0.05 compared to saline; b:p ≤ 0.05 compared to IONP-LPrA2.
Figure 6
Figure 6. Inhibition of leptin signaling reduces the expression of Notch and related molecules in PC xenografts
(A) Representative western blot results of PC xenografts. (B) Quantitative determination of tumor proteins. Immunocompromised mice (n = 21) were implanted in their flanks with MiaPaCa-2 cells (5,000 cells/matrigel 1:1) obtained from tumorspheres cultured in basal medium (n = 14) or containing leptin (1.2 nM; n = 7). The mice implanted with PC tumorspheres cultured in basal medium were treated with saline (sham control; n = 7) or IONP-LPrA2 (50 μl/0.0036 pM; n = 7) twice per week for 7 weeks. Mice implanted with cells from leptin-treated tumorspheres received saline (n = 7). Tumors were harvested and used to obtain protein lysates that were analyzed by western blot. GAPDH was used as protein loading control. Mice treated with saline were used as control (100%). Effects of treatment on the expression of Notch and related molecules were determined as % of control. a: p ≤ 0.05 compared to saline; b: p ≤ 0.05 compared to leptin.
Figure 7
Figure 7. Leptin secreted from adipose tissue and PC cells binds to OB-R that increases Notch expression, cell cycle progression, proliferation and PCSC, which increase tumorigenesis
Blockade of leptin signaling via IONP-LPrA2 or inhibition of Notch via gamma-secretase inhibitor (DAPT) reduces leptin actions on PC cells.

References

    1. Becker AE, Hernandez YG, Frucht H, Lucas AL. Pancreatic ductal adenocarcinoma: risk factors, screening, and early detection. World J Gastroenterol. 2014;20:11182–198. - PMC - PubMed
    1. American Cancer Society. Cancer facts & Figures. 2016. http://www.cancer.org/acs/groups/content/@research/documents/document/ac...
    1. Yadav D, Lowenfels AB. The epidemiology of pancreatitis and pancreatic cancer. Gastroenterology. 2013;144:1252–61. - PMC - PubMed
    1. Amundadottir L, Kaft P, Stolzenberg-Solomon RZ, Fuchs CS, Petersen GM, Arslan AA, H Bas Bueno-de-Mesquita, Gross M, Helzlsouer K, Jacobs EJ, LaCroix A, Zheng W, Albanes D, et al. Genome-wide association study identifies variants in the ABO locus associated with susceptibility to pancreatic cancer. Nat Genet. 2009;41:986–90. - PMC - PubMed
    1. Calle EE, Rodriguez C, Walker-Thurmond K, Thun MJ. Overweight, obesity and mortality from cancer in a prospectively studied cohort of U.S. adults. N Engl J Med. 2003;348:1625–38. - PubMed

MeSH terms