

Metabolomic Approaches to Explore Chemical Diversity of Human Breast-Milk, Formula Milk and Bovine Milk
- PMID: 27999311
- PMCID: PMC5187928
- DOI: 10.3390/ijms17122128
Metabolomic Approaches to Explore Chemical Diversity of Human Breast-Milk, Formula Milk and Bovine Milk
Abstract
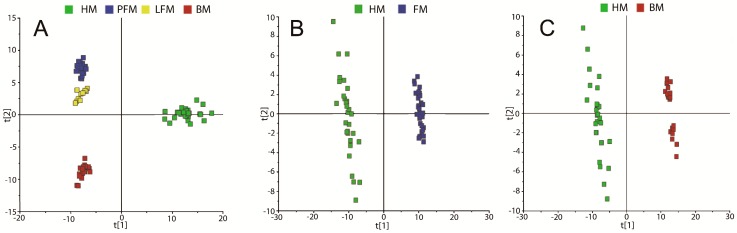
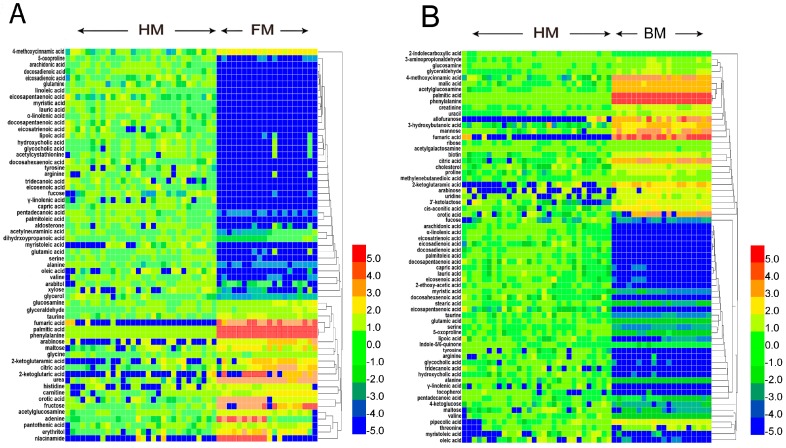
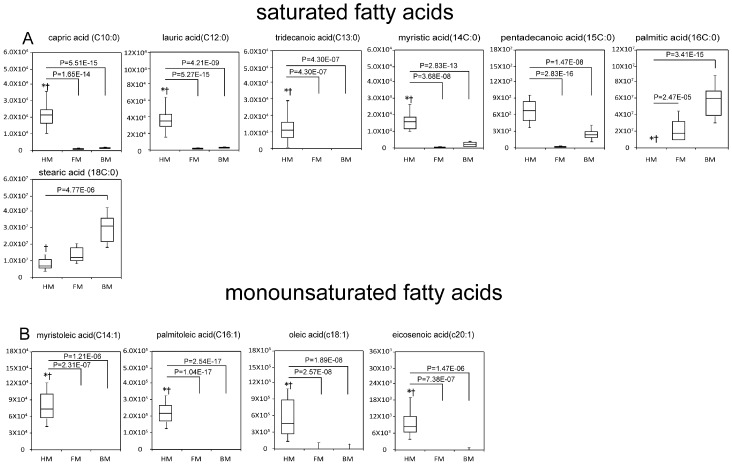
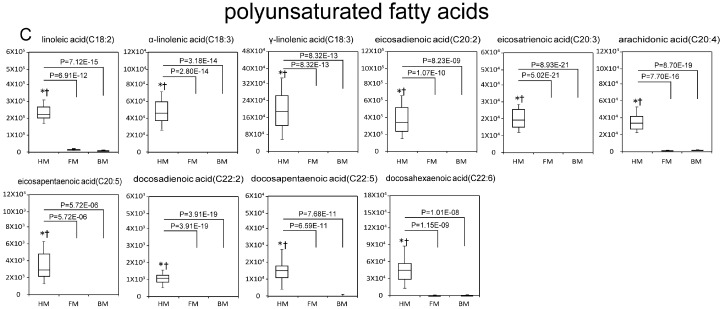
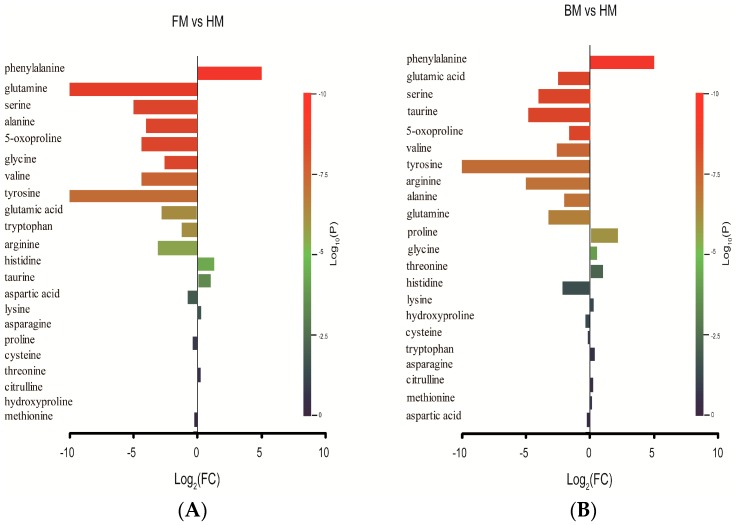
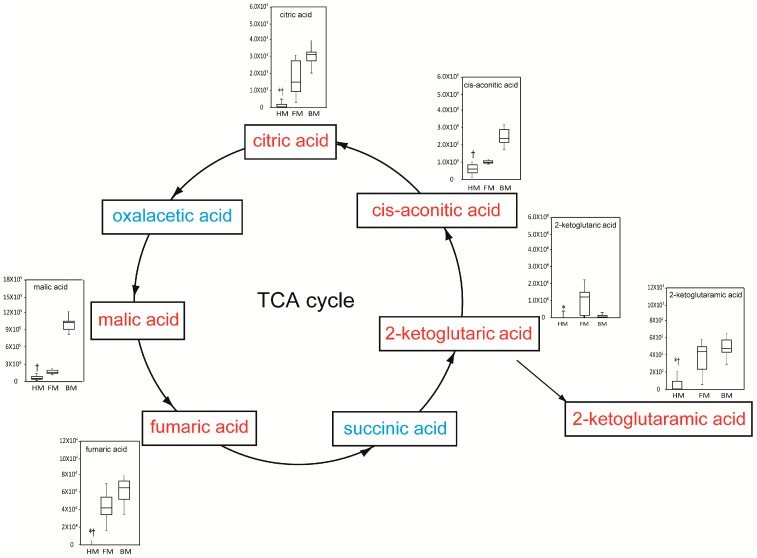
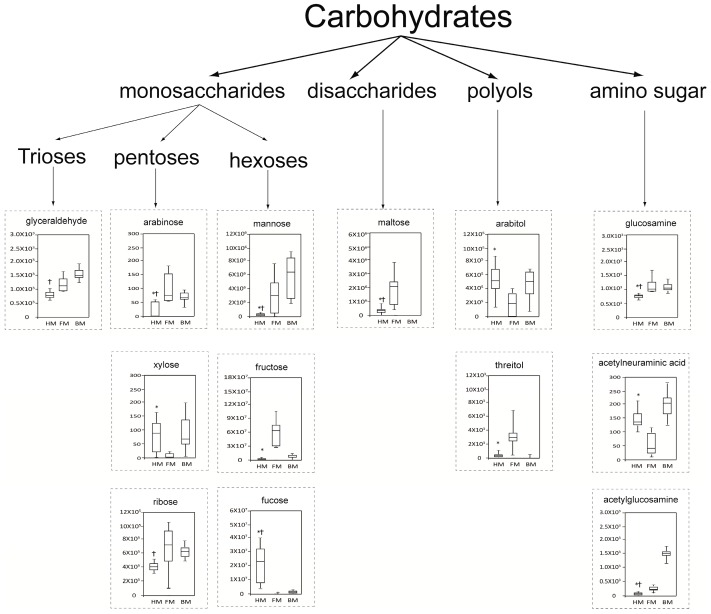
Although many studies have been conducted on the components present in human breast milk (HM), research on the differences of chemical metabolites between HM, bovine milk (BM) and formula milk (FM) is limited. This study was to explore the chemical diversity of HM, BM and FM by metabolomic approaches. GC-TOFMS and UPLC-QTOFMS were applied to investigate the metabolic compositions in 30 HM samples, 20 FM samples and 20 BM samples. Metabolite profiling identified that most of the non-esterified fatty acids, which reflected the hydrolysis of triglycerides, were much more abundant in HM than those in FM and BM, except for palmitic acid and stearic acid. The levels of tricarboxylic acid (TCA) intermediates were much higher in FM and BM than those in HM. Each type of milk also showed its unique composition of free amino acids and free carbohydrates. In conclusion, higher levels of non-esterified saturated fatty acids with aliphatic tails <16 carbons, monounsaturated fatty acids and polyunsaturated fatty acids and lower levels of TCA intermediates are characteristic of HM, as compared with FM and BM. The content of non-esterified fatty acids may reflect the hydrolysis of triglycerides in different milk types.
Keywords: GC-TOFMS; UPLC-QTOFMS; amino acids; carbohydrate; fatty acids; metabolomics; tricarboxylic acid intermediates.
Conflict of interest statement
The authors declare that they have no competing interests.
Figures
Similar articles
-
Comparison of free fatty acid content of human milk from Taiwanese mothers and infant formula.Taiwan J Obstet Gynecol. 2013 Dec;52(4):527-33. doi: 10.1016/j.tjog.2013.10.013. Taiwan J Obstet Gynecol. 2013. PMID: 24411038
-
Comparative Lipidomic Study of Human Milk from Different Lactation Stages and Milk Formulas.Nutrients. 2020 Jul 21;12(7):2165. doi: 10.3390/nu12072165. Nutrients. 2020. PMID: 32708300 Free PMC article.
-
Triglycerides, fatty acids, sterols, mono- and disaccharides and sugar alcohols in human milk and current types of infant formula milk.Eur J Clin Nutr. 1996 Apr;50(4):255-60. Eur J Clin Nutr. 1996. PMID: 8730614
-
Metabolomic Insights into the Effects of Breast Milk Versus Formula Milk Feeding in Infants.Curr Nutr Rep. 2019 Sep;8(3):295-306. doi: 10.1007/s13668-019-00284-2. Curr Nutr Rep. 2019. PMID: 31203566 Review.
-
Clinical insights gained through metabolomic analysis of human breast milk.Expert Rev Proteomics. 2019 Nov-Dec;16(11-12):909-932. doi: 10.1080/14789450.2019.1703679. Epub 2019 Dec 12. Expert Rev Proteomics. 2019. PMID: 31825672 Review.
Cited by
-
Neonatal Mouse Gut Metabolites Influence Cryptosporidium parvum Infection in Intestinal Epithelial Cells.mBio. 2020 Dec 15;11(6):e02582-20. doi: 10.1128/mBio.02582-20. mBio. 2020. PMID: 33323514 Free PMC article.
-
Metabolic impact of infant formulas in young infants. An outlook from the urine metabolome.Heliyon. 2022 Aug 28;8(9):e10432. doi: 10.1016/j.heliyon.2022.e10432. eCollection 2022 Sep. Heliyon. 2022. PMID: 36119867 Free PMC article.
-
Interrogating the role of the milk microbiome in mastitis in the multi-omics era.Front Microbiol. 2023 Feb 2;14:1105675. doi: 10.3389/fmicb.2023.1105675. eCollection 2023. Front Microbiol. 2023. PMID: 36819069 Free PMC article. Review.
-
Metabolic profiling by gas chromatography-mass spectrometry of energy metabolism in high-fat diet-fed obese mice.PLoS One. 2017 May 16;12(5):e0177953. doi: 10.1371/journal.pone.0177953. eCollection 2017. PLoS One. 2017. PMID: 28520815 Free PMC article.
-
Innate Immunity and Breast Milk.Front Immunol. 2017 May 29;8:584. doi: 10.3389/fimmu.2017.00584. eCollection 2017. Front Immunol. 2017. PMID: 28611768 Free PMC article. Review.
References
-
- Binns C.W., Lee M.K. Exclusive breastfeeding for six months: The WHO six months recommendation in the Asia Pacific Region. Asia Pac. J. Clin. Nutr. 2014;23:344–350. - PubMed
-
- Quigley M., McGuire W. Formula versus donor breast milk for feeding preterm or low birth weight infants. Cochrane Database Syst. Rev. 2014;4:CD002971 - PubMed
MeSH terms
Substances
Grants and funding
LinkOut - more resources
Full Text Sources
Other Literature Sources
Medical
Miscellaneous
