. 2017 Jun;26(3):379-387.
doi: 10.1007/s12028-016-0335-x.

Association of Early Hemodynamic Profile and the Development of Systolic Dysfunction Following Traumatic Brain Injury

Affiliations

Association of Early Hemodynamic Profile and the Development of Systolic Dysfunction Following Traumatic Brain Injury

Vijay Krishnamoorthy et al. Neurocrit Care. 2017 Jun.

Abstract

Background: While systolic dysfunction has been observed following traumatic brain injury (TBI), the relationship between early hemodynamics and the development of systolic dysfunction has not been investigated. Our study aimed to determine the early hemodynamic profile that is associated with the development of systolic dysfunction after TBI.

Methods: We conducted a prospective cohort study among patients under 65 years old without cardiac comorbidities who sustained moderate-severe TBI. Transthoracic echocardiography was performed within the first day after TBI to assess for systolic dysfunction. Hourly systolic blood pressure (SBP), mean arterial pressure (MAP), heart rate, and confounding clinical variables (sedatives, fluid balance, vasopressors, and osmotherapy) were collected during the first 24 h following admission. Multivariable linear mixed models assessed the early hemodynamic profile in patients who developed systolic dysfunction, compared to patients who did not develop systolic dysfunction.

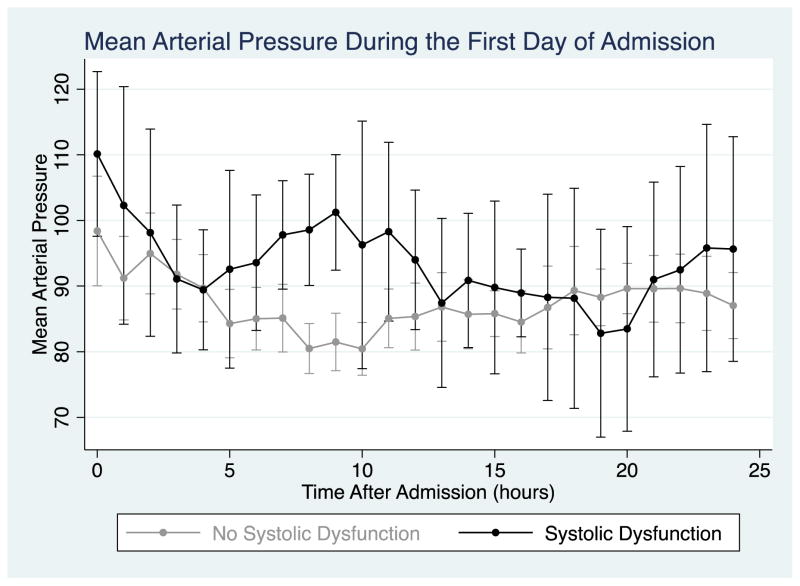
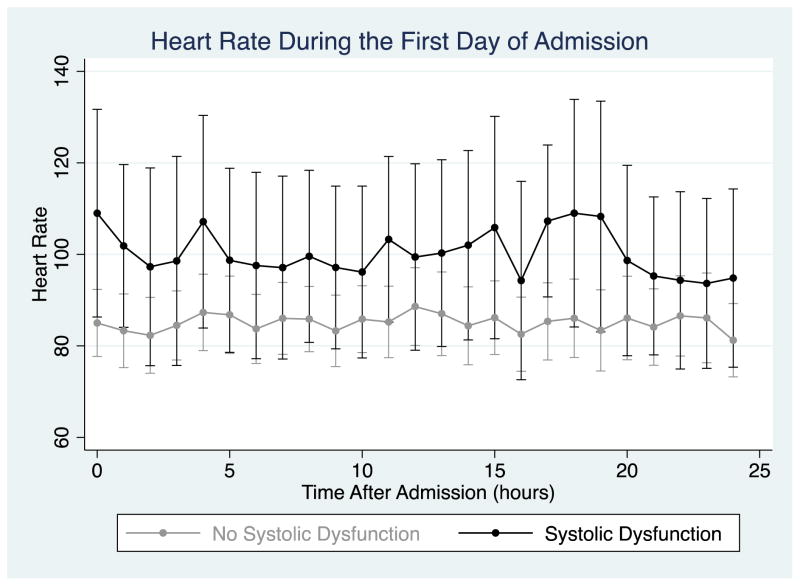
Results: Thirty-two patients were included, and 7 (22 %) developed systolic dysfunction after TBI. Patients who developed systolic dysfunction experienced early elevation of SBP, MAP, and heart rate, compared to patients who did not develop systolic dysfunction (p < 0.01 for all comparisons). Patients who developed systolic dysfunction experienced a greater rate of decrease in SBP [-10.2 mmHg (95 % CI -16.1, -4.2)] and MAP [-9.1 mmHg (95 % CI -13.9, -4.3)] over the first day of hospitalization, compared to patients who did not develop systolic dysfunction (p < 0.01 for both comparisons). All sensitivity analyses revealed no substantial changes from the primary model.

Conclusions: Patients who develop systolic dysfunction following TBI have a distinctive hemodynamic profile, with early hypertension and tachycardia, followed by a decrease in blood pressure over the first day after TBI. This profile suggests an early maladaptive catecholamine-excess state as a potential underlying mechanism of TBI-induced systolic dysfunction.

Keywords: Echocardiography; Hemodynamics; Stress cardiomyopathy; Trauma; Traumatic brain injury.


Conflict of interest statement

Conflicts of Interest: None

Figures

Figure 1
Figure 1
Figure 1a: Unadjusted Systolic Blood Pressure Trajectory Over 24 Hours Following Admission for Moderate-Severe Traumatic Brain Injurya aIn above figure, circles represent mean values of adjusted systolic blood pressure and whiskers represent the 95% confidence interval Figure 1b: Adjusted Systolic Blood Pressure Trajectory Over 24 Hours Following Admission for Moderate-Severe Traumatic Brain Injurya,b aIn above figure, circles represent mean values of adjusted systolic blood pressure and whiskers represent the 95% confidence interval bAdjusted for age, gender, GCS, fluid balance, sedation, vasopressor use, osmotherapy, need for surgery
Figure 1
Figure 1
Figure 1a: Unadjusted Systolic Blood Pressure Trajectory Over 24 Hours Following Admission for Moderate-Severe Traumatic Brain Injurya aIn above figure, circles represent mean values of adjusted systolic blood pressure and whiskers represent the 95% confidence interval Figure 1b: Adjusted Systolic Blood Pressure Trajectory Over 24 Hours Following Admission for Moderate-Severe Traumatic Brain Injurya,b aIn above figure, circles represent mean values of adjusted systolic blood pressure and whiskers represent the 95% confidence interval bAdjusted for age, gender, GCS, fluid balance, sedation, vasopressor use, osmotherapy, need for surgery
Figure 2
Figure 2
Figure 2a: Unadjusted Mean Arterial Pressure Trajectory Over 24 Hours Following Admission for Moderate-Severe Traumatic Brain Injurya aIn above figure, circles represent mean values of adjusted mean arterial pressure and whiskers represent the 95% confidence interval Figure 2b: Adjusted Mean Arterial Pressure Trajectory Over 24 Hours Following Admission for Moderate-Severe Traumatic Brain Injurya,b aIn above figure, circles represent mean values of adjusted mean arterial pressure and whiskers represent the 95% confidence interval bAdjusted for age, gender, GCS, fluid balance, sedation, vasopressor use, osmotherapy, need for surgery
Figure 2
Figure 2
Figure 2a: Unadjusted Mean Arterial Pressure Trajectory Over 24 Hours Following Admission for Moderate-Severe Traumatic Brain Injurya aIn above figure, circles represent mean values of adjusted mean arterial pressure and whiskers represent the 95% confidence interval Figure 2b: Adjusted Mean Arterial Pressure Trajectory Over 24 Hours Following Admission for Moderate-Severe Traumatic Brain Injurya,b aIn above figure, circles represent mean values of adjusted mean arterial pressure and whiskers represent the 95% confidence interval bAdjusted for age, gender, GCS, fluid balance, sedation, vasopressor use, osmotherapy, need for surgery
Figure 3
Figure 3
Figure 3a: Unadjusted Heart Rate Trajectory Over 24 Hours Following Admission for Moderate-Severe TBIa aIn above figure, circles represent mean values of adjusted heart rate and whiskers represent the 95% confidence interval Figure 3b: Adjusted Heart Rate Trajectory Over 24 Hours Following Admission for Moderate-Severe TBIa,b aIn above figure, circles represent mean values of adjusted heart rate and whiskers represent the 95% confidence interval bAdjusted for age, gender, GCS, fluid balance, sedation, vasopressor use, osmotherapy, need for surgery
Figure 3
Figure 3
Figure 3a: Unadjusted Heart Rate Trajectory Over 24 Hours Following Admission for Moderate-Severe TBIa aIn above figure, circles represent mean values of adjusted heart rate and whiskers represent the 95% confidence interval Figure 3b: Adjusted Heart Rate Trajectory Over 24 Hours Following Admission for Moderate-Severe TBIa,b aIn above figure, circles represent mean values of adjusted heart rate and whiskers represent the 95% confidence interval bAdjusted for age, gender, GCS, fluid balance, sedation, vasopressor use, osmotherapy, need for surgery

References

    1. Rutland-Brown W, Langlois JA, Thomas KE, Xi YL. Incidence of traumatic brain injury in the United States, 2003. J Head Trauma Rehabil. 2006;21:544–8. - PubMed
    1. Prathep S, Sharma D, Hallman M, et al. Preliminary report on cardiac dysfunction after isolated traumatic brain injury. Crit Care Med. 2014;42:142–7. - PMC - PubMed
    1. Bybee KA, Prasad A. Stress-related cardiomyopathy syndromes. Circulation. 2008;118:397–409. - PubMed
    1. Meng L, Hou W, Chui J, Han R, Gelb AW. Cardiac Output and Cerebral Blood Flow: The Integrated Regulation of Brain Perfusion in Adult Humans. Anesthesiology. 2015;123:1198–208. - PubMed
    1. Zafar SN, Millham FH, Chang Y, et al. Presenting blood pressure in traumatic brain injury: a bimodal distribution of death. J Trauma. 2011;71:1179–84. - PubMed

LinkOut - more resources