. 2016 Dec 21:7:13781.
doi: 10.1038/ncomms13781.

A cell-autonomous tumour suppressor role of RAF1 in hepatocarcinogenesis

Affiliations

A cell-autonomous tumour suppressor role of RAF1 in hepatocarcinogenesis

Ines Jeric et al. Nat Commun. .

Abstract

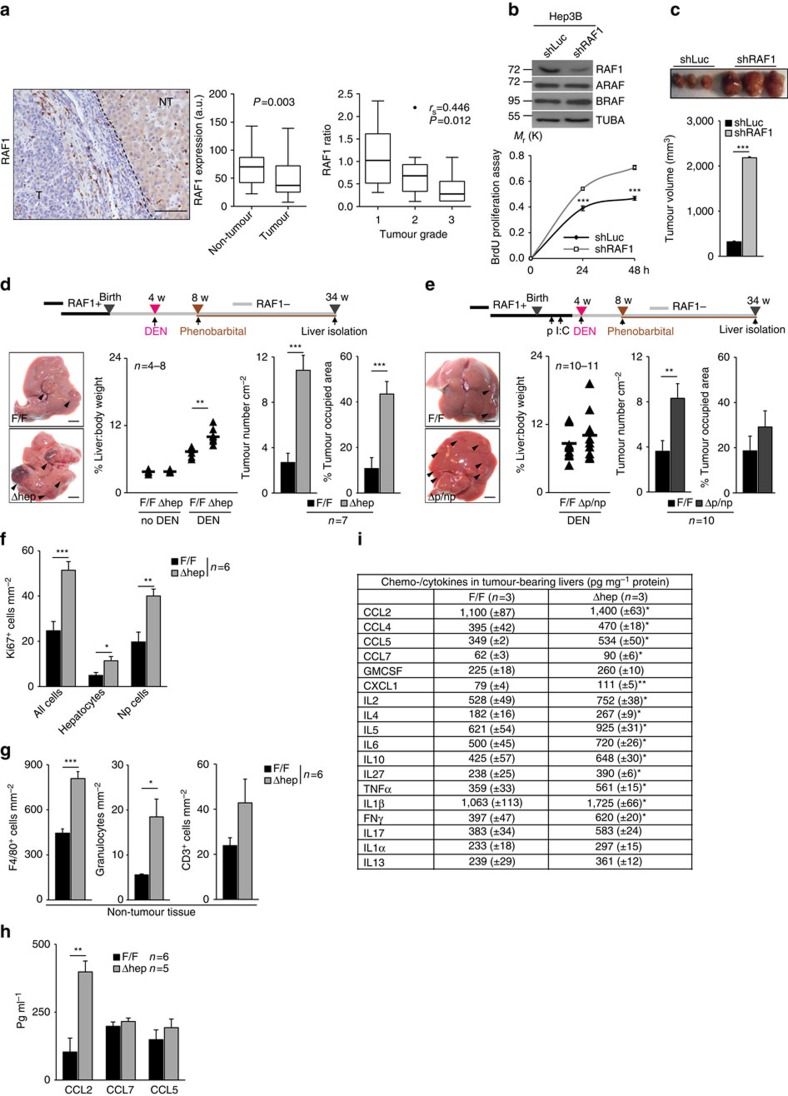
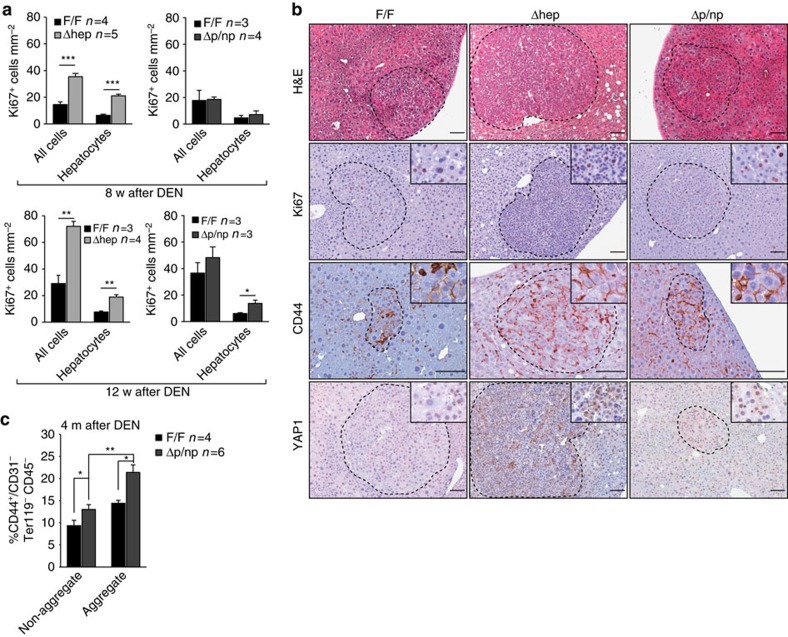
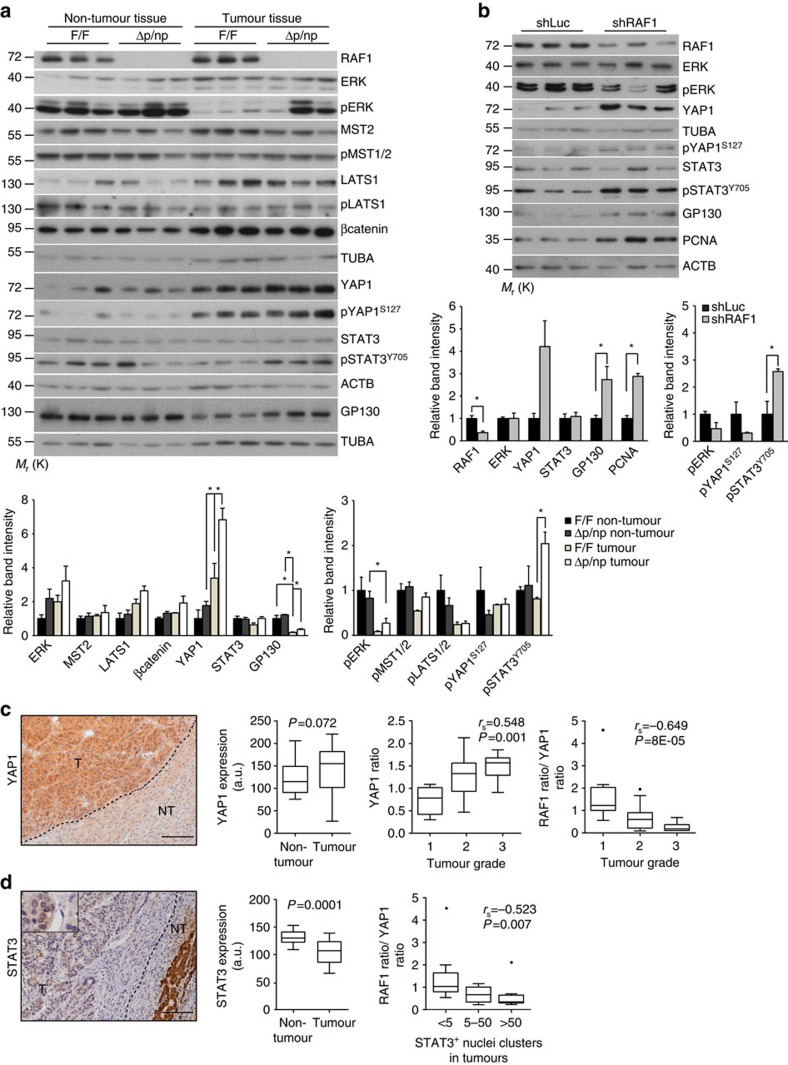
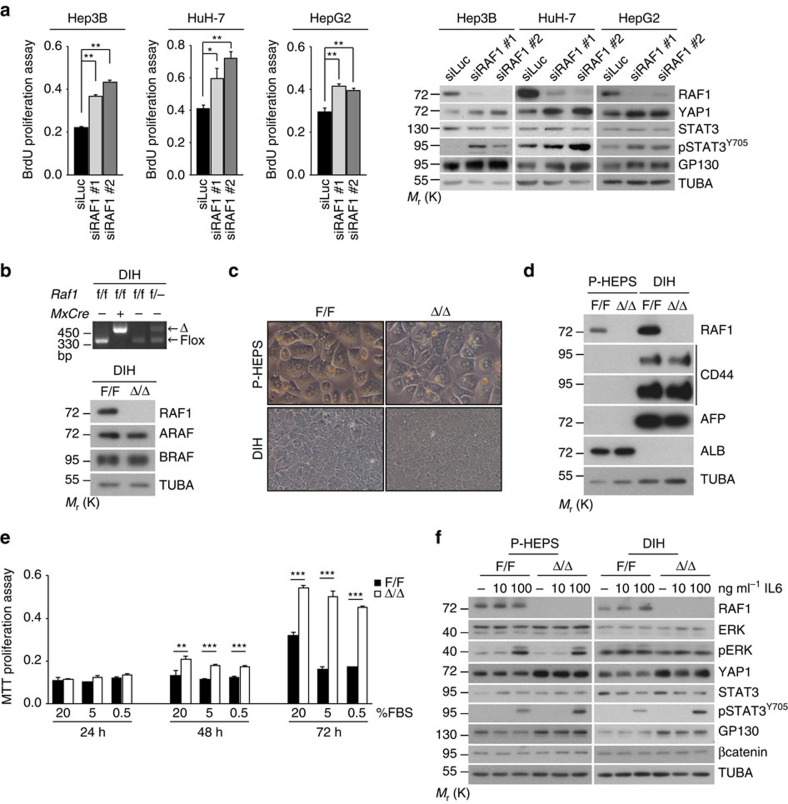
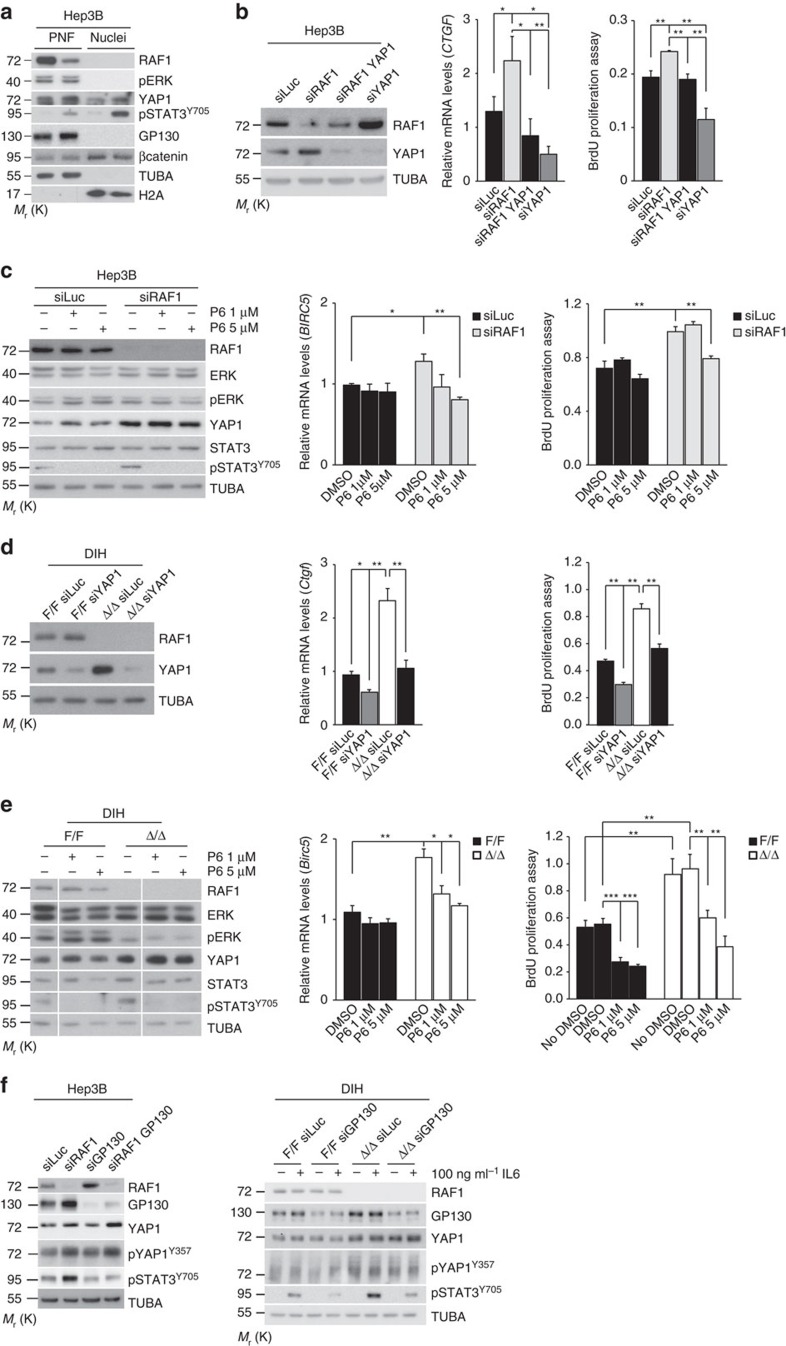
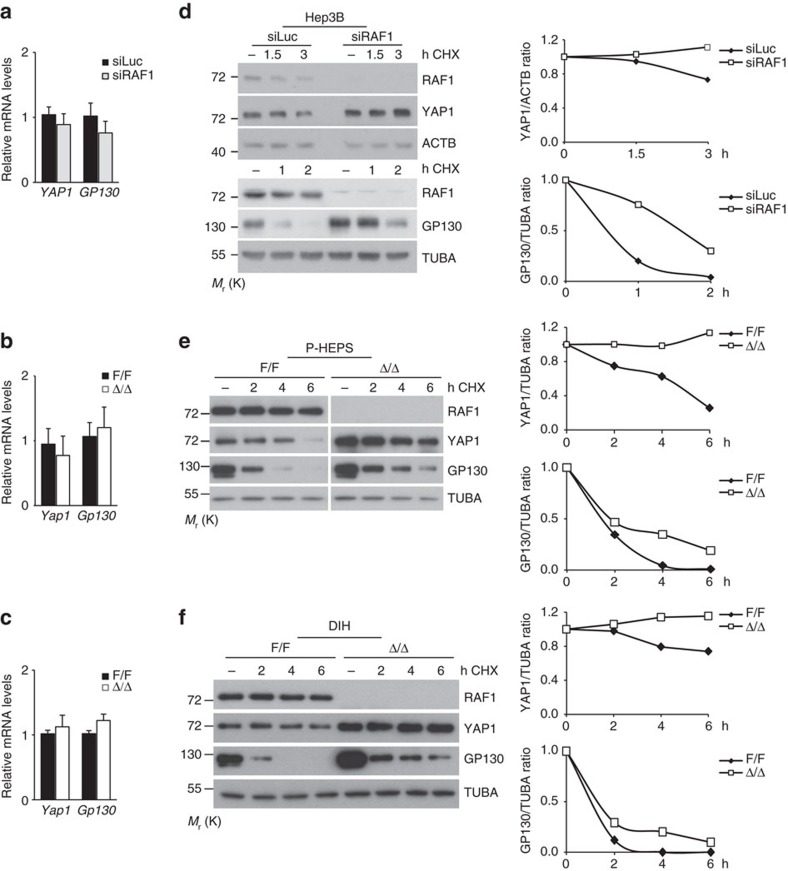
Hepatocellular carcinoma (HCC) is a leading cause of cancer deaths, but its molecular heterogeneity hampers the design of targeted therapies. Currently, the only therapeutic option for advanced HCC is Sorafenib, an inhibitor whose targets include RAF. Unexpectedly, RAF1 expression is reduced in human HCC samples. Modelling RAF1 downregulation by RNAi increases the proliferation of human HCC lines in xenografts and in culture; furthermore, RAF1 ablation promotes chemical hepatocarcinogenesis and the proliferation of cultured (pre)malignant mouse hepatocytes. The phenotypes depend on increased YAP1 expression and STAT3 activation, observed in cultured RAF1-deficient cells, in HCC xenografts, and in autochthonous liver tumours. Thus RAF1, although essential for the development of skin and lung tumours, is a negative regulator of hepatocarcinogenesis. This unexpected finding highlights the contribution of the cellular/tissue environment in determining the function of a protein, and underscores the importance of understanding the molecular context of a disease to inform therapy design.


Figures

Figure 1
Figure 1. RAF1 is expressed at low levels in human HCC and suppresses the growth of both HCC xenografts and chemically induced tumours.
(a) RAF1 expression in a cohort of 31 HCC patients. Left panel, representative IHC image (T, tumour; NT, non-tumour). Scale bar, 50 μm. Middle panel, RAF1 expression in matched tumour and non-tumour tissue (a.u.=arbitrary units). Right panel, RAF1 expression in tumours correlates inversely with tumour grade (ratio: protein expression in tumour/non-tumour tissue). (b) Inducible shRNA-mediated RAF1 silencing does not impact A- or BRAF expression (top panel) but increases the proliferation of Hep3B cells in culture (bottom panel; n=6). (c) Inducible shRNA-mediated RAF1 silencing strongly promotes the growth of Hep3B xenografts. (d,e) Ablation of RAF1 in liver parenchymal cells promotes chemically induced hepatocarcinogenesis. Top panels, experimental protocols. Left bottom panel, macroscopic appearance of F/F and Δhep (d) or Δp/np (e) tumour-bearing livers 30 weeks (w) after DEN injection; arrows indicate tumours. Scale bars, 0.5 cm. Middle panels, liver:body weight ratio of untreated or DEN/Pb-treated mice. Right panels, tumour numbers and % of tumour-occupied area in control, Δhep (d) and Δp/np (e) livers. In (d), no DEN: F/F n=4, Δhep=6; DEN-treated: F/F n=7, Δhep=8. In (e), DEN-treated: F/F n=10, Δp/np n=11. (f,g) Quantification of Ki67+ cells: (f) and inflammatory cells (g; F4/80+ cells, granulocytes and CD3+ cells) in tumour-bearing F/F and Δhep livers. Np=non-parenchymal cells. (h) Chemokine levels in the serum of F/F and Δhep mice. (i) Chemo-/cytokine levels in tumour-bearing livers. Data are presented as mean ± SEM, *P≤0.05, **P<0.01, ***P<0.005. In the box and whiskers plots (Tukey method), the box represents interquartile range, the middle bar the median, and the whiskers extend to 1.5 times the interquartile range. In (a), non-tumour versus tumour comparisons were analysed using paired Wilcoxon signed-rank test. P values are indicated in the graph (middle panel); in the right panel data were analysed using Spearman correlation. Spearman's rank correlation coefficient (rs) and P values are indicated within the graph. See also Supplementary Figs 1 and 2 and Supplementary Tables 1 and 2.
Figure 2
Figure 2. RAF1 ablation increases the number of cancer progenitor cells.
(a) Quantification of Ki67+ liver cells 8 (top panel) or 12 weeks (bottom panel) after DEN treatment. (b) Foci of altered hepatocytes (FAH) in F/F and Δhep or Δp/np livers isolated 12 weeks after DEN injection. Sections were stained with H&E or with the indicated antibodies. FAH are delimited by dotted circles (n=3 per genotype). Scale bars, 50 μm. (c) Percentage of cancer progenitor cells (CD44+/CD31−Ter119−CD45−) present in non-aggregate and aggregate fractions of F/F and Δp/np livers, as determined by FACS analysis. Data are represented as mean±s.e.m., *P≤0.05, **P<0.01, ***P<0.005 according to Student's t test. See also Supplementary Fig. 3.
Figure 3
Figure 3. Molecular characterization of RAF1-deficient lesions.
(a) Immunoblotting of F/F and Δp/np livers collected 30 weeks after DEN treatment. The plots represents a densitometric quantification of the immunoblot performed using ImageJ. The data are expressed as relative band intensity adjusted to TUBA or ACTB, which serve as loading controls (upper plot). Phosphorylation is expressed as the ratio between the phosphospecific antibody signal and the signal obtained with the protein-specific antibody. In both cases, the data are normalized to the F/F non-tumour samples, which were arbitrarily set as 1. (b) Immunoblot analysis of signaling pathways in xenograft samples (n=3, analysed 40 days after transplant). The plots show a quantification of the immunoblots performed as described in (a). (c) YAP1 expression in the same patient cohort examined in Fig. 1a. Scale bar, 50 μm. Left panel, representative IHC image. Middle panel, comparison of YAP1 expression in matched tumour and non-tumour tissue. Right panel, YAP1 expression in tumours correlates positively with tumour grade and the ratio of RAF1/YAP1 expression in the same tumour negatively correlates with histological grade. (d) STAT3 expression in the same cohort. Left panel, representative IHC image. Middle panel, comparison of STAT3 expression in matched tumour and non-tumour tissue. Right panel, RAF1/YAP1 expression in the same tumour negatively correlated with the presence of medium-large clusters of STAT3 nuclear staining. Scale bar 50 μm. In (a,b), the data are represented as mean±s.e.m., *P≤0.05, **P<0.01, ***P<0.005 according to Student's t-test. (c,d) Middle panels, In the box and whiskers plots (Tukey method), the box represents interquartile range, the middle bar the median, and the whiskers extend to 1.5 times the interquartile range. Statistical analysis was done using Wilcoxon signed rank test; the analysis in the right panels represents the Spearman correlation. rs and P values are indicated. See also Supplementary Fig. 4.
Figure 4
Figure 4. Molecular characterization of RAF1-deficient cells.
(a) siRNA-mediated RAF1 silencing promotes the proliferation of Hep3B (n=6), HuH-7 (n=5) and HepG2 (n=4) cells and increases the expression of YAP1 and GP130 as well as STAT3 phosphorylation. siRAF1#1 targets the region around nucleotide 721, while siRAF1#2 is a mixture of siRNAs targeting the region from nucleotide 692 to 1,093 in the RAF1 mRNA. (b) PCR and immunoblotting analysis of F/F and RAF1Δ/Δ DIH. (c) Morphology (x200 magnification) and molecular characterization (d) of primary hepatocytes (P-HEPS) compared to DIH (AFP, α-fetoprotein; ALB, albumin; TUBA, loading control). The immunoblot is representative of two independent experiments. (e) Proliferation of DIH in decreasing amounts of FBS. (f) Molecular defects of RAF1-deficient P-HEPS and DIH treated with the indicated concentrations of IL6 for 30 min. TUBA serves as loading control. Data are presented as mean±s.e.m. *P≤0.05, **P<0.01, ***P<0.005 according to Student's t test. See also Supplementary Fig. 5.
Figure 5
Figure 5. Effect of YAP1 silencing, the P6 JAK inhibitor and GP130 silencing on DIH and Hep3B proliferation.
(a) siRNA-mediated RAF1 silencing in Hep3B cells increases YAP1 and GP130 expression and STAT3 activation without impacting ERK phosphorylation or β-catenin expression/localization. Immunoblot analysis of post-nuclear fraction (PNF; 20 μg, about 8% of total) and nuclear fraction (Nuclei; 20 μg, about 15% of total). (b) Silencing of YAP1 in RAF1-proficient and -deficient Hep3B cells (left panel, representative immunoblot analysis) downregulates the expression of the YAP1 target gene CTGF (middle panel, qPCR analysis) and reduces proliferation (right panel). (c) Treatment with the JAK inhibitor P6 abrogates STAT3 phosphorylation without impacting ERK phosphorylation or YAP1 expression (left panel, representative immunoblot analysis), decreases BIRC5 expression (middle panel, qPCR analysis) and reduces proliferation in RAF1-deficient Hep3B cells (right panel). (d,e) Similar results are obtained by subjecting RAF1-proficient and -deficient DIH to YAP1 silencing (d) or P6 treatment (e). (f) GP130 silencing decreases STAT3 phosphorylation but does not affect YAP1 expression or phosphorylation. Proliferation was assessed 48 h after siRNA transfection (with the exception of c, in which P6 was added 24 h after transfection and proliferation was measured after additional 48 h), gene expression after 24 h, and for immunoblotting cells were lysed after 1 h inhibitor treatment. In (f) DIH were treated for 30 min with the indicated concentration of IL6. Experiments were performed in DMEM supplemented with 10% FBS (Hep3B cells) or in DIH medium supplemented with 5% FBS (DIH). The immunoblots are representative of two independent experiments; TUBA was used as loading control. The plots represent the mean±s.e.m. of three independent experiments. *P≤0.05, **P<0.01 according to Student's t test.
Figure 6
Figure 6. RAF1 ablation correlates with decreased YAP1 and GP130 protein turnover in Hep3B cells, primary hepatocytes (P-HEPS), and DIH.
(a-c) qPCR analysis showing the expression of the YAP1 and Gp130 genes in Hep3B (a), P-HEPS (b) and DIH (c). qPCR data represent the mean (±s.e.m.) of three independent experiments; according to Student's t test. (d-f) Cells were treated with cycloheximide for the indicated amount of time prior to lysis. YAP1 and GP130 expression levels were determined by immunoblotting. A quantification is shown in the right panel; the amount of protein present in each of the untreated samples (normalized to TUBA or ACTB as loading controls) is set as 1.

References

    1. El-Serag H. B. Hepatocellular carcinoma. N. Engl. J. Med. 365, 1118–1127 (2011). - PubMed
    1. Pinyol R., Nault J. C., Quetglas I. M., Zucman-Rossi J. & Llovet J. M. Molecular profiling of liver tumors: classification and clinical translation for decision making. Semin. Liver Dis. 34, 363–375 (2014). - PubMed
    1. Yimlamai D., Fowl B. H. & Camargo F. D. Emerging evidence on the role of the Hippo/YAP pathway in liver physiology and cancer. J. Hepatol. 63, 1491–1501 (2015). - PMC - PubMed
    1. Pilati C. et al.. Somatic mutations activating STAT3 in human inflammatory hepatocellular adenomas. J. Exp. Med. 208, 1359–1366 (2011). - PMC - PubMed
    1. Schulze K. et al.. Exome sequencing of hepatocellular carcinomas identifies new mutational signatures and potential therapeutic targets. Nat. Genet. 47, 505–511 (2015). - PMC - PubMed

Publication types

MeSH terms