. 2017 Jan 24;56(3):487-499.
doi: 10.1021/acs.biochem.6b00447. Epub 2017 Jan 11.

Human Mitochondrial Ferredoxin 1 (FDX1) and Ferredoxin 2 (FDX2) Both Bind Cysteine Desulfurase and Donate Electrons for Iron-Sulfur Cluster Biosynthesis

Affiliations

Human Mitochondrial Ferredoxin 1 (FDX1) and Ferredoxin 2 (FDX2) Both Bind Cysteine Desulfurase and Donate Electrons for Iron-Sulfur Cluster Biosynthesis

Kai Cai et al. Biochemistry. .

Abstract

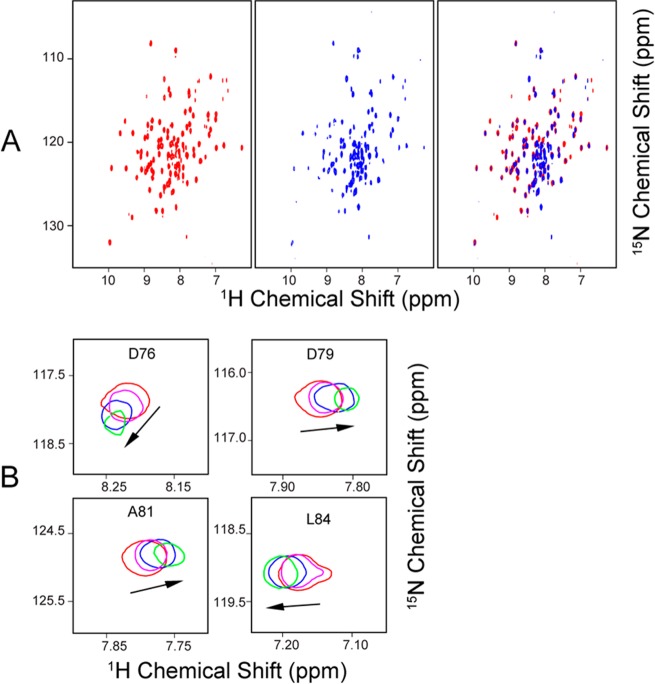
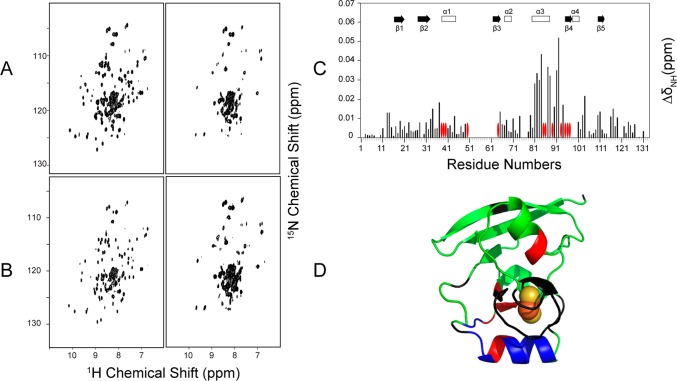
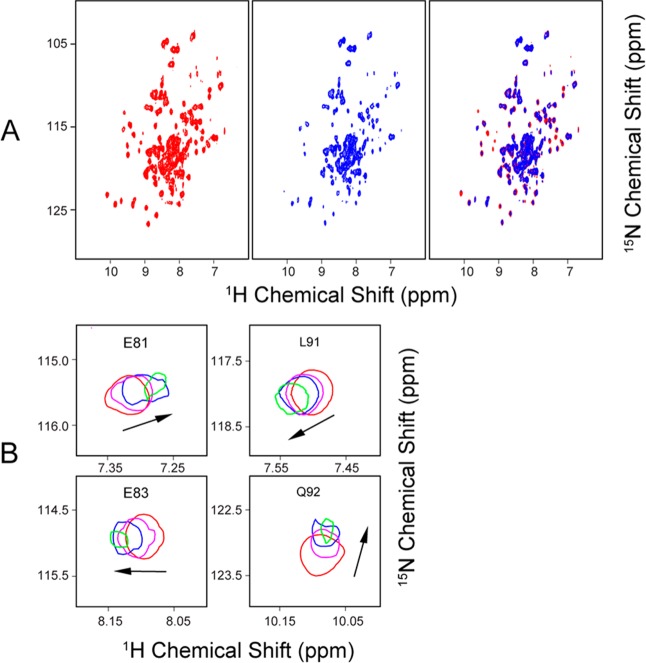
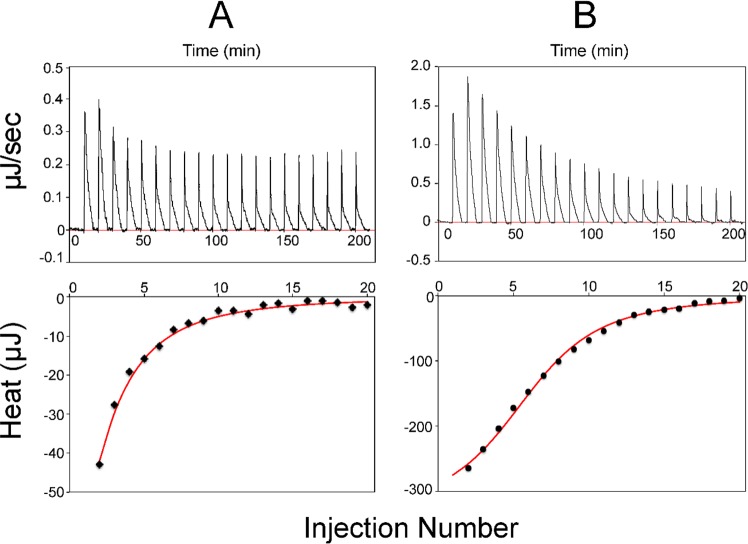
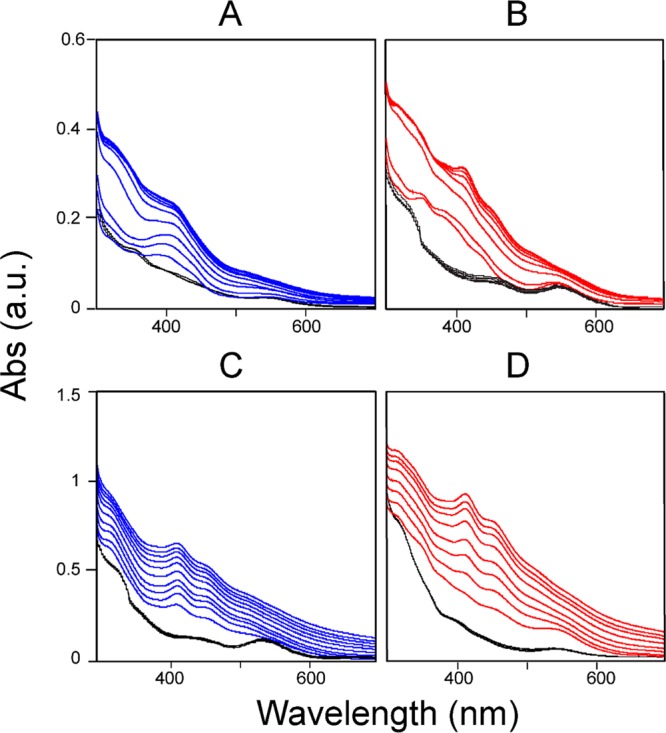
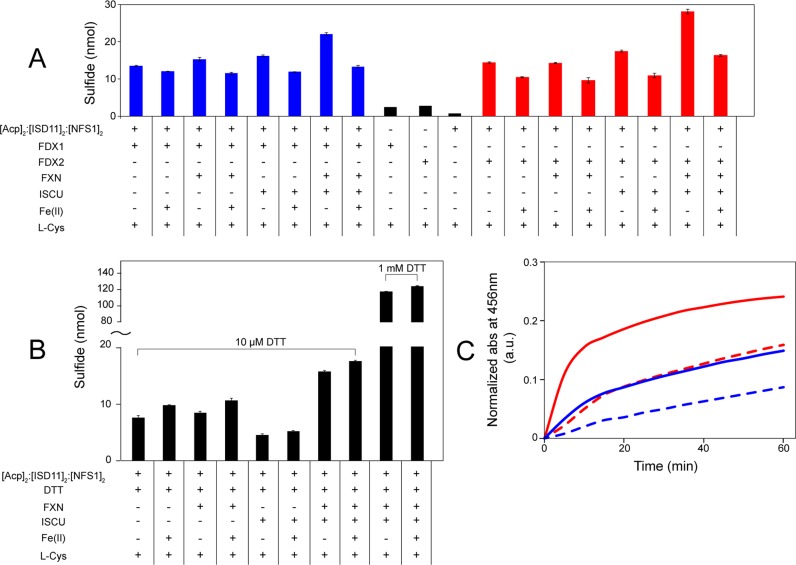
Ferredoxins play an important role as an electron donor in iron-sulfur (Fe-S) cluster biosynthesis. Two ferredoxins, human mitochondrial ferredoxin 1 (FDX1) and human mitochondrial ferredoxin 2 (FDX2), are present in the matrix of human mitochondria. Conflicting results have been reported regarding their respective function in mitochondrial iron-sulfur cluster biogenesis. We report here biophysical studies of the interaction of these two ferredoxins with other proteins involved in mitochondrial iron-sulfur cluster assembly. Results from nuclear magnetic resonance spectroscopy show that both FDX1 and FDX2 (in both their reduced and oxidized states) interact with the protein complex responsible for cluster assembly, which contains cysteine desulfurase (NFS1), ISD11 (also known as LYRM4), and acyl carrier protein (Acp). In all cases, ferredoxin residues close to the Fe-S cluster are involved in the interaction with this complex. Isothermal titration calorimetry results showed that FDX2 binds more tightly to the cysteine desulfurase complex than FDX1 does. The reduced form of each ferredoxin became oxidized in the presence of the cysteine desulfurase complex when l-cysteine was added, leading to its conversion to l-alanine and the generation of sulfide. In an in vitro reaction, the reduced form of each ferredoxin was found to support Fe-S cluster assembly on ISCU; the rate of cluster assembly was faster with FDX2 than with FDX1. Taken together, these results show that both FDX1 and FDX2 can function in Fe-S cluster assembly in vitro.


Conflict of interest statement

The authors declare no competing financial interest.

Figures

Figure 1
Figure 1
Sequence alignment of ferredoxins and crystal structures of FDX1 and FDX2. (A) Sequence alignment of ferredoxins. Human FDX1 and FDX2 are highlighted in black boxes. Color code: red, conserved; blue, partially conserved. The four conserved cysteine residues that ligate the [2Fe-2S] cluster are indicated by red arrows. The secondary structure prediction is based on the structure of human FDX1. Abbreviations: Xa, Xenopus laevis; Mm, Mus musculus; Bt, Bos taurus; Sc, Saccharomyces cerevisiae; Ec, E. coli; Hs, Homo sapiens; At, Arabidopsis thaliana. (B) Crystal structures of human ox-FDX1 (left, PDB entry 3P1M) and ox-FDX2 (right, PDB entry 2Y5C). The [2Fe-2S] clusters are shown as spheres, and the cysteine ligands are colored red.
Figure 2
Figure 2
750 MHz (1H) 2D 1H–15N TROSY-HSQC NMR spectra of different states of FXD1 and FDX2. (A) FDX1 in its oxidized (left), reduced (middle), and apo (right) states. (B) FDX2 in its oxidized (left), reduced (middle), and apo (right) states.
Figure 3
Figure 3
Redox state differences in the backbone chemical shifts of FDX1 and FDX2. 1H and 15N chemical shifts were obtained from assigned 1H–15N TROSY-HSQC spectra acquired at 750 MHz of uniformly 15N-labeled FDX1 and FDX2 before (oxidized) and after reduction with sodium dithionite. The differences in these chemical shifts (ΔδH and ΔδN) were converted to chemical shift perturbations (ΔδHN) as described in Methods. (A) ΔδHN values for FDX1 plotted as a function of residue number. The red ovals denote residues whose signals were broadened beyond detection. (B) ΔδHN results from panel A mapped onto the structure of FDX1 (PDB entry 3P1M). Color code: green, not significantly affected (ΔδNH < 0.1 ppm); blue, significant chemical shift changes (ΔδNH > 0.1 ppm); red, severe line broadening; black, no assignments. (C) ΔδHN values for FDX2 plotted as a function of residue number. The red ovals denote residues whose signals were broadened beyond detection. (D) ΔδHN results from panel C mapped onto the structure of FDX2 (PDB entry 2Y5C). Color code: green, not significantly affected (ΔδNH < 0.05 ppm); blue, significant chemical shift changes (ΔδNH > 0.05 ppm); red, severe line broadening; black, no assignments.
Figure 4
Figure 4
NMR evidence showing that both ox-FDX1 and re-FDX1 interact with the cysteine desulfurase complex ([Acp]2:[ISD11]2:[NFS1]2). (A) Left, 1H–15N TROSY-HSQC NMR spectrum of [U-15N]ox-FDX1; right, 1H–15N TROSY-HSQC spectrum of [U-15N]ox-FDX1 following addition of 1 subunit equivalent of unlabeled [Acp]2:[ISD11]2:[NFS1]2. (B) Left, 1H–15N TROSY-HSQC NMR spectrum of [U-15N]re-FDX1; right, 1H–15N TROSY-HSQC spectrum of [U-15N]re-FDX1 following the addition of 1 subunit equivalent of unlabeled [Acp]2:[ISD11]2:[NFS1]2. (C) CS perturbation of the 1H–15N signals (ΔδNH) of [U-15N]ox-FDX1 resulting from the interaction with [Acp]2:[ISD11]2:[NFS1]2. The red ovals denote the residues whose signals were broadened beyond detection. (D) CS perturbation results from panel C mapped onto the structure of FDX1 (PDB entry 3P1M). Color code: green, not significantly affected (ΔδNH < 0.03 ppm); blue, significant chemical shift changes (ΔδNH > 0.03 ppm); red, severe line broadening; black, no assignments. All NMR data were collected at 750 MHz (1H).
Figure 5
Figure 5
Identification of residues of FDX1 that interact with the [Acp]2:[ISD11]2:[NFS1]2 complex. (A) Left, 1H–15N TROSY-HSQC NMR spectrum of [U-15N]ox-FDX1; middle, 1H–15N TROSY-HSQC spectrum of [U-15N]ox-FDX1 following the addition of 0.4 subunit equivalent of unlabeled [Acp]2:[ISD11]2:[NFS1]2; right, overlay of the left and middle panels. (B) Signals from residues D76, D79, A81, and L84 as a function of added [Acp]2:[ISD11]2:[NFS1]2: 0 (red), 0.2 (magenta), 0.4 (blue), and 0.8 (green) subunit equivalent. NMR spectra were acquired at 750 MHz (1H).
Figure 6
Figure 6
NMR evidence showing that both ox-FDX2 and re-FDX2 interact with the cysteine desulfurase complex ([Acp]2:[ISD11]2:[NFS1]2). (A) Left, 1H–15N TROSY-HSQC NMR spectrum of [U-15N]ox-FDX2; right, 1H–15N TROSY-HSQC spectrum of [U-15N]ox-FDX2 following addition of 1 subunit equivalent of unlabeled [Acp]2:[ISD11]2:[NFS1]2. (B) Left, 1H–15N TROSY-HSQC NMR spectra of [U-15N]re-FDX2; right, 1H–15N TROSY-HSQC spectrum of [U-15N]re-FDX2 following addition of 1 subunit equivalent of unlabeled [Acp]2:[ISD11]2:[NFS1]2. (C) CS perturbation of the 1H–15N signals (ΔδNH) of [U-15N]ox-FDX2 resulting from the interaction with [Acp]2:[ISD11]2:[NFS1]2. The red ovals denote the residues whose signals were broadened beyond detection. (D) CS perturbation results from panel C mapped onto the structure of FDX2 (PDB entry 2Y5C). Color code: green, not significantly affected (ΔδNH < 0.03 ppm); blue, significant chemical shift changes (ΔδNH > 0.03 ppm); red, severe line broadening; black, no assignments. All NMR data were collected at 750 MHz (1H).
Figure 7
Figure 7
Identification of residues of FDX2 that interact with the [Acp]2:[ISD11]2:[NFS1]2 complex. (A) Left, 1H–15N TROSY-HSQC NMR spectrum of [U-15N]ox-FDX2; middle, 1H–15N TROSY-HSQC spectrum of [U-15N]ox-FDX2 following the addition of 0.4 subunit equivalent of unlabeled [Acp]2:[ISD11]2:[NFS1]2; right, overlay of the left and middle panels. (B) Signals from residues E81, E83, L91, and Q92 as a function of added [Acp]2:[ISD11]2:[NFS1]2: 0 (red), 0.2 (magenta), 0.4 (blue), and 0.8 (green) subunit equivalent. NMR spectra were acquired at 750 MHz (1H).
Figure 8
Figure 8
ITC analysis of the interaction of the [Acp]2:[ISD11]2:[NFS1]2 complex with (A) ox-FDX1 and (B) ox-FDX2. The top panels show peaks indicating heat released after each injection of the [Acp]2:[ISD11]2:[NFS1]2 complex into the solution of ox-FDX1 or ox-FDX2. The bottom panels show data points fitted to a single binding constant to yield thermodynamic parameters.
Figure 9
Figure 9
UV/vis spectra taken to monitor the oxidation state of ferredoxins under different conditions. (A) Results for FDX1: (blue lines) UV/vis spectra taken every 5 min for 60 min of the reaction mixture containing 25 μM re-FDX1 and 25 μM [Acp]2:[ISD11]2:[NFS1]2 following the addition of a 5-fold excess of l-cysteine and (black lines) control reaction without l-cysteine, with UV/vis spectra taken every 5 min for 30 min. (B) Results for FDX2: (red lines) UV/vis spectra taken every 5 min for 60 min of the reaction mixture containing 25 μM re-FDX2 and 25 μM [Acp]2:[ISD11]2:[NFS1]2 following the addition of a 5-fold excess of l-cysteine and (black lines) control reaction without l-cysteine, with UV/vis spectra taken every 5 min for 30 min. (C) Results for FDX1 in the presence of ISCU: (blue lines) UV/vis spectra taken every 5 min for 50 min of the reaction mixture containing 25 μM re-FDX1 and 25 μM ISCU in the presence of a catalytic quantity (0.02 subunit equivalent) of [Acp]2:[ISD11]2:[NFS1]2 and 5 equiv of ferrous ammonium sulfate following the addition of a 5-fold excess of l-cysteine and (black lines) control reaction without l-cysteine, with UV/vis spectra taken every 5 min for 30 min. (D) Results for FDX2 in the presence of ISCU: (red lines) UV/vis spectra taken every 5 min for 50 min of the reaction mixture containing 25 μM re-FDX2 and 25 μM ISCU in the presence of a catalytic quantity (0.02 subunit equivalent) of [Acp]2:[ISD11]2:[NFS1]2 and 5 equiv of ferrous ammonium sulfate following the addition of a 5-fold excess of l-cysteine and (black lines) control reaction without l-cysteine, with UV/vis spectra taken every 5 min for 30 min. The results show that neither reduced ferredoxin is oxidized by the reaction mixture when l-cysteine is absent. The results also demonstrate that both re-FDX1 and re-FDX2 can transfer an electron to [Acp]2:[ISD11]2:[NFS1]2 in the presence of l-cysteine and that both ferredoxins facilitate Fe–S cluster assembly on the scaffold protein ISCU.
Figure 10
Figure 10
Cysteine desulfurase activities and in vitro Fe–S cluster assembly rates of different reaction mixtures. (A) Cysteine desulfurase activity assay of [Acp]2:[ISD11]2:[NFS1]2 with either re-FDX1 or re-FDX2 as the reducing agent. The composition of each reaction mixture is denoted below the x-axis. The components of the 300 μL reaction mixture were [Acp]2:[ISD11]2:[NFS1]2 (1 μM), re-FDX1 (10 μM), re-FDX2 (10 μM), FXN (10 μM), ISCU (10 μM), Fe2(NH4)2(SO4)2 (50 μM), and l-cysteine (50 μM) added last to initiate the reaction. (B) Cysteine desulfurase activity assay of [Acp]2:[ISD11]2:[NFS1]2 using DTT as the reducing agent. The composition of each reaction mixture is denoted below the x-axis. The components of the reaction mixture were [Acp]2:[ISD11]2:[NFS1]2 (300 μL), DTT (as shown in the figure), FXN (10 μM), ISCU (10 μM), Fe2(NH4)2(SO4)2 (50 μM), and l-cysteine (50 μM) added last to initiate the reaction. (C) Time course of the in vitro Fe–S cluster assembly reaction as monitored by absorbance at 456 nm. The reaction mixture contained [Acp]2:[ISD11]2:[NFS1]2 (0.5 μM), ISCU (25 μM), Fe2(NH4)2(SO4)2 (125 μM), either re-FDX1 (25 μM) or re-FDX2 (25 μM), and l-cysteine (125 μM) added last to initiate the reaction. FXN, if present, was at a concentration of 25 μM. Reaction with re-FDX1 as the reducing agent, with (solid blue line) or without (dashed blue line) FXN. Reaction with re-FDX2 as the reducing agent, with (solid red line) or without (dashed red line) FXN.

Similar articles

Cited by

References

    1. Py B.; Barras F. (2010) Building Fe-S proteins: bacterial strategies. Nat. Rev. Microbiol. 8, 436–446. 10.1038/nrmicro2356. - DOI - PubMed
    1. Johnson D. C.; Dean D. R.; Smith A. D.; Johnson M. K. (2005) Structure, function, and formation of biological iron-sulfur clusters. Annu. Rev. Biochem. 74, 247–281. 10.1146/annurev.biochem.74.082803.133518. - DOI - PubMed
    1. Lill R. (2009) Function and biogenesis of iron-sulphur proteins. Nature 460, 831–838. 10.1038/nature08301. - DOI - PubMed
    1. Lill R.; Hoffmann B.; Molik S.; Pierik A. J.; Rietzschel N.; Stehling O.; Uzarska M. A.; Webert H.; Wilbrecht C.; Muhlenhoff U. (2012) The role of mitochondria in cellular iron-sulfur protein biogenesis and iron metabolism. Biochim. Biophys. Acta, Mol. Cell Res. 1823, 1491–1508. 10.1016/j.bbamcr.2012.05.009. - DOI - PubMed
    1. Lill R.; Muhlenhoff U. (2006) Iron-sulfur protein biogenesis in eukaryotes: components and mechanisms. Annu. Rev. Cell Dev. Biol. 22, 457–86. 10.1146/annurev.cellbio.22.010305.104538. - DOI - PubMed

MeSH terms