

Vitamin D Receptor Expression in Plasmablastic Lymphoma and Myeloma Cells Confers Susceptibility to Vitamin D
- PMID: 28001444
- PMCID: PMC5460784
- DOI: 10.1210/en.2016-1802
Vitamin D Receptor Expression in Plasmablastic Lymphoma and Myeloma Cells Confers Susceptibility to Vitamin D
Abstract
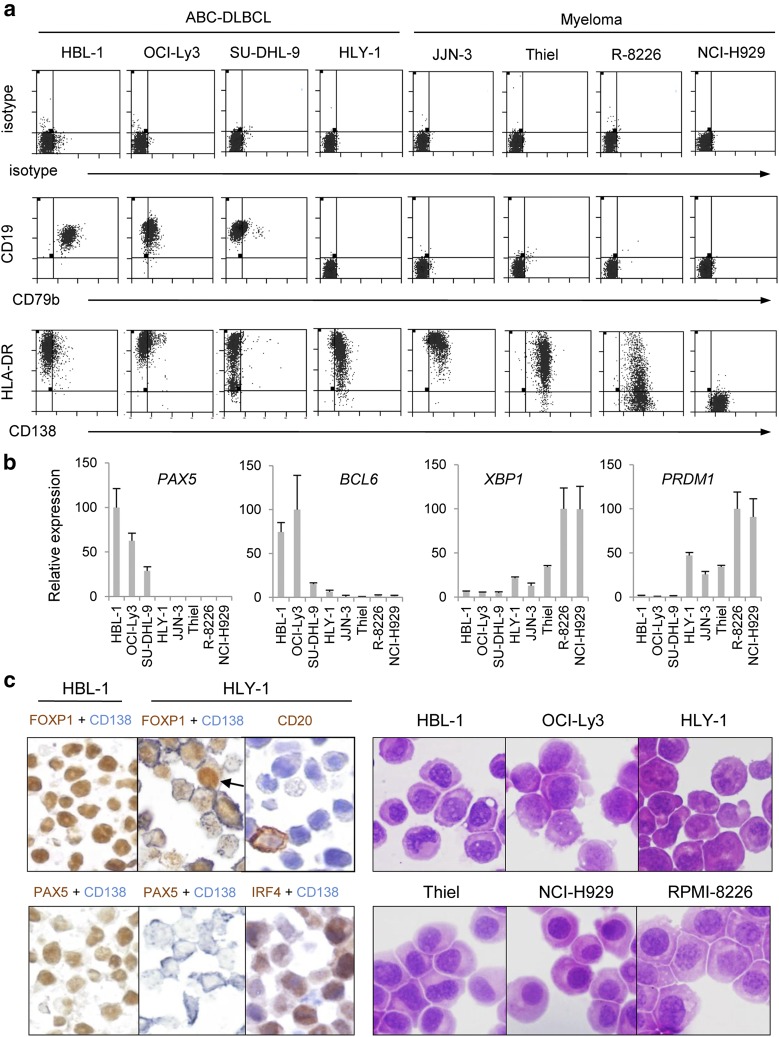
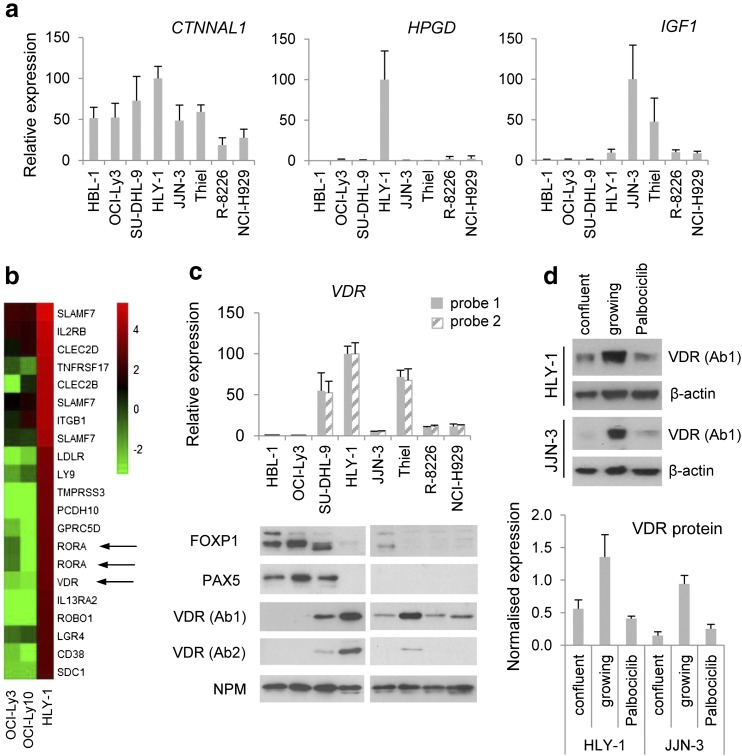
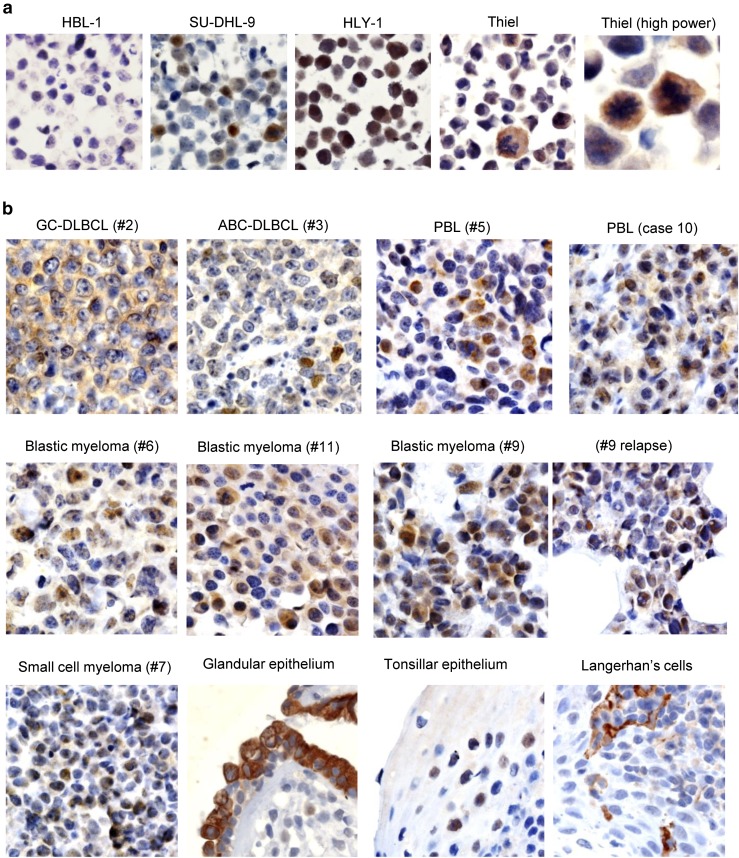
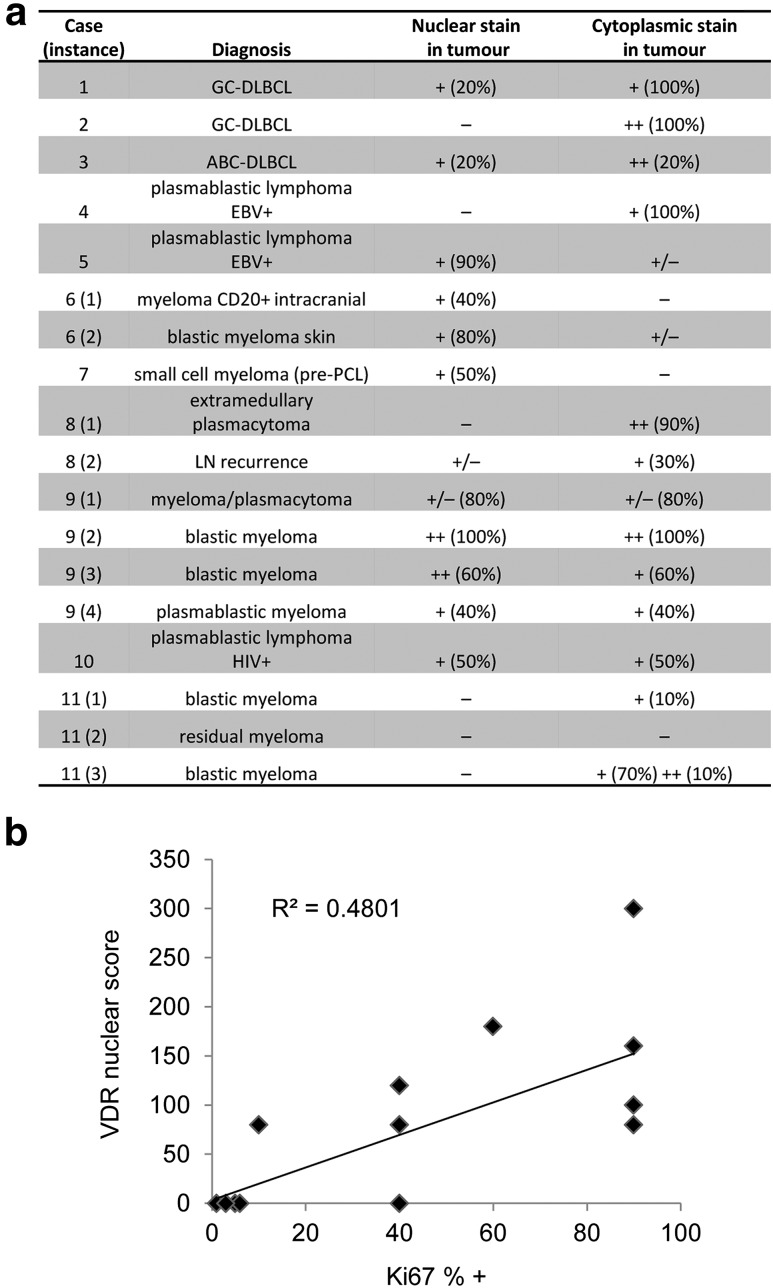
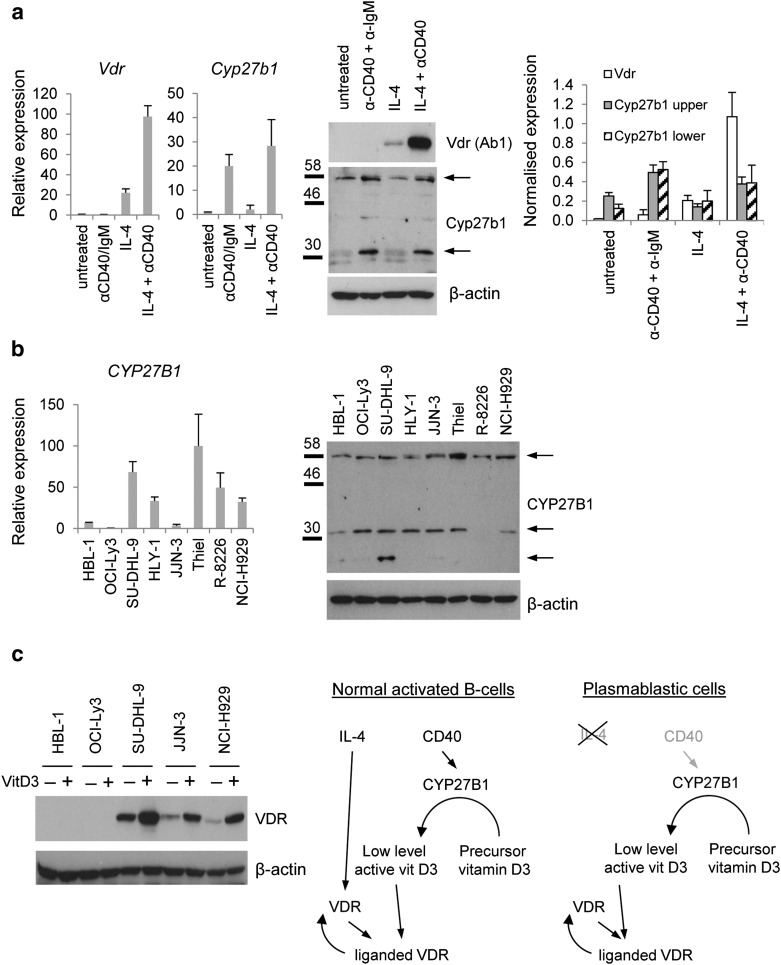
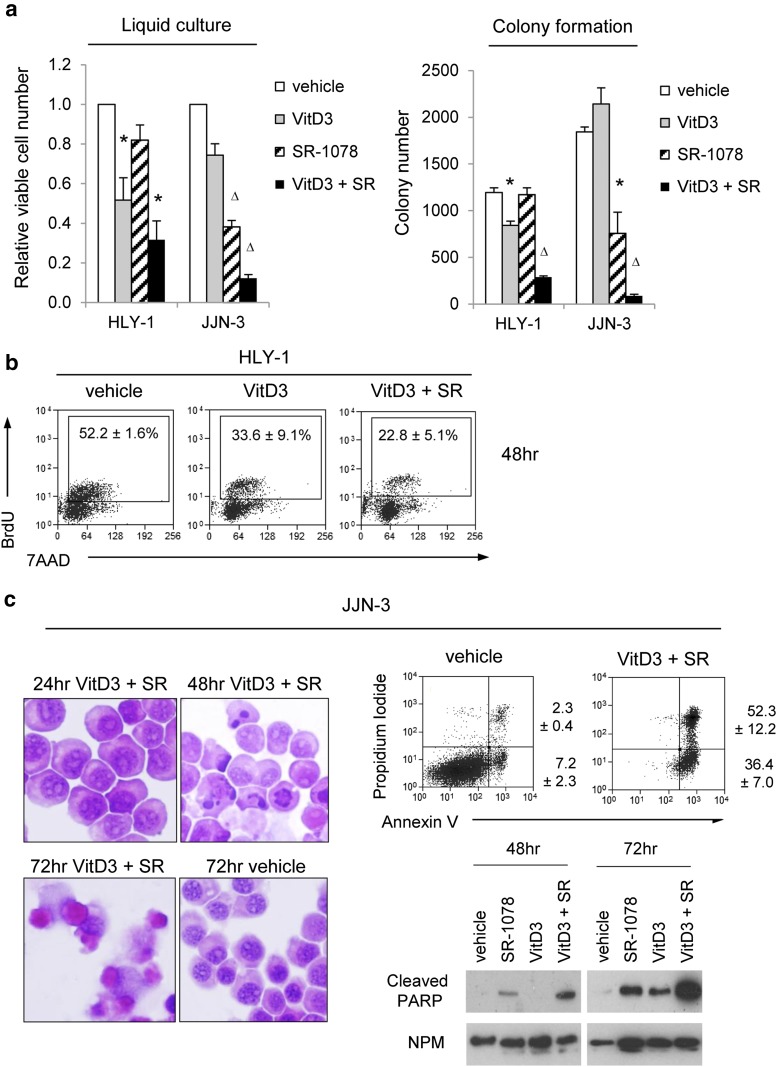
Plasmablastic B-cell malignancies include plasmablastic lymphoma and subsets of multiple myeloma and diffuse large B-cell lymphomaDLBCL. These diseases can be difficult to diagnose and treat, and they lack well-characterized cell line models. Here, immunophenotyping and FOXP1 expression profiling identified plasmablastic characteristics in DLBCL cell lines HLY-1 and SU-DHL-9, associated with CTNNAL1, HPGD, RORA, IGF1, and/or vitamin D receptor (VDR) transcription. We demonstrated VDR protein expression in primary plasmablastic tumor cells and confirmed in cell lines expression of both VDR and the metabolic enzyme CYP27B1, which catalyzes active vitamin D3 production. Although Vdr and Cyp27b1 transcription in normal B cells were activated by interleukin 4 (IL-4) and CD40 signaling, respectively, unstimulated malignant plasmablastic cells lacking IL-4 expressed both VDR and CYP27B1. Positive autoregulation evidenced intact VDR function in all plasmablastic lines, and inhibition of growth by active vitamin D3 was both dependent on MYC protein inhibition and could be enhanced by cotreatment with a synthetic ROR ligand SR-1078. Furthermore, a VDR polymorphism, FOK1, was associated with greater vitamin D3-dependent growth inhibition. In summary, HLY-1 provides an important model of strongly plasmablastic lymphoma, and disruption of VDR pathway activity may be of therapeutic benefit in both plasmablastic lymphoma and myeloma.
Copyright © 2017 by the Endocrine Society.
Figures

Similar articles
-
Transcriptional activation of the wild-type and mutant vitamin D receptors by vitamin D3 analogs.J Mol Endocrinol. 2016 Jul;57(1):23-32. doi: 10.1530/JME-16-0048. Epub 2016 May 6. J Mol Endocrinol. 2016. PMID: 27154546
-
Vitamin D and systemic cancer: is this relevant to malignant melanoma?Br J Dermatol. 2002 Aug;147(2):197-213. doi: 10.1046/j.1365-2133.2002.04960.x. Br J Dermatol. 2002. PMID: 12174089 Review.
-
Potent antiproliferative effects of 25-hydroxy-16-ene-23-yne-vitamin D₃ that resists the catalytic activity of both CYP27B1 and CYP24A1.J Cell Biochem. 2014 Aug;115(8):1392-402. doi: 10.1002/jcb.24789. J Cell Biochem. 2014. PMID: 24535953
-
Vitamin D and estrogen synergy in Vdr-expressing CD4(+) T cells is essential to induce Helios(+)FoxP3(+) T cells and prevent autoimmune demyelinating disease.J Neuroimmunol. 2015 Sep 15;286:48-58. doi: 10.1016/j.jneuroim.2015.06.015. Epub 2015 Jul 4. J Neuroimmunol. 2015. PMID: 26298324
-
Metabolism and Action of 25-Hydroxy-19-nor-Vitamin D₃ in Human Prostate Cells.Vitam Horm. 2016;100:357-77. doi: 10.1016/bs.vh.2015.10.009. Epub 2015 Dec 8. Vitam Horm. 2016. PMID: 26827959 Review.
Cited by
-
Reviewing the Significance of Vitamin D Substitution in Monoclonal Gammopathies.Int J Mol Sci. 2021 May 6;22(9):4922. doi: 10.3390/ijms22094922. Int J Mol Sci. 2021. PMID: 34066482 Free PMC article. Review.
-
Search for multiple myeloma risk factors using Mendelian randomization.Blood Adv. 2020 May 26;4(10):2172-2179. doi: 10.1182/bloodadvances.2020001502. Blood Adv. 2020. PMID: 32433745 Free PMC article.
-
Investigating additional malignancy rates and prognostic factors in multiple myeloma patients: a Surveillance, Epidemiology, and End Results (SEER) database retrospective cohort study.Transl Cancer Res. 2025 Apr 30;14(4):2192-2206. doi: 10.21037/tcr-24-1721. Epub 2025 Apr 14. Transl Cancer Res. 2025. PMID: 40386261 Free PMC article.
-
The Role of the Vitamin D Receptor in the Pathogenesis, Prognosis, and Treatment of Cutaneous Melanoma.Front Oncol. 2021 Oct 6;11:743667. doi: 10.3389/fonc.2021.743667. eCollection 2021. Front Oncol. 2021. PMID: 34692525 Free PMC article. Review.
-
Plasma 25-Hydroxyvitamin D Levels and VDR Gene Expression in Peripheral Blood Mononuclear Cells of Leukemia Patients and Healthy Subjects in Central Kazakhstan.Nutrients. 2020 Apr 26;12(5):1229. doi: 10.3390/nu12051229. Nutrients. 2020. PMID: 32357551 Free PMC article.
References
-
- Pasqualucci L, Dalla-Favera R. SnapShot: diffuse large B cell lymphoma. Cancer Cell. 2014;25:132–132.e131. - PubMed
-
- Wilkinson ST, Vanpatten KA, Fernandez DR, Brunhoeber P, Garsha KE, Glinsmann-Gibson BJ, Grogan TM, Teruya-Feldstein J, Rimsza LM. Partial plasma cell differentiation as a mechanism of lost major histocompatibility complex class II expression in diffuse large B-cell lymphoma. Blood. 2011;119(6):1459–1467. - PMC - PubMed
-
- Castillo JJ, Bibas M, Miranda RN. The biology and treatment of plasmablastic lymphoma. Blood. 2015;125(15):2323–2330. - PubMed
-
- Montes-Moreno S, Montalbán C, Piris MA. Large B-cell lymphomas with plasmablastic differentiation: a biological and therapeutic challenge. Leuk Lymphoma. 2011;53(2):185–194. - PubMed
-
- Rajkumar SV, Fonseca R, Lacy MQ, Witzig TE, Therneau TM, Kyle RA, Litzow MR, Gertz MA, Greipp PR. Plasmablastic morphology is an independent predictor of poor survival after autologous stem-cell transplantation for multiple myeloma. J Clin Oncol. 1999;17(5):1551–1557. - PubMed
MeSH terms
Substances
Grants and funding
LinkOut - more resources
Full Text Sources
Other Literature Sources
Medical
Research Materials
Miscellaneous
