. 2017 Jan 19;541(7637):371-375.
doi: 10.1038/nature21022. Epub 2016 Dec 21.

Reversible methylation of m6Am in the 5' cap controls mRNA stability

Affiliations

Reversible methylation of m6Am in the 5' cap controls mRNA stability

Jan Mauer et al. Nature. .

Abstract

Internal bases in mRNA can be subjected to modifications that influence the fate of mRNA in cells. One of the most prevalent modified bases is found at the 5' end of mRNA, at the first encoded nucleotide adjacent to the 7-methylguanosine cap. Here we show that this nucleotide, N6,2'-O-dimethyladenosine (m6Am), is a reversible modification that influences cellular mRNA fate. Using a transcriptome-wide map of m6Am we find that m6Am-initiated transcripts are markedly more stable than mRNAs that begin with other nucleotides. We show that the enhanced stability of m6Am-initiated transcripts is due to resistance to the mRNA-decapping enzyme DCP2. Moreover, we find that m6Am is selectively demethylated by fat mass and obesity-associated protein (FTO). FTO preferentially demethylates m6Am rather than N6-methyladenosine (m6A), and reduces the stability of m6Am mRNAs. Together, these findings show that the methylation status of m6Am in the 5' cap is a dynamic and reversible epitranscriptomic modification that determines mRNA stability.


Figures

Extended Data Figure 1
Extended Data Figure 1. m6A enrichment is increased within the 5′ UTR of Fto-knockout mice relative to wild-type mice and FTO prefers m6Am over m6A
a, m6A peak mass was calculated for all peaks that were found in both Fto-knockout mice (Fto−/−) and wild-type (WT) mice. The ratio of each individual peak's mass relative to the average peak mass for each sample was then determined, providing a relative peak mass. The relative peak mass for Fto−/− mice was divided by the relative peak mass for wild-type mice for each m6A peak. A metagene analysis was performed to plot the distribution of these peak mass ratios (knockout/wild type) along the length of an mRNA. This analysis reveals that the changes in peak mass ratio for knockout mice relative to wild-type mice are increased in the 5′ UTR. These findings provided the first hint that FTO activity might be directed towards m6Am. The basis for the reduced peak mass ratio in the 3′ UTR is unclear. Because FTO is a demethylating enzyme, loss of FTO should increase nucleotide methylation. Thus, the reduced methylation of m6A residues in the 3′ UTR is likely to be an indirect effect of FTO deficiency. CDS, coding sequence; TSS, transcription start site. b, Representative HPLC chromatogram of synthetic standards that were used to determine retention times of adenosine (A), 2′-O-methyladenosin (Am), N6-methyladenosine (m6A), or N6,2′-O-dimethyladenosine (m6Am). mAU, milli absorbance units. c-f, Reaction curves for FTO with the different substrates that were used to calculate reaction velocity for Michaelis-Menten analysis. FTO concentrations that allowed initial velocity conditions were used for individual oligonucleotides (20 nM FTO for m7Gpppm6Am (c) and m7Gpppm6A (d); 200 nM FTO for m7Gpppm6A (e) and internal m6A (f) in a GGACU context; n = 3 biological replicates; mean ± s.e.m.). g, Michaelis-Menten plots of FTO for either m6Am or m6A. Michaelis-Menten curves of FTO reacting with m7Gpppm6Am (blue), m7Gpppm6A (brown), m7GpppACm6A (orange) or m6A in a GGACU context (green). Owing to the increased reaction speed of FTO with m6Am and m6A adjacent to the m7G compared to more distal m6A, the enzyme concentration was tenfold lower when we assessed reaction rates for m6Am (20 nM FTO for the m7Gpppm6Am and m7Gpppm6A oligonucleotide; 200 nM FTO for the m7Gpppm6A and for internal m6A in a GGACU context). Figure 1d shows a plot in which the data are normalized to enzyme concentration. However, here the plot shows data that were not normalized to enzyme concentration (n = 3 biological replicates; mean ± s.e.m.).
Extended Data Figure 2
Extended Data Figure 2. FTO-mediated demethylation of m6Am depends on integral parts of the mRNA 5′ cap and accurate mass measurement of the oxidative demethylation of the extended m7Gpppm6Am-cap by FTO
a, Structure-activity relationship of FTO and its substrate. ALKBH5 preferentially demethylates m6A in its physiological sequence context but FTO does not require a sequence context to demethylate m6A (refs 3,60). This lack of a sequence preference suggests that m6A is not a preferred substrate for FTO. We therefore asked whether FTO preferentially demethylates m6Am in its natural sequence context as the first nucleotide adjacent to the m7G cap. To determine the specific structural elements of the extended cap that are required for efficient N6-demethylation of m6Am, we synthesized oligonucleotides with different 5′ ends indicated in boxes 1-7. Shown is the amount of product (Am for substrates 1, 2, 4, 5; A for substrates 3, 6, 7) generated by FTO (200 nM) after 30 min when incubated with different oligonucleotides (20 μM) containing m6Am or N6-methyladenosine (m6A). The highest FTO demethylation activity on was on the full cap1m structure m7Gpppm6Am (1). Removal of the N7-methyl from the guanosine (2) reduced FTO activity by 30% (2), whereas removal of either the 2′-O-methyl from the adenosine (3) or the m7G (4) resulted in a 50% activity loss. FTO activity was further reduced by removal of m7Gpp (5). The lowest FTO demethylation activity was observed when using m6A as a substrate, either at the +3 position after the cap (6) or internally in a GGACU context (7). Thus, an adjacent m7G cap does not activate m6A as a substrate for FTO. These results indicate that FTO activity is dependent on the presence of a full cap structure, including the 2′-O-methyl at the +1 position, whereas m6A is a poor substrate for FTO (one-way ANOVA with Tukey's post hoc test; *P< 0.001; n = 3 biological replicates; mean ± s.e.m.). b, Structure-activity relationship of FTO and its substrate. Shown is the amount of substrate converted by FTO in a time-dependent manner at the same reaction conditions as in a (two-way ANOVA with Tukey's post hoc test; *P < 0.001 versus all other structures; n = 3 biological replicates; mean ± s.e.m.). c, d, FTO demethylates m7Gpppm6Am at the N6-position through oxidization of m7Gpppm6Am to an N6-hydroxymethyl intermediate (m7Gppphm6Am). The final reaction product is m7GpppAm. Liquid chromatography/mass spectrometry analysis of m7Gpppm6Am RNA either left untreated (c; —FTO) or after incubation with 3 μM FTO for 10 min (d; +FTO). Shown are representative mass-to-charge (m/z) ratios of precursor ions. In the absence of FTO, the dinucleotide shows a measured m/z ratio of 813.1173, 0.98 p.p.m. mass accuracy from the exact m/z of 813.1165 (formula C23H33N10O17P3). Incubation with FTO generates m7Gppphm6Am, shown as a measured m/z of 829.1123, 1.01 p.p.m. mass accuracy from the exact m7Gppphm6Am m/z of 829.1114 (formula C23H33N10O18P3). The demethylated final product m7GpppAm and residual non-demethylated m7Gpppm6Am were also detected in the FTO reaction mixture, with m7GpppAm showing a measured m/z of 799.1064, 6.9 p.p.m. mass accuracy from the exact m/z of 799.1009 (formula C22H31N10O17P3).
Extended Data Figure 3
Extended Data Figure 3. 6Am is the preferred substrate for FTO in vivo
a, Modifications of the extended mRNA cap. The first nucleotide adjacent to the m7G and the 5′-to-5′-triphosphate (ppp) linker is subjected to 2′-O-methylation (orange) on the ribose, forming cap1. Cap1 can be further 2′-O-methylated at the second nucleotide to form cap2 (not depicted here). If cap1 contains a 2′-O-methyladenosine (Am), it can be further converted to cap1m by N6-methylation (blue), which results in N6,2′-O-dimethyladenosine (m6Am). b, Relative abundance of m6A in mRNA treated with recombinant FTO. Internal m6A residues that follow G in mRNA can be labelled and quantified in a 2D TLC method. The relative abundance of m6A versus (A + C + U) in 400 ng mRNA that was either left untreated (—FTO) or incubated for 1 h with 1 μM bacterially expressed recombinant human FTO (+FTO) was determined by 2D TLC. We did not observe any decrease of m6A in FTO-treated mRNA, indicating that FTO does not efficiently demethylate m6A in its physiological context in mRNA in vitro (representative images shown; n = 3 biological replicates; mean ± s.e.m.). c, FTO with a nuclear export signal is localized in the cytoplasm. Immunofluorescence staining of DDDDK/Flag tag in HEK293T cells transfected with Flag-tagged wild type FTO (Flag-FTO) or Flag-tagged FTO with an N-terminal nuclear export signal (NES-FTO). FTO is primarily nuclear while NES-FTO is readily detected in the cytosol. DAPI was used to stain nuclei (representative images shown). d, Western blot analyses were performed to verify successful knockdown, overexpression and knockout. Top left, cell extracts from HEK293T cells with FTO knockdown were blotted with anti-FTO antibody. Knockdown efficiency was approximately 75%. The cell extracts were from the same samples used for RNA-seq analysis in Fig. 3d. GAPDH was used as loading control. Top right, western blot analysis of HEK293T expressing Flag vector (Ctrl) or FTO with an N-terminal nuclear export signal (NES-FTO) that were used for RNA-seq half-life analysis in Fig. 3c. An antibody directed against β-actin was used as a loading control. The lower band represents endogenous FTO, whereas the upper band represents exogenous NES-FTO, which showed approximately tenfold overexpression. Top left, cell extracts from ALKBH5-knockdown HEK293T cells with were blotted with anti-ALKBH5 antibody. Knockdown efficiency was approximately 90%. The cell extracts were from the same samples used for RNA-seq analysis in Extended Data Fig. 7e. β-Actin was used as loading control. Top right, western blot analysis of three different HEK293T clonal lines with CRISPR-mediated knockout of DCP2 that were used for RNA-seq analysis. GAPDH was used as a loading control. e, FTO expression decreases m6Am in HEK293T cells. The relative abundance of modified adenosines in mRNA caps of HEK293T expressing Flag vector (Ctrl) or Flag-tagged FTO with an N-terminal nuclear export signal (Flag-NES-FTO) was determined by 2D TLC. When determining the ratio of m6Am to Am, we observed a significant decrease of m6Am in Flag-NES-FTO-overexpressing cells, indicating that FTO can convert cytoplasmic m6Am to Am in vivo. Notably, the ratios of m6Am:Am that we observed upon FTO expression (both with and without the NES) may under-represent the true effect of FTO: Am mRNAs are generally less stable than m6Am mRNAs owing to their degradation in cells via DCP2-mediated pathways (see Figs 3 and 4). Thus the Am mRNAs generated by FTO-mediated demethylation of m6Am may not efficiently accumulate in cells compared to m6Am mRNAs (representative images shown; n = 3 biological replicates; mean ± s.e.m.; unpaired Student's t-test, *P ≤ 0.01). f, FTO expression does not affect m6A in HEK293T cells. The relative abundance of m6A versus (A + C + U) in mRNA of HEK293T expressing empty vector (Ctrl) or FTO with an N-terminal nuclear export signal (NES-FTO) was determined by 2D TLC. We did not observe any decrease of m6A upon NES-FTO expression, indicating that FTO does not readily influence levels of m6A in HEK293T cells at this level of expression. Notably, under these same expression conditions, m6Am is readily demethylated (see Extended Data Fig. 3e) (representative images shown; n = 3 biological replicates; mean ± s.e.m.). Control experiments measuring m6A and m6Am levels following ALKBH5-knockdown and expression in HEK293T cells are shown in Extended Data Fig. 4. g, FTO deficiency increases m6Am in vivo. Relative abundance of modified adenosines in mRNA caps of embryonic day (E) 14 wild-type (WT) littermate controls and Fto knockout (Fto–/) mouse embryos (representative images shown; n = 3 biological replicates; mean ± s.e.m.; unpaired Student's t-test, **P≤ 0.01). h, FTO knockdown does not affect m6A in HEK293T cells. The relative abundance of m6A versus (A + C + U) in mRNA of HEK293T cells transfected with scrambled siRNA (siCtrl) or siRNA directed against FTO (siFTO) was determined by 2D TLC. We did not observe any increase of m6A upon FTO knockdown, indicating that FTO does not readily influence levels of m6A in vivo (representative images shown; n = 3 biological replicates; mean ± s.e.m.). i, Relative abundance of m6A in Fto-knockout mouse embryos. The relative abundance of m6A versus (A + C + U) in mRNA of embryonic day 14 wild-type littermate controls and Fto-knockout (Fto−/−) mouse embryos was determined by 2D TLC. We did not observe any increase of m6A in Fto-deficient embryos, indicating that FTO does not influence the levels of m6A in this embryonic stage (representative images shown; n = 3 biological replicates; mean ± s.e.m.).
Extended Data Figure 4
Extended Data Figure 4. ALKBH5 demethylates m6A but not m6Am in mRNA in HEK293T cells
a, ALKBH5 expression does not decrease m6Am in HEK293T cells. The relative abundance of modified adenosines in mRNA caps of HEK293T cells expressing GST vector (Ctrl) or ALKBH5 with an N-terminal GST tag (GST–ALKBH5) was determined by 2D TLC. When determining the ratio of m6Am to Am, we did not observe a significant decrease of m6Am in ALKBH5-overexpressing cells, indicating that ALKBH5 does not convert m6Am to Am in vivo (representative images show n; n = 3 biologic al replic ates; me an ± s.e.m.). b, ALKBH5 knockdown does not increase m6Am in HEK293T cells. The relative abundance of modified adenosines in mRNA caps of HEK293T cells transfected with scrambled siRNA (siCtrl) or siRNA directed against ALKBH5 (siALKBH5) was determined by 2D TLC. When determining the ratio of m6Am to Am, we did not observe a significant increase of m6Am in ALKBH5-expressing cells, indicating that ALKBH5 does not convert m6Am to Am in vivo (repres entative images shown; n = 3 biological replicates; mean ± s.e.m.). c, ALKBH5 knockdown increases m6A in HEK293T cells. The relative abundance of m6A versus (A + C + U) in mRNA of HEK293T cells transfected with scrambled siRNA (siCtrl) or siRNA directed against ALKBH5 (siALKBH5) was determined by 2D TLC. We observed an approximately 30% increase of m6A upon ALKBH5 knockdown, indicating that ALKBH5 readily influences the levels of m6A in vivo (representative images shown; n = 3 biological replicates; mean ± s.e.m.; unpaired Student's t-test, *P ≤ 0.05). d, ALKBH5 expression decreases m6A in HEK293T cells. The relative abundance of m6A versus (A + C + U) in mRNA of HEK293T cells expressing GST vector (Ctrl) or ALKBH5 with an N-terminal GST tag (GST-ALKBH5) was determined by 2D TLC. We observed a significant decrease of m6A upon ALKBH5 expression, indicating that SLKBH5 readily influences levels of m6A in vivo (representative images shown; n = 3 biological replicates; mean ± s.e.m.; unpaired Student's t-test, **P ≤ 0.01).
Extended Data Figure 5
Extended Data Figure 5. Newly mapped m6Am clusters overlap with transcription start sites (TSS) and the YYANW initiator core motif and mark mRNAs for increased half-life
a, b, To confirm that that the residues identified as m6Am in miCLIP reflect transcription initiation sites, we searched for known TSS and transcription initiation sequences around each m6Am-containing region. Notably, owing to the calling algorithm, these regions do not contain any 5′ UTR m6A. To identify genome-wide positions of the TSS we used published CAGE-seq datasets (see Methods). Shown is the nucleotide distance of the called m6Am from TSS (a) and YYANW (b). These results demonstrate that TSS and the YYANW core initiator sequence are highly clustered at m6Am-containing regions (5′-most nucleotide is at position 0 on the x-axis). This suggests that the called m6Am-containing regions reflect true TSS. c, Related to Fig. 3a, c. Correlation of half-life replicates derived from Flag-transfected (Ctrl, left scatter plot) or Flag-NES-FTO-transfected (NES-FTO, right scatter plot) HEK293T cells. The Pearson correlation coefficient (r) is shown for each comparison and indicates high correlation between replicates. d, mRNA stability is determined by the modification state of the first encoded nucleotide in HeLa cells. Cumulative distribution plot of the half-life for mRNAs that start with m6Am, Am, Cm, Gm and Um. The half-life of mRNAs starting with an m6Am is approximately 2.5 h longer compared to mRNAs starting with Am, Cm, Gm or Um. Notably, for this analysis we used m6Am mRNAs identified in HEK293T cells to analyse published half-life data sets from HeLa cells. This allowed us to determine if the stabilizing effect of m6Am on mRNA half-lives is conserved across different cell types. Indeed, the increase in m6Am mRNA half-life compared to other starting nucleotides was similar to what we observed in Fig. 3a (n = 2,401 (m6Am); 645 (Am); 1,310 (Cm); 988 (Gm); 1,533 (Um); data represents the average from two independent data sets; each box shows the first quartile, median, and third quartile; whiskers represent 1.5 × interquartile ranges; grey dots represent outliers; one-way ANOVA with Tukey's post hoc test, ***P<2.2 × 10⁻¹⁶ versus m6Am). e, related to Extended Data Fig. 6d, g. Correlation of half-life replicates derived from published HeLa cell datasets. The Pearson correlation coefficient (r) is shown and indicates high correlation between replicates. f, Stable mRNAs show enrichment of m6Am miCLIP reads in HEK293T cells. miCLIP involves recovery of RNA fragments that interact with a 6mA-specific antibody, and thus recover m6A- and m6Am-containing RNA fragments. The sequenced fragments, or miCLIP reads, map internally when they are m6A. However, m6Am maps at the 5′ ends of transcripts. To determine whether mRNAs with long half-life show m6Am enrichment, we performed metagene analysis of HEK293T cell-derived miCLIP tag distribution in mRNAs that are in the top quartile of mRNA stability (blue) and the bottom quartile of mRNA stability (orange). The miCLIP tag distribution of all mRNAs is shown as a grey dashed line. On all mRNAs, miCLIP reads were enriched around the stop codon, a pattern that reflects the typical distribution of m6A in mRNA. Additional enrichment of miCLIP reads was seen in the 5′ UTR, which we previously showed primarily reflects m6Am residues. However, when we examined mRNAs with a long half-life (≥ 10 h), we observed a pronounced enrichment of miCLIP reads in the 5′ UTR. In contrast, mRNAs with a short half-life (≤3 h) exhibit markedly fewer miCLIP reads in the 5′ UTR. These data suggest that m6Am is associated with increased mRNA stability (n = 10,123 (all mRNAs); 820 (short half-life); 2,871 (long half-life)). g, Stable mRNAs show enrichment of m6Am miCLIP reads in HeLa cells. Similar to f, however, for this analysis we used miCLIP reads derived from HEK293T cells to analyse published half-life datasets from HeLa cells. A marked enrichment of miCLIP reads was seen in the 5′ UTR of stable mRNAs, indicating elevated prevalence of m6Am in these mRNAs. These data suggest that m6Am is associated with increased mRNA stability, not only in HEK293T cells but also in HeLa cells. Importantly, the results are quantitatively similar to the results shown in f, indicating that m6Am mRNAs identified in HEK293T cells behave similarly in HeLa cells. (n = 18,286 (all mRNAs); 4,552 (short half-life); 3,619 (long half-life)).
Extended Data Figure 6
Extended Data Figure 6. m6Am mRNAs show increased translation efficiency
a, mRNA translation efficiency is associated with the modification state of the first encoded nucleotide in HEK293 cells. Cumulative distribution plot of the translation efficiency for mRNAs that start with m6Am, Am, Cm, Gm and Um. The translation efficiency of mRNAs starting with an m6Am is significantly higher compared to mRNAs starting wit h Am, Cm, Gm or Um (n = 3,024 (m6Am); 921 (Am); 1,788 (Cm); 1,351 (Gm); 2,008 (Um); data represent the average from two independent previously published ribosome profiling data sets; each box shows the first quartile, median, and third quartile; whiskers represent 1.5 × interquartile ranges; grey dots represent outliers; one-way ANOVA with Tukey's post hoc test, *P≤2.3 × 10⁻² versus m6Am). b, Correlation of translation efficiency replicates derived HEK293T cells. The Pearson correlation coefficient (r) is shown. c, Distribution of reads between the coding sequence (CDS) and UTRs. High coverage in the CDS compared to UTRs verifies ribosome-derived footprints. d, Total number of ribosome footprints near the start and stop codon of transcripts. e, Three-nucleotide periodicity demonstrates ribosome-derived footprints. f, Position of ribosome footprints relative to the reading frame.
Extended Data Figure 7
Extended Data Figure 7. Expression changes of m6Am, m6A and Am mRNAs upon NES-FTO expression and FTO or ALKBH5 deficiency
a, m6Am mRNAs exhibit increased half-life compared to Am mRNAs in vivo.HEK293T cells were electroporated with in vitro-synthesized mRNAsstarting with either of two extended caps: m7Gppp Am or m7Gpppm6Am.We then isolated cellular poly(A) RNA and determined the in vivo half-life of the electroporated Am- and m6Am-containing mRNA by qRT-PCR.In control siRNA-treated HEK293T cells (siCtrl), the m6Am mRNAshowed a trend towards increased half-life compared to the Am mRNA(unpaired Student's t-test, P = 0.08). Notably, when we performed the sameexperiment in FTO siRNA-treated cells (siFTO) to prevent demethylationof m6Am, the m6Am mRNA half-life was significantly increased (n = 3biological replicates; mean ± s.e.m.; unpaired Student's t-test, P ≤ 0.05). b, NES-FTO expression preferentially affects the half-life of m6Am mRNAscompared to m6A mRNAs. Changes in half-life of mRNAs containingeither m6Am or m6A in HEK293T cells transfected with either Flag vector(Ctrl) or FTO with an N-terminal nuclear export signal (NES-FTO)were determined by RNA-seq. m6Am mRNAs are generally long-lived (see Fig. 3a) and show reduced half-lives after NES–FTO expression. We asked if FTO could elicit a similar effect on mRNAs containing m6A. For this experiment, we used a set of mRNAs with annotated m6A residues, excluding those which also contain an annotated m6Am. NES-FTO expression reduced the half-life of m6Am mRNAs but did not have any substantial effect on the half-life of m6A mRNAs. These data support the idea that FTO preferentially targets m6Am compared to m6A (n = 2,049 (m6Am); 2,495 (m6A); data represent the average from two independent datasets; each box shows the first quartile, median, and third quartile; whiskers represent 1.5 × interquartile ranges; grey dots represent outliers; one-way ANOVA with Tukey's post hoc test, ***P ≤ 2.2 × 10⁻¹⁶ versus m6A). c, NES-FTO expression preferentially affects the half-life of m6Am mRNAs compared to Am mRNAs. Changes in half-life of Am mRNAs (FUCA1, PCK1, SCFD2) and m6Am mRNAs (PCNA, PSMD3, MAGOHB) in HEK293T cells transfected with either Flag vector (Ctrl) or FTO with an N-terminal nuclear export signal (NES-FTO) were determined by BrU pulse-chase analysis and subsequent qRT-PCR. m6Am mRNAs show a significant reduction in half-life after NES-FTO expression whereas the half-life of Am mRNAs is less affected. These data examine specific mRNAs in contrast to the whole-transcriptome analysis presented in Fig. 3c and also demonstrate the stabilization effect of m6Am using a different method to measure mRNA half-life (that is, BrU pulse-chase labelling) other than transcriptional inhibition (n = 3 biological replicates; mean ± s.e.m.; unpaired Student's t-test, *P ≤ 0.05, **P ≤ 0.01). d, The expression of mRNAs containing either m6Am or Am upon Fto knockout was determined by RNA-seq. FTO depletion (Fto−/−) results in increased abundance of mRNAs with an annotated m6Am residue in liver tissue derived from Fto-knockout mice. Fold change was measured relative to the RNA levels measured in the same tissue obtained from wild-type littermates (n = 2,048 (m6Am); 1,025 (Am); 2,081 (Cm); 1,742 (Gm); 1,242 (Um); data represent the average from two independent data sets; each box shows the first quartile, median, and third quartile; whiskers represent 1.5 × interquartile ranges; grey dots represent outliers; one-way ANOVA with Tukey's post hoc test, ***P ≤ 7.5 × 10⁻⁶ m6Am versus Am and Um). e, Knockdown of ALKBH5 does not increase the levels of m6Am mRNAs. The expression of mRNAs containing either m6Am or Am upon ALKBH5 knockdown in HEK293T cells was determined by RNA-seq. In contrast to knockdown or knockout of FTO, m6Am mRNAs are slightly less abundant than Am mRNAs in ALKBH5-knockdown cells. This suggests that ALKBH5 does not target m6Am-containing mRNAs in vivo (n = 3,111 (m6Am); 1,928 (Am); 4,382 (Cm); 3,110 (Gm); 3,998 (Um); data represent the average from two independent datasets; each box shows the first quartile, median, and third quartile; whiskers represent 1.5 × interquartile ranges; grey dots represent outliers; one-way ANOVA with Tukey's post hoc test, **P ≤ 1.2 × 10⁻³ m6Am versus Am and Um).
Extended Data Figure 8
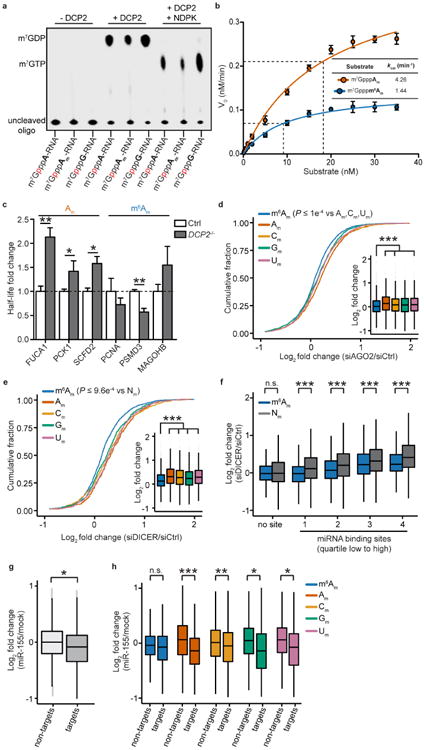
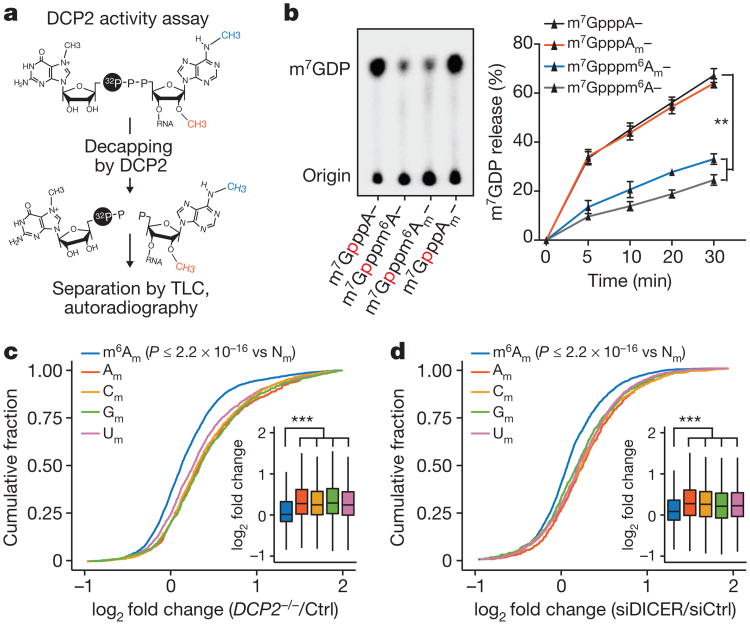
Extended Data Figure 8. m6Am mRNAs are resistant to DCP2-mediated decapping and microRNA-mediated gene silencing
a, DCP2 decapping products are m7GDP. Here we confirm the identity of the putative m7GDP decapping product in the decapping assay by treatment with nucleoside-diphosphate kinase (NDPK). The shift to the m7GTP position confirms that the released product is m7GDP. A cap-labelled RNA with a guanosine as the first nucleotide was used as a positive control (lanes 3, 6, 9; the red ‘p’ denotes the position of the 32P). b, Michaelis-Menten curves of 10 nM DCP2 reacting with m7Gpppm6Am (blue) or m7GpppAm (orange) for 30 min at 37 °C. DCP2 shows higher decapping activity towards m7GpppAm than to m7Gpppm6Am (the dashed lines indicate the Km on the × axis; n = 3 biological replicates; mean ± s.e.m.). c, DCP2 depletion preferentially stabilizes Am mRNAs compared to m6Am mRNAs. Changes in half-life of Am mRNAs (FUCA1, PCK1, SCFD2) and m6Am mRNAs (PCNA, PSMD3, MAGOHB) in HEK293T cells transfected with either Flag vector (Ctrl) or DCP2-knockout cells (DCP2−/−) were determined by BrU pulse-chase analysis and subsequent qRT-PCR. Am mRNAs show a significant increase in half-life after DCP2 depletion whereas the half-life of m6Am mRNAs was not significantly increased. These data are related to the whole-transcriptome expression analysis presented in Fig. 4c and indicate that, in addition to the observed abundance changes of non-m6Am mRNAs versus m6Am mRNAs, DCP2 also selectively affects the half-life of specifically examined mRNAs (n = 3 biological replicates; mean ± s.e.m.; unpaired Student's t-test, *P ≤ 0.05, **P ≤ 0.01). d, In Fig. 4d, we found that m6Am mRNAs show less upregulation upon DICER knockdown than mRNAs beginning with other nucleotides. We wanted to further examine this concept using additional independent datasets of gene expression following depletion of proteins required for microRNA-mediated mRNA degradation, such as members of the Argonaute protein family. Measurement of mRNA expression in AGO2-knockdown HEK293T cells (siAGO2) compared to control cells (siCtrl) revealed more pronounced upregulation of non-m6Am mRNAs compared to those that have m6Am (n = 2,080 (m6Am); 596 (Am); 1,085 (Cm); 805 (Gm); 1,274 (Um); data represent the average from two independent datasets; each box shows the first quartile, median, and third quartile; whiskers represent 1.5 × interquartile ranges; grey dots represent outliers; one-way ANOVA with Tukey's post hoc test, ***P ≤ 1 × 10⁻⁴ m6Am versus Am, Cm and Um). e, Similar to Fig. 4d, but here we only look at the expression changes of mRNAs that contain TargetScan-predicted microRNA-binding sites. Applying this filter criteria, we also observed that DICER knockdown in HEK293T cells (siDICER) resulted in more pronounced upregulation of non-m6Am miRNA target mRNAs compared to those that have m6Am (n = 1,208 (m6Am); 359 (Am); 607 (Cm); 467 (Gm); 713 (Um); data represent the average from two independent datasets; each box shows the first quartile, median, and third quartile; whiskers represent 1.5 × interquartile ranges; grey dots represent outliers; one-way ANOVA with Tukey's post hoc test, ***P ≤ 9.6 × 10⁻⁴ versus m6AmNm, where Nm = Am, Cm, Gm or Um). f, In Fig. 4d and Extended Data Fig. 8e we show that m6Am mRNAs exhibit less upregulation upon DICER knockdown than mRNAs beginning with other nucleotides. We wanted to examine this concept further using additional filtering criteria. Thus, we asked if m6Am mRNA resistance to DICER depletion is dependent on the number of microRNA-binding sites. Therefore, we divided mRNAs into five groups: mRNAs that do not contain a predicted microRNA-binding site (0) and mRNAs that belong to specific quartiles that we assigned depending on the number of microRNA-binding sites (low (1) to high (4)). Notably, we did not observe any expression difference between m6Am mRNAs and non-m6Am mRNAs that do not carry predicted microRNA-binding sites. However, there was a clear increase in mRNA expression for mRNAs that contain microRNA-binding sites, and this increase was dependent on the number of microRNA-binding sites. Notably, for each quartile, m6Am mRNAs were significantly less upregulated than Nm mRNAs (n = 91 versus 89 (m6Am versus Nm; 1), 252 versus 339 (m6Am versus Nm; 1), 311 versus 454 (m6Am versus Nm; 2), 247 versus 541 (m6Am versus Nm; 3), 229 versus 512 (m6Am versus Nm; 4); data represent the average from two independent datasets; number of microRNA-binding sites in each quartile: 1 = 1–3; 2 = 4-6; 3 = 7–12; 4 = 13-54; each box shows the first quartile, median, and third quartile; whiskers represent 1.5 × interquartile ranges; one-way ANOVA with Tukey's post hoc test, *P ≤ 0.05, ***P ≤ 0.001, n.s., not significant). g, In Fig. 4d and Extended Data Fig. 9d-f we show that m6Am mRNAs are largely resistant to expression changes upon global inhibition of the microRNA machinery. We next asked whether introduction of a single microRNA also leads to differential responses of m6Am mRNAs compared to non-m6Am mRNAs. We used a published dataset where HeLa cells were transfected with a miR-155 duplex to achieve microRNA-specific mRNA degradation. For this analysis, we used m6Am mRNAs mapped in HEK293T cells. We first asked if we could observe a differential effect of mRNA degradation on miR-155 target and non-target mRNAs in the HeLa cell dataset. Indeed, miR-155 target mRNAs were significantly more suppressed in miR-155-transfected HeLa cells. This confirms that miR-155 target mRNA degradation can be detected in this dataset (n = 1,131 (target); 7,700 (non-target; data represent the average from two independent datasets; each box shows the first quartile, median, and third quartile; whiskers represent 1.5 × interquartile ranges; grey dots represent outliers; one-way ANOVA with Tukey's post hoc test, **P ≤ 2.2 × 10⁻¹⁶). h, m6Am mRNAs show resistance to miR-155-mediated mRNA degradation. We tested if the identity of the first nucleotide affects the response of miR-155 target mRNAs to miR-155-mediated mRNA degradation. We observed that miR-155 target mRNAs that start with m6Am show no significant suppression upon miR-155 transfection compared to non-target mRNAs that start with m6Am. However, expression of miR-155 target mRNAs that start with Am, Cm, Gm or Um was significantly suppressed compared to non-target mRNAs that start with Am, Cm, Gm or Um. These data suggest that the presence m6Am can reduce the silencing efficiency of a single microRNA in vivo (n = 1,714 versus 232 (m6Am, non-target versus target); 953 versus 158 (Am, non-target versus target); 1,848 versus 281 (Cm, non-target versus target); 1,394 versus 182 (Gm); 1,809 versus 278 (Um, non-target versus target); each box shows the first quartile, median, and third quartile; whiskers represent 1.5 × interquartile ranges; one-way ANOVA with Tukey's post hoc test, *P ≤ 0.05 non-target versus miR-155 target, **P ≤ 0.01 non-target versus miR-155 target, ***P ≤ 0.001 non-target versus miR-155 target).
Extended Data Figure 9
Extended Data Figure 9. m6Am-containing mRNAs are enriched for oxidative phosphorylation, metabolic pathways, and components of the RNA processing machinery
Gene Ontology (GO) analysis of m6Am mRNAs. We used PANTHER overrepresentation test and Bonferroni correction with a P value threshold of <0.01. All annotated non-m6Am-containing mRNAs (Nm) were used as the background gene list. m6Am mRNAs are overrepresented in cellular pathways associated with oxidative phosphorylation and metabolism as well as mRNA processing and translation, suggesting that m6Am controls cellular pathways by stabilizing specific populations of mRNAs.
Figure 1
Figure 1. FTO prefers m6Am to m6A as a substrate
a , Modifications of the extended mRNA cap. The first nucleotide (here shown as adenosine) adjacent to the m7G and the 5′-to-5′ triphosphate (ppp) linker is subjected to 2′-O-methylation (orange) on the ribose, forming cap1. Cap1 can be further 2′-O-methylated at the second nucleotide to form cap2 (not depicted). 2′-O-methyladenosine (Am) can be further converted to cap1m by N6-methylation (blue), which results in N6,2′-O-dimethyladenosine (m6Am). b, FTO efficiently converts m6Am to Am. A synthetic oligonucleotide with a 5′-m7Gpppm6Am (2 μM) was incubated with FTO (100 nM FTO, 1 h), which readily converted m6Am to Am (representative high-performance liquid chromatography (HPLC) track of n = 3 biological replicates). mAU, milli absorbance units. c, FTO preferentially demethylates m6Am compared to m6A. An oligonucleotide with a 5′-m7Gpppm6Am cap was mixed in an equimolar ratio with an oligonucleotide containing internal m6A. FTO (100 nM, 1 h) almost completely converted m6Am to Am. Demethylation of m6A was not detectable (representative HPLC track of n = 3 biological replicates). d, Michaelis-Menten kinetics of FTO for m6Am and m6A. Owing to the increased activity of FTO with m6Am compared to m6A, enzyme concentration was tenfold lower for m6Am (20 nM FTO for m6Am, 200 nM FTO for m6A). The data was normalized to enzyme concentration (m7Gpppm6Am (blue), m7GpppACm6A (orange), internal m6A (green); n = 3 biological replicates; mean ± s.e.m; V0 = initial reaction velocity).
Figure 2
Figure 2. m6Am is the preferred substrate of FTO in vivo
a, FTO readily demethylates m6Am in mRNA. Relative abundance of modified adenosines in mRNA caps derived from mRNA treated with FTO (1 μM, 1 h; representative images shown; n = 3 biological replicates; mean ± s.e.m.; unpaired Student's t-test, **P≤; 0.001). b, FTO expression decreases m6Am in HEK293T cells. Relative abundance of modified adenosines in mRNA caps of HEK293T cells expressing GFP (Flag-GFP) or wild-type FTO (Flag-FTO) (representative images shown; n = 3 biological replicates; mean ± s.e.m.; unpaired Student's t-test, *P ≤ 0.05). c, FTO knockdown increases m6Am in HEK293T cells. Relative abundance of modified adenosines in mRNA caps of HEK293T cells transfected with scrambled siRNA (siCtrl) or siRNA directed against FTO (siFTO) (representative images shown; n = 3 biological replicates; mean ± s.e.m.; unpaired Student's t-test, *P≤ 0.05).
Figure 3
Figure 3. The presence of m6Am is associated with increased mRNA half-life
a , mRNA stability is determined by the first encoded nucleotide in HEK293T cells. Cumulative distribution plot of the half-life for mRNAs that start with m6Am, Am, Cm, Gm and Um (n = 2,515 (m6Am); 762 (Am); 1,442 (Cm); 1,119 (Gm); 1,486 (Um); data represent the average from two independent datasets; each box shows the first quartile, median, and third quartile; whiskers represent 1.5 × interquartile ranges; one-way ANOVA with Tukey's post hoc test, ***P ≤ 2 × 10⁻⁸ versus m6Am; Nm = Am, Cm, Gm or Um). b, mRNA expression level is influenced by the modification state of the first encoded nucleotide in HEK293T cells. Cumulative distribution plot of the expression for mRNAs that start with m6Am, Am, Cm, Gm and Um (n = 2,536 (m6Am); 1,063 (Am); 2,098 (Cm); 1,577 (Gm); 2,071 (Um); data represent the average from two independent datasets; each box shows the first quartile, median, and third quartile; whiskers represent 1.5 × interquartile ranges; one-way ANOVA with Tukey's post hoc test, ***P ≤ 2.2 × 10⁻¹⁶ versus m6Am). c, FTO expression leads to a global decrease of m6Am mRNA half-life in HEK293T cells. Changes in half-life of mRNAs containing either m6Am or Am in cells transfected with either Flag vector (Ctrl) or FTO with an N-terminal nuclear export signal (NES-FTO) (n = 2,049 (m6Am); 951 (Am); 1,442 (Cm); 1,119 (Gm); 1,486 (Um); data represent the average from two independent datasets; each box shows the first quartile, median, and third quartile; whiskers represent 1.5 × interquartile ranges; one-way ANOVA with Tukey's post hoc test, **P ≤ 4.6 × 10⁻³ versus m6Am). d, FTO knockdown leads to a global increase of m6Am mRNAs in HEK293T cells. Expression of mRNAs containing either m6Am or Am upon FTO knockdown (n = 3,410 (m6Am); 1,355 (Am); 2,636 (Cm); 1,994 (Gm); 2,558 (Um); data represent the average from two independent mRNA expression datasets; each box shows the first quartile, median, and third quartile; whiskers represent 1.5 × interquartile ranges; one-way ANOVA with Tukey's post hoc test **P ≤ 7.4 × −3 m6Am versus Am and Um).
Figure 4
Figure 4. m6Am mRNAs are resistant to DCP2-mediated decapping
a, Schematic representation of the DCP2 in vitro decapping assay. The 5′ end of oligonucleotides containing the indicated form of adenosine (A, Am, m6A or m6Am) was enzymatically capped with [α-32P]-m7GTP. DCP2 causes the release of [α-32P]-m7GDP, which is detected by TLC. b, N6-methylation of the cap-adjacent adenosine inhibits mRNA decapping in vitro. The presence of a 2′-O-methyl did not affect DCP2 activity relative to adenosine. However, addition of an N6-methyl group decreased decapping efficiency (n = 3 biological replicates; mean ± s.e.m.; two-way ANOVA with Tukey's post hoc test, **P≤ 0.01). c, DCP2 deficiency primarily increases expression of non-m6Am mRNAs in the HEK293T cell transcriptome. Cumulative distribution plot of the expression of mRNAs that start with m6Am, Am, Cm, Gm and Um (n = 3,287 (m6Am); 2,350 (Am); 3,963 (Cm); 3,540 (Gm); 3,496 (Um); data represent the average from two independent datasets; each box shows the first quartile, median, and third quartile; whiskers represent 1.5 × interquartile ranges; one-way ANOVA with Tukey's post hoc test, **P ≤ 2.2 × 10⁻¹⁶ versus m6Am). d, m6Am reduces mRNA susceptibility to microRNA-mediated degradation. Cumulative distribution plot of the expression of mRNAs that start with m6Am, Am, Cm, Gm or Um (n = 2,090 (m6Am); 623 (Am); 1,109 (Cm); 852 (Gm); 1,322 (Um); data represent the average from two independent datasets; each box shows the first quartile, median, and third quartile; whiskers represent 1.5 × interquartile ranges; one-way ANOVA with Tukey's post hoc test, **P≤2.2 × 10⁻¹⁶ versus m6Am).

Comment in

References

    1. Meyer KD, et al. Comprehensive analysis of mRNA methylation reveals enrichment in 3′ UTRs and near stop codons. Cell. 2012;149:1635–1646. - PMC - PubMed
    1. Dominissini D, et al. Topology of the human and mouse m6A RNA methylomes revealed by m6A-seq. Nature. 2012;485:201–206. - PubMed
    1. Zheng G, et al. ALKBH5 is a mammalian RNA demethylase that impacts RNA metabolism and mouse fertility. Mol Cell. 2013;49:18–29. - PMC - PubMed
    1. Jia G, et al. N6-methyladenosine in nuclear RNA is a major substrate of the obesity-associated FTO. Nat Chem Biol. 2011;7:885–887. - PMC - PubMed
    1. Adams JM, Cory S. Modifed nucleosides and bizarre 5′-termini in mouse myeloma mRNA. Nature. 1975;255:28–33. - PubMed

Publication types

MeSH terms