. 2017 Jan 5;541(7635):81-86.
doi: 10.1038/nature20784. Epub 2016 Dec 21.

Epigenome-wide association study of body mass index, and the adverse outcomes of adiposity

Simone Wahl  1   2   3 Alexander Drong  4 Benjamin Lehne  5 Marie Loh  5   6   7 William R Scott  5   8 Sonja Kunze  1   2 Pei-Chien Tsai  9 Janina S Ried  10 Weihua Zhang  5   11 Youwen Yang  5 Sili Tan  12 Giovanni Fiorito  13   14 Lude Franke  15 Simonetta Guarrera  13   14 Silva Kasela  16   17 Jennifer Kriebel  1   2   3 Rebecca C Richmond  18 Marco Adamo  19 Uzma Afzal  5   11 Mika Ala-Korpela  20   21   22 Benedetta Albetti  23 Ole Ammerpohl  24 Jane F Apperley  25 Marian Beekman  26 Pier Alberto Bertazzi  23 S Lucas Black  27 Christine Blancher  28 Marc-Jan Bonder  15 Mario Brosch  29 Maren Carstensen-Kirberg  3   30 Anton J M de Craen  31 Simon de Lusignan  32 Abbas Dehghan  33 Mohamed Elkalaawy  19   34 Krista Fischer  16 Oscar H Franco  33 Tom R Gaunt  18 Jochen Hampe  29 Majid Hashemi  19 Aaron Isaacs  33 Andrew Jenkinson  19 Sujeet Jha  35 Norihiro Kato  36 Vittorio Krogh  37 Michael Laffan  25 Christa Meisinger  2 Thomas Meitinger  38   39   40 Zuan Yu Mok  12 Valeria Motta  23 Hong Kiat Ng  12 Zacharoula Nikolakopoulou  41 Georgios Nteliopoulos  25 Salvatore Panico  42 Natalia Pervjakova  16   17 Holger Prokisch  38   39 Wolfgang Rathmann  43 Michael Roden  3   30   44 Federica Rota  23 Michelle Ann Rozario  12 Johanna K Sandling  45   46 Clemens Schafmayer  47 Katharina Schramm  38   39 Reiner Siebert  24   48 P Eline Slagboom  26 Pasi Soininen  20   21 Lisette Stolk  49 Konstantin Strauch  10   50 E-Shyong Tai  51   52   53 Letizia Tarantini  23 Barbara Thorand  2   3 Ettje F Tigchelaar  15 Rosario Tumino  54 Andre G Uitterlinden  55 Cornelia van Duijn  33 Joyce B J van Meurs  49 Paolo Vineis  13   56 Ananda Rajitha Wickremasinghe  57 Cisca Wijmenga  15 Tsun-Po Yang  45 Wei Yuan  9   58 Alexandra Zhernakova  15 Rachel L Batterham  19   59 George Davey Smith  18 Panos Deloukas  45   60   61 Bastiaan T Heijmans  26 Christian Herder  3   30 Albert Hofman  33 Cecilia M Lindgren  4   62 Lili Milani  16 Pim van der Harst  15   63   64 Annette Peters  2   3   40 Thomas Illig  1   2   65   66 Caroline L Relton  18 Melanie Waldenberger  1   2 Marjo-Riitta Järvelin  67   68   69   70 Valentina Bollati  23 Richie Soong  12   71 Tim D Spector  9 James Scott  8 Mark I McCarthy  4   72   73 Paul Elliott  5   74 Jordana T Bell  9 Giuseppe Matullo  13   14 Christian Gieger  1   2 Jaspal S Kooner  8   11   74 Harald Grallert  1   2   3 John C Chambers  5   11   74   75
Affiliations

Epigenome-wide association study of body mass index, and the adverse outcomes of adiposity

Simone Wahl et al. Nature. .

Abstract

Approximately 1.5 billion people worldwide are overweight or affected by obesity, and are at risk of developing type 2 diabetes, cardiovascular disease and related metabolic and inflammatory disturbances. Although the mechanisms linking adiposity to associated clinical conditions are poorly understood, recent studies suggest that adiposity may influence DNA methylation, a key regulator of gene expression and molecular phenotype. Here we use epigenome-wide association to show that body mass index (BMI; a key measure of adiposity) is associated with widespread changes in DNA methylation (187 genetic loci with P < 1 × 10⁻⁷, range P = 9.2 × 10⁻⁸ to 6.0 × 10-46; n = 10,261 samples). Genetic association analyses demonstrate that the alterations in DNA methylation are predominantly the consequence of adiposity, rather than the cause. We find that methylation loci are enriched for functional genomic features in multiple tissues (P < 0.05), and show that sentinel methylation markers identify gene expression signatures at 38 loci (P < 9.0 × 10⁻⁶, range P = 5.5 × 10⁻⁶ to 6.1 × 10⁻³⁵, n = 1,785 samples). The methylation loci identify genes involved in lipid and lipoprotein metabolism, substrate transport and inflammatory pathways. Finally, we show that the disturbances in DNA methylation predict future development of type 2 diabetes (relative risk per 1 standard deviation increase in methylation risk score: 2.3 (2.07-2.56); P = 1.1 × 10-54). Our results provide new insights into the biologic pathways influenced by adiposity, and may enable development of new strategies for prediction and prevention of type 2 diabetes and other adverse clinical consequences of obesity.


Conflict of interest statement

Competing interests

None

Figures

Extended Data Figure 1
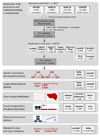
Extended Data Figure 1. Study design.
Epigenome-wide association and replication testing was performed in order to identify methylation sites associated with adiposity. In the discovery step, four large cohorts were included with Illumina 450k DNA methylation data available, which were preprocessed and quality controlled according to a harmonized protocol. Epigenome-wide association was performed in every single study with BMI as response variable and methylation β-value as independent variable, adjusting for covariates as described in the Online Methods. At a genome-wide significance level of P<1x10⁻⁷, 278 methylation sites from 207 regions were identified. In the replication step, 187 of these replicated in independent samples. Genetic association and causality analyses were used in order to investigate whether the identified methylation signals underlie the development of adiposity or are the consequence of adiposity. The findings were supported with the help of longitudinal analyses. The cross-tissue analyses represent a first step towards extending our observations in blood to metabolically relevant tissues. The functional genomics and gene expression analyses help to link the observed methylation associations to transcriptional outcomes, while the gene-set enrichment analysis provides a way to summarize the potentially affected metabolic pathways. Finally, we study the relationships of methylation to adiposity related metabolic traits and type 2 diabetes to address the clinical relevance of our findings.
Extended Data Figure 2
Distribution of methylation values at the 187 sentinel CpG sites compared to the ~473K CpG sites assayed by the Illumina Infinium 450K Human Methylation array. The 187 identified methylation-BMI associations are strongly enriched for CpG sites with intermediate levels of methylation, consistent with the presence of epigenetic heterogeneity at these loci in blood (157/187 sites with 20-80% methylation, a 3.0-fold enrichment compared to microarray background, P=1.4x10⁻²² Fisher’s test).
Extended Data Figure 3
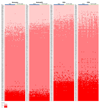
DNA methylation at the sentinel CpG sites in whole blood and in 4 isolated cell subsets (Monocytes, Neutrophils, CD4+, CD8+) from 60 individuals (30 obese cases, and 30 normal weight controls) by Illumina MethylationEPIC array, which quantifies 179 of the 187 sentinel markers. Results are shown as a heatmap, coded by methylation value (hypomethylation <0.2; intermediate methylation 0.2-0.8, hypermethylation >0.8). Results show the presence of intermediate methylation (and hence epigenetic heterogeneity) at the majority of loci, and in the majority of cell types, in both cases and controls.
Extended Data Figure 4
Association of DNA methylation with obesity in the 4 cell subsets studied, based on quantification of methylation at 179 of the sentinel methylation markers amongst 30 obese cases and 30 normal weight controls. Results are presented as QQ plots of the observed association test statistics in each of the isolated cell subsets.
Extended Data Figure 5
Comparison of effect sizes between isolated white cell subsets. Results are presented as the difference in methylation between obese cases and normal weight controls (Methylation in cases – methylation in controls, in absolute terms on % scale) in the respective isolated white cell subset (y axis) compared to the average case-control difference across all 4 cell subsets studied (x axis).
Extended Data Figure 6
Mean methylation levels at the 187 sentinel methylation markers associated with BMI, across 7 tissue types (blood: N=6; liver: N=5, muscle: N=6, omentum: N=6, pancreas: N=4, subcutaneous (SC) fat: N=6, spleen: N=3). The lower panel displays pairwise scatterplots (trendline in red), while the upper panel shows the Pearson correlation coefficient and P values.
Extended Data Figure 7
Causality analysis in adipose tissue to investigate the potential relationships between BMI and DNA methylation. Left panel: Causality analysis in adipose tissue investigating whether DNA methylation at sentinel CpG sites influences BMI. Units are change in BMI per copy of effect allele. For each sentinel CpG site we determined i. the effect of a previously identified cis-SNP on BMI predicted via methylation (x-axis), ii. the directly observed effect of SNP on BMI (y-axis). No CpG passed multiple testing correction for all three comparisons. Overall there was little relationship between the effects of SNPs on BMI predicted via methylation and the directly observed effect (R=-0.04 P=0.58). Right panel: Causality analysis in adipose tissue investigating whether DNA methylation at sentinel CpG sites is the consequence of BMI. Units are change in methylation per unit change in weighted genetic risk score (GRS). We identified SNPs reported to influence BMI in GWAS meta-analysis, and calculated a weighted GRS. For each sentinel CpG site we then determined i. the effect of GRS on methylation predicted via BMI (x-axis) and ii. the directly observed effect of GRS on methylation (y-axis). No CpG passed multiple testing correction for all three comparisons. The overall correlation between observed and predicted effects (R=0.73; P=1.6 x 10⁻³²) replicates our findings in blood that methylation at the majority of CpG-sites is consequential to BMI.
Extended Data Figure 8
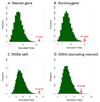
The 187 sentinel CpGs are enriched for association with gene-expression in cis in blood. To derive an expectation under the null-hypothesis we generated 10,000 sets of matched CpGs (matched for mean methylation and for SD of methylation, see Online Methods), and tested their association with expression of A) the nearest gene, B) the gene allocated to the CpG by the Illumina annotation, C) all genes within a 500 kb distance and D) all genes within a 500 kb distance excluding the nearest gene. We observe significantly more expression-probes associated with the sentinel markers (red arrow) in blood compared to the 10,000 permuted sets (green bars).
Extended Data Figure 9
Extended Data Figure 9. Summary statistics for the causality analyses investigating the relationship between DNA methylation in blood and metabolic disturbances.
Panel A. DNA methylation in blood as a potential determinant of the metabolic disturbances associated with adiposity (causal analysis). For each of the sentinel CpG sites we identified the cis-SNP (1Mb) most closely associated with DNA methylation levels. For each of the SNPs we then determined i. the effect of SNP on phenotype predicted via methylation, ii. the directly observed effect of SNP on phenotype. Results are presented as the R2 between phenotype specific observed and predicted effects across the 187 CpG sites, calculated using linear regression. Panel B. DNA methylation in blood as a potential consequence of the metabolic disturbances associated with adiposity (consequential analysis). We identified the SNPs reported to influence each phenotypic trait (using the most recent GWAS meta-analysis, Supplementary Table 24), and calculated phenotype specific weighted genetic risk scores (GRS). For each of the CpG sites, and each of the phenotypes, we then determined i. the effect of GRS on methylation predicted via phenotype, with ii. the directly observed effect of GRS on methylation. Results are presented as the R2 between phenotype specific observed and predicted effects across the 187 CpG sites, calculated using linear regression. P values are shown for correlations between observed and predicted effects that reach P<0.05.
Extended Data Figure 10
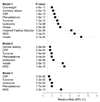
Association of established and emergent biomarkers with T2D. Results are presented as risk of T2D associated with the specified biomarkers in three models: i. Model 1 – adjusted for age and sex; ii. Model 2 – as for Model 1, but additionally for body mass index and impaired fasting glucose; iii. Model 3 – as for Model 2, but additionally for central obesity and insulin concentrations. CRP: C-reactive protein; MRS: methylation risk score. Results for quantitative traits (amino acids, CRP, insulin, MRS) are presented as risk of T2D in Q4 compared to Q1.
Figure 1
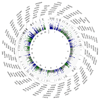
Figure 1
Circos plot of the epigenome-wide association of DNA methylation in blood with BMI. Results are presented as CpG specific association test results [-log10(P)] ordered by genomic position. Green and blue symbols: CpG sites at loci reaching epigenome wide significance (P<1x10⁻⁷); grey symbols: CpG sites at loci not reaching epigenome-wide significance. Chromosome numbers are shown on the inner ring. Tick marks on the outer ring identify the genomic loci reaching epigenome-wide significance. The genes nearest to the sentinel methylation markers at each of the 187 loci are listed around the circos plot.
Figure 2
Figure 2
Genetic association studies to investigate the potential relationships between BMI and DNA methylation in blood. 2A. Causal analysis shows results for a causality analysis investigating whether DNA methylation in blood at the sentinel CpG sites influences BMI. Units are change in BMI per copy of effect allele. For each sentinel CpG site we identified the cis-SNP (1Mb) most closely associated with DNA methylation levels. For each SNP we then determined i. the effect of SNP on BMI predicted via methylation (x-axis), ii. the directly observed effect of SNP on BMI (y-axis). Grey points represent CpGs not significantly associated with a SNP; blue points represent CpGs significantly associated with a SNP. For a single CpG (NFATC2IP) the associated SNP is also associated with BMI and 95% confidence interval error bars are shown. At the other loci there was little relationship between the effects of the SNPs on BMI predicted via methylation and that directly observed (R2=0.00, P=0.86). 2B. Consequential analysis shows results for a causality analysis investigating whether DNA methylation in blood at the sentinel CpG sites is the consequence of BMI. Units are change in methylation per unit change in weighted genetic risk score (GRS). We identified the SNPs reported to influence BMI in GWAS meta-analysis, and calculated a weighted GRS (see Online Methods). For each sentinel CpG site we then determined i. the effect of GRS on methylation predicted via BMI (x-axis) and ii. the directly observed effect of GRS on CpG (y-axis). Three CpGs (ABCG1, KLHL18, FTH1P20) are associated with the GRS at P<2.7x10⁻⁴ (P<0.05 after Bonferroni correction for 187 tests; 95% confidence interval error-bars shown). The overall correlation between observed and predicted effects (R2=0.81; P=4.7 x 10-44) suggests that methylation in blood at the majority of CpG-sites is consequential to BMI.
Figure 3
Figure 3
Relationship between DNA methylation in blood and BMI amongst 1,435 participants of the KORA S4/F4 population cohort. Cross-sectional results (x-axis) are for the relationship between methylation in blood and BMI at each of the 187 sentinel CpG sites in the baseline samples; longitudinal results are for the relationship between change in methylation (in blood) and change in BMI after 7 year follow-up. Units for both axes are kg/m2 change in BMI per unit increase in methylation (scale 0-1, where 1 represents 100% methylation).
Figure 4
Figure 4
Relative risk of incident T2D by quartile of Methylation Risk Score amongst normoglycaemic Indian Asians (HbA1c<6% and fasting glucose<6mmol/l) with normal weight (BMI 18.5-24.9kg/m2), overweight (BMI 25.0-29.9kg/m2) and obese (BMI ≥30.0kg/m2). The P value is for the interaction between adiposity and DNA methylation on risk of T2D.

Comment in

References

    1. Wang YC, McPherson K, Marsh T, Gortmaker SL, Brown M. Health and economic burden of the projected obesity trends in the USA and the UK. Lancet. 2011;378:815–825. doi: 10.1016/S0140-6736(11)60814-3. - DOI - PubMed
    1. Ng M, et al. Global, regional, and national prevalence of overweight and obesity in children and adults during 1980-2013: a systematic analysis for the Global Burden of Disease Study 2013. Lancet. 2014;384:766–781. doi: 10.1016/S0140-6736(14)60460-8. - DOI - PMC - PubMed
    1. Dick KJ, et al. DNA methylation and body-mass index: a genome-wide analysis. Lancet. 2014;383:1990–1998. doi: 10.1016/S0140-6736(13)62674-4. - DOI - PubMed
    1. Feinberg AP, et al. Personalized epigenomic signatures that are stable over time and covary with body mass index. Science translational medicine. 2010;2:49ra67. doi: 10.1126/scitranslmed.3001262. - DOI - PMC - PubMed
    1. Xu X, et al. A genome-wide methylation study on obesity: differential variability and differential methylation. Epigenetics : official journal of the DNA Methylation Society. 2013;8:522–533. doi: 10.4161/epi.24506. - DOI - PMC - PubMed

MeSH terms

Substances