. 2016 Dec 21;11(12):e0168411.
doi: 10.1371/journal.pone.0168411. eCollection 2016.

Investigating the Potential Signaling Pathways That Regulate Activation of the Novel PKC Downstream of Serotonin in Aplysia

Affiliations

Investigating the Potential Signaling Pathways That Regulate Activation of the Novel PKC Downstream of Serotonin in Aplysia

Carole A Farah et al. PLoS One. .

Abstract

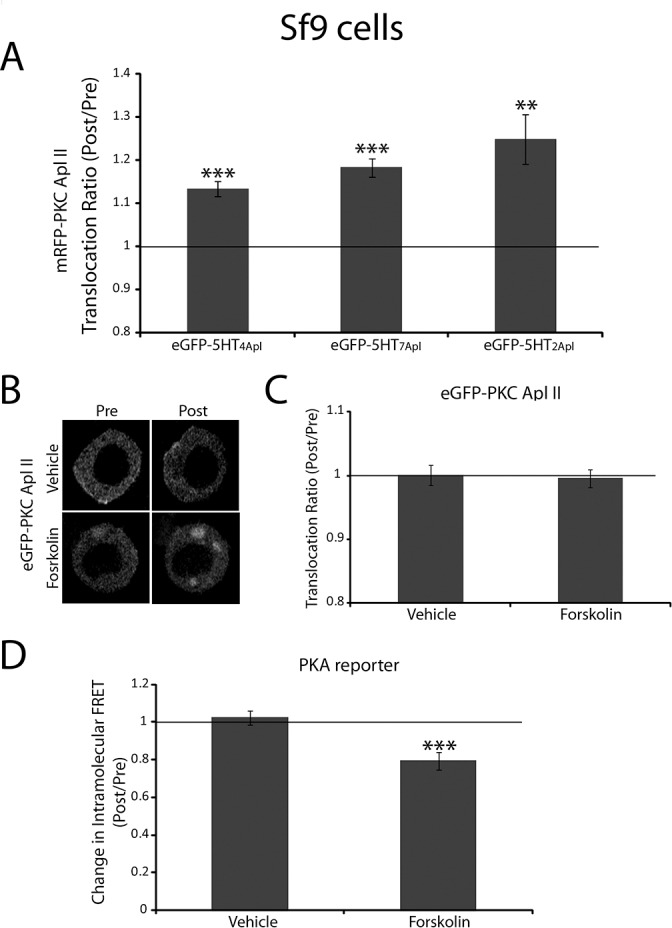
Activation of the novel PKC Apl II in sensory neurons by serotonin (5HT) underlies the ability of 5HT to reverse synaptic depression, but the pathway from 5HT to PKC Apl II activation remains unclear. Here we find no evidence for the Aplysia-specific B receptors, or for adenylate cyclase activation, to translocate fluorescently-tagged PKC Apl II. Using an anti-PKC Apl II antibody, we monitor translocation of endogenous PKC Apl II and determine the dose response for PKC Apl II translocation, both in isolated sensory neurons and sensory neurons coupled with motor neurons. Using this assay, we confirm an important role for tyrosine kinase activation in 5HT mediated PKC Apl II translocation, but rule out roles for intracellular tyrosine kinases, epidermal growth factor (EGF) receptors and Trk kinases in this response. A partial inhibition of translocation by a fibroblast growth factor (FGF)-receptor inhibitor led us to clone the Aplysia FGF receptor. Since a number of related receptors have been recently characterized, we use bioinformatics to define the relationship between these receptors and find a single FGF receptor orthologue in Aplysia. However, expression of the FGF receptor did not affect translocation or allow it in motor neurons where 5HT does not normally cause PKC Apl II translocation. These results suggest that additional receptor tyrosine kinases (RTKs) or other molecules must also be involved in translocation of PKC Apl II.


Conflict of interest statement

The authors have declared that no competing interests exist.

Figures

Fig 1
Fig 1. Adenylate cyclase activation does not cause translocation of PKC Apl II in response to 5HT in Sf9 cells.
A) Sf9 cells were cotransfected with mRFP-PKC Apl II along with either eGFP-5HT4Apl (n = 17), eGFP-5HT7Apl (n = 15) or eGFP-5HT2Apl (n = 9). Cells were treated with 5HT (10 μM) for 5 min and PKC Apl II translocation ratio (Post/Pre treatment) was quantified as described in methods. The bar graph shows the average of the translocation ratios measured at 60, 90, 120 and 150 sec after the addition of 5HT to the dish normalized to the Pre 5HT group. A paired Student’s t test was used to compare translocation post 5HT to pre 5HT for each group, ***p<0.001, **p<0.01 after correction for multiple tests with Bonferroni correction. Error bars indicate SEM. B) Representative confocal fluorescence images of Sf9 cells expressing eGFP-PKC Apl II before forskolin (100 μM) treatment or 6 min following forskolin (100 μM) treatment. C) The translocation ratio (Post/Pre) was quantified for the cells shown in B. No translocation was noted for the forskolin group (n = 12) or the vehicle group (n = 9). D) Change in intramolecular FRET (Post/Pre) was calculated for Sf9 cells co-expressing the regulatory subunit of PKA tagged with CFP (RII-CFP) and the catalytic subunit tagged with YFP (C-YFP) that were treated either with vehicle (n = 9) or with forskolin (100 μM; n = 10) for 4 min. cAMP production downstream of forskolin treatment and its binding to the regulatory subunits of PKA causes dissociation of the regulatory and catalytic subunits of PKA leading to a loss of FRET. A paired Student’s t test was used to compare the FRET ratio Post-treatment to Pre-treatment for each condition. Forskolin treatment caused a significant decrease of the FRET ratio, ***p<0.001. Error bars indicate SEM.
Fig 2
Fig 2. Concentration dependence of serotonin induced translocation of endogenous PKC Apl II in the cell body and the processes of isolated sensory neurons and co-cultures of sensory and motor neurons.
A) The top panel shows the quantification of PKC Apl II membrane enrichment in isolated sensory neurons (shown in the bottom panel) treated with serotonin concentrations of 0 μM (n = 26 cells), 0.1 μM (n = 33 cells), 1 μM (n = 59 cells), 5 μM (23 cells) and 10 μM (n = 30 cells) and included results from three independent experiments. Cells were treated with 5HT for 5 min and then fixed and processed for immunocytochemistry using an anti-PKC Apl II antibody as described in methods. For each experiment, membrane enrichment ratio was subtracted from the membrane enrichment ratio in the vehicle group (5HT concentration of 0 μM) and then normalized to the membrane enrichment ratio in the 5HT (10 μM) group. A Kruskal-Wallis test was performed to compare the normalized membrane enrichment in the different groups, *** p<0.001. Error bars indicate SEM. B) The top panel shows the quantification of PKC Apl II membrane enrichment in the cell body and the processes of isolated sensory neurons (unpaired) or sensory neurons paired with motor neurons (shown in the bottom panel) treated with a serotonin concentration of 1 μM for 5 min (n = 26 unpaired cells and n = 6 paired cells from three independent experiments). For each group, membrane enrichment ratio was normalized to the membrane enrichment ratio in the 5HT (10 μM) group. An unpaired Student’s t test was performed to compare membrane enrichment in the processes of sensory neurons paired with motor neurons to that in the cell body, *p<0.05. Error bars indicate SEM.
Fig 3
Fig 3. Genistein acts on a tyrosine kinase to inhibit endogenous PKC Apl II translocation in response to 5HT in isolated sensory neurons.
The top panel shows the quantification of PKC Apl II membrane enrichment in the cell body of isolated sensory neurons (shown in the bottom panel) pretreated with either genistein (n = 19) for 5 min or vanadate (n = 26) for 30 min and then treated with 5HT (10 μM) for 5 min in the presence of the inhibitor. Cells were fixed and processed for immunocytochemistry using an anti-PKC Apl II antibody as described in methods. Membrane enrichment ratios were normalized to the 5HT alone group from the same experiments. The number of cells in the 5HT alone group for genistein and vanadate was 4 and 19 respectively. An unpaired Student’s t test was performed to compare normalized membrane enrichment in the 5HT and inhibitor group to that in the 5HT group, **p<0.01 after correction for multiple t-tests with Bonferroni correction. Error bars indicate SEM.
Fig 4
Fig 4. Testing the effect of different tyrosine kinase inhibitors on endogenous PKC Apl II translocation in response to 5HT in isolated sensory neurons.
The top panel shows the quantification of PKC Apl II membrane enrichment in the cell body of isolated sensory neurons (shown in the bottom panel) pretreated with either PP1 (n = 14) or PP2 (n = 13) for 5 min, herbamycin A (n = 12) for 15 min, K252a (n = 39) for 5min, lavendustin A (n = 6) for 15 min or SU5402 (n = 17) for 60 min and then treated with 5HT (10 μM) for 5 min in the presence of the inhibitor. Cells were fixed and processed for immunocytochemistry using an anti-PKC Apl II antibody as described in methods. Membrane enrichment ratios were normalized to the 5HT alone group from the same experiments. The number of cells in the 5HT alone group for PP1, PP2, herbamycin A, K252a, lavendustin A and SU5402 was 17, 17, 23, 30, 19 and 18 respectively. An unpaired Student’s t test was performed to compare normalized membrane enrichment in the 5HT and inhibitor group to that in the 5HT group, ***p<0.001, *p = 0.06 after Bonferroni correction. Error bars indicate SEM.
Fig 5
Fig 5. Phylogenetic analysis and structure of FGF-associated receptors.
A) Phylogenetic analysis of selected FGF-associated receptors and Trk-associated receptors from invertebrates and vertebrates. The abbreviations are: Dan (Danio), Lot (Lottia), Apl (Aplysia), Lym (Lymnaea), Dro (Drosophila), Cap (Capitella), Cra (Crassostrea), Hom (Homo sapiens), Bra (Branchiostoma), Nem (Nematostella). The accession numbers are listed in Table 4. B) The extracellular domain of the Apl FGFR contains all the conserved domains associated with FGFRs, while neither Apl Nork nor Apl RRTK contains these domains. The abbreviations are: Ig, Immunoglobulin-like domain; Tyr Kinase, Tyrosine Kinase domain; LRRs, Leucine-Rich Repeats; TM, transmembrane domain; Cys-Rich, Cysteine-Rich region.
Fig 6
Fig 6. Overexpressing the FGF receptor in isolated motor or sensory neurons from Aplysia does not increase PKC Apl II translocation in response to 5HT.
A) and B) eGFP-PKC Apl II was coexpressed along with either mRFP or FGFR1-mRFP in isolated motor neurons (A) or isolated sensory neurons (B) from Aplysia as described in methods. The number of cells in the mRFP group was 11 for the motor neurons and 19 for sensory neurons. The number of cells in the FGFR1-mRFP group was 7 for the motor neurons and 10 for sensory neurons. Cells were treated with 5HT (10 μM) for 5 min and PKC Apl II translocation ratio (Post/Pre treatment) was quantified. The bar graph shows the average of the translocation ratios measured 5 min after the addition of 5HT to the dish normalized to the Pre 5HT group. An unpaired Student’s t test was performed to compare eGFP-PKC Apl II translocation ratio in the FGFR1-mRFP group to that in the mRFP group in motor neurons (A) and sensory neurons (B). NS, non-significant; Error bars indicate SEM.
Fig 7
Fig 7. B receptors do not contribute to PKC Apl II translocation downstream of 5HT in Sf9 cells.
A) RT-PCR analysis of B receptors in Aplysia central nervous system (CNS). B2, B3, B4, B5 and B6 receptors were expressed in CNS, whereas B1 and B7 receptors were not. B) Sf9 cells were cotransfected with mRFP-PKC Apl II along with either eGFP-B2 (n = 3), eGFP-B4 (n = 3) or eGFP-5HT2Apl (n = 3). Cells were treated with 5HT (10 μM) for 5 min and PKC Apl II translocation ratio (Post/Pre treatment) was quantified as described in methods. The histogram shows the average of the translocation ratios measured at 60, 90, 120 and 150 sec after the addition of 5HT to the dish normalized to the Pre 5HT group. A paired Student’s t test was used to compare translocation post 5HT to pre 5HT for each group, *p<0.05 after correcting for multiple tests with Bonferroni correction. Error bars indicate SEM.

Similar articles

Cited by

References

    1. Nagakura I, Dunn TW, Farah CA, Heppner A, Li FF, et al. (2010) Regulation of protein kinase C Apl II by serotonin receptors in Aplysia. J Neurochem 115: 994–1006. 10.1111/j.1471-4159.2010.06986.x - DOI - PubMed
    1. Sossin WS (2007) Isoform specificity of protein kinase Cs in synaptic plasticity. Learn Mem 14: 236–246. 10.1101/lm.469707 - DOI - PubMed
    1. Bailey CH, Kandel ER (2008) Synaptic remodeling, synaptic growth and the storage of long-term memory in Aplysia. Prog Brain Res 169: 179–198. 10.1016/S0079-6123(07)00010-6 - DOI - PubMed
    1. Kandel ER (2001) The molecular biology of memory storage: a dialogue between genes and synapses. Science 294: 1030–1038. 10.1126/science.1067020 - DOI - PubMed
    1. Castellucci V, Pinsker H, Kupfermann I, Kandel ER (1970) Neuronal mechanisms of habituation and dishabituation of the gill-withdrawal reflex in Aplysia. Science 167: 1745–1748. - PubMed

MeSH terms

LinkOut - more resources