Assessing and Refining Myocardial Infarction Risk Estimation Among Patients With Human Immunodeficiency Virus: A Study by the Centers for AIDS Research Network of Integrated Clinical Systems
- PMID: 28002550
- PMCID: PMC5310962
- DOI: 10.1001/jamacardio.2016.4494
Assessing and Refining Myocardial Infarction Risk Estimation Among Patients With Human Immunodeficiency Virus: A Study by the Centers for AIDS Research Network of Integrated Clinical Systems
Abstract
Importance: Persons with human immunodeficiency virus (HIV) that is treated with antiretroviral therapy have improved longevity but face an elevated risk of myocardial infarction (MI) due to common MI risk factors and HIV-specific factors. Despite these elevated MI rates, optimal methods to predict MI risks for HIV-infected persons remain unclear.
Objective: To determine the extent to which existing and de novo estimation tools predict MI in a multicenter HIV cohort with rigorous MI adjudication.
Design, setting, and participants: We evaluated the performance of standard of care and 2 new data-derived MI risk estimation models in 5 Centers for AIDS Research Network of Integrated Clinical Systems sites across the United States where a multicenter clinical prospective cohort of 19 829 HIV-infected adults received care in inpatient and outpatient settings since 1995. The new risk estimation models were validated in a separate cohort from the derivation cohort.
Exposures: Traditional cardiovascular risk factors, HIV viral load, CD4 lymphocyte count, statin use, antihypertensive use, and antiretroviral medication use were used to calculate predicted event rates.
Main outcomes and measures: We observed MI rates over the course of follow-up that were scaled to 10 years using the Greenwood-Nam-D'Agostino Kaplan-Meier approach to account for dropout and loss to follow-up before 10 years.
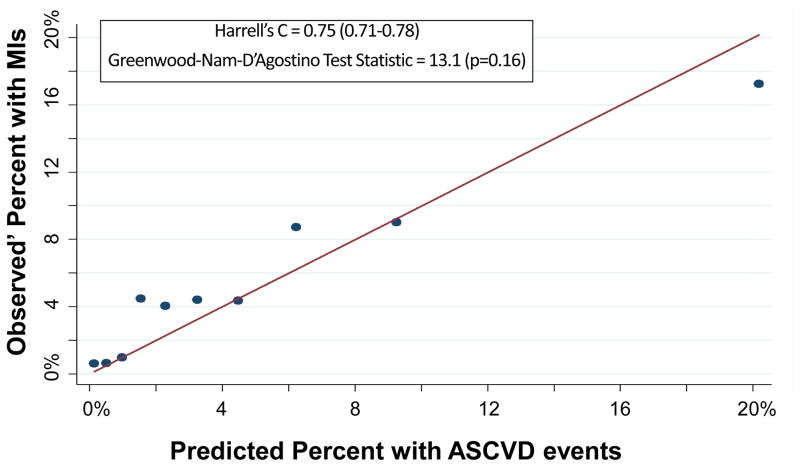
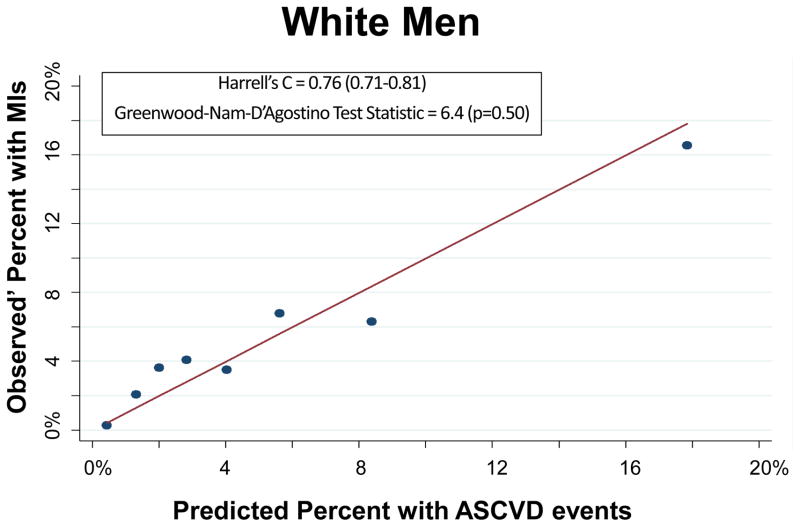
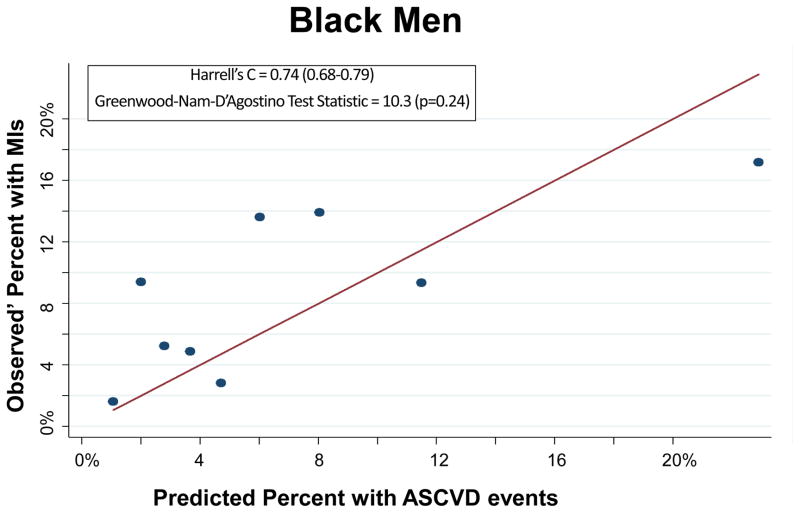
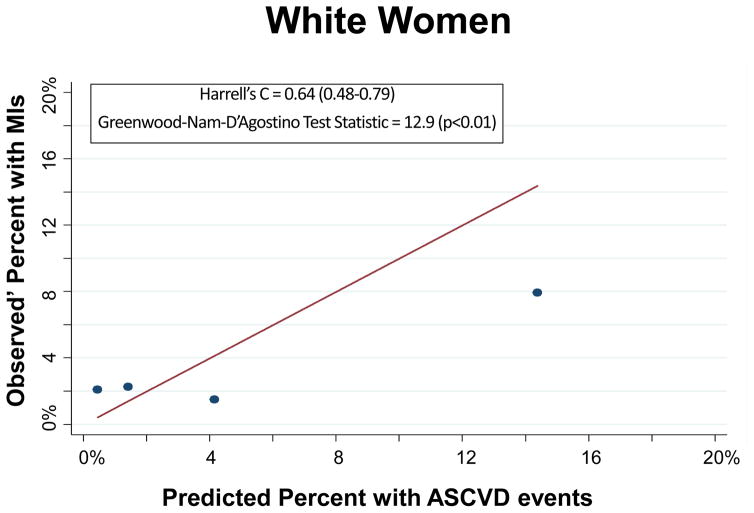
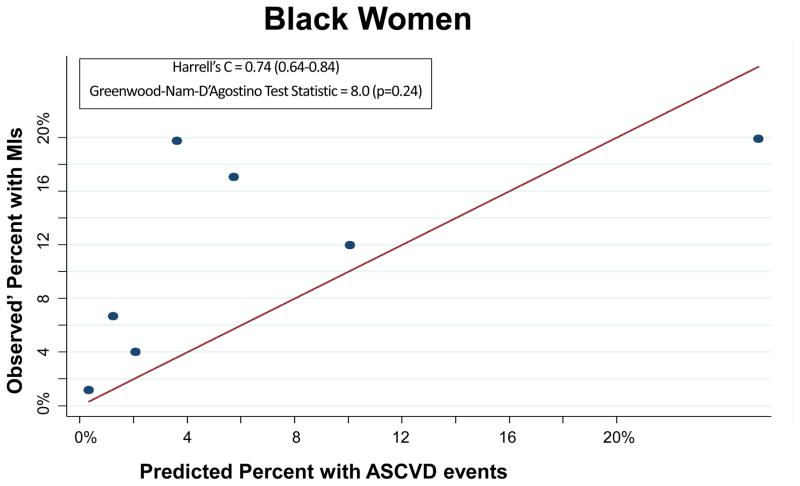
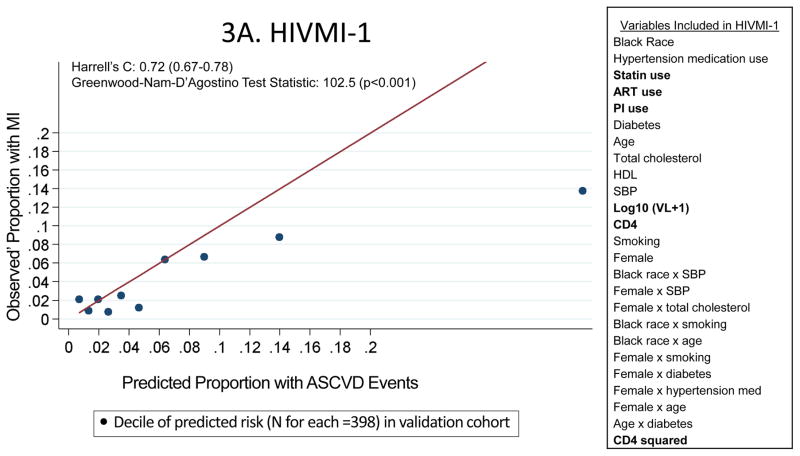
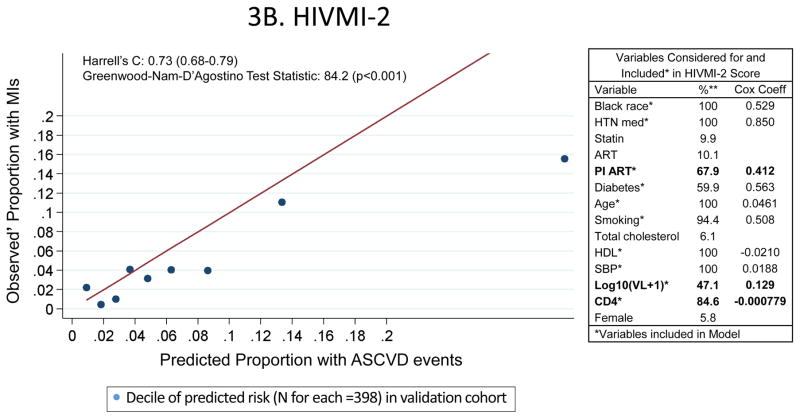
Results: Of the 11 288 patients with complete baseline data, 6904 were white and 9250 were men. Myocardial infarction rates were higher among black men (6.9 per 1000 person-years) and black women (7.2 per 1000 person-years) than white men (4.4 per 1000 person-years) and white women (3.3 per 1000 person-years), older participants (7.5 vs 2.2 MI per 1000 person-years for adults 40 years and older vs < 40 years old at study entry, respectively), and participants who were not virally suppressed (6.3 vs 4.7 per 1000 person-years for participants with and without detectable viral load, respectively). The 2013 Pooled Cohort Equations, which predict composite rates of MI and stroke, adequately discriminated MI risk (Harrell C statistic = 0.75; 95% CI, 0.71-0.78). Two data-derived models incorporating HIV-specific covariates exhibited weak calibration in a validation sample and did not discriminate risk any better (Harrell C statistic = 0.72; 95% CI, 0.67-0.78 and 0.73; 95% CI, 0.68-0.79) than the Pooled Cohort Equations. The Pooled Cohort Equations were moderately calibrated in the Centers for AIDS Research Network of Clinical Systems but predicted consistently lower MI rates.
Conclusions and relevance: The Pooled Cohort Equations discriminated MI risk and were moderately calibrated in this multicenter HIV cohort. Adding HIV-specific factors did not improve model performance. As HIV-infected cohorts capture and assess MI and stroke outcomes, researchers should revisit the performance of risk estimation tools.
Figures
Comment in
-
Association Between Human Immunodeficiency Virus Infection and Cardiovascular Diseases: Finding a Solution to Double Jeopardy.JAMA Cardiol. 2017 Feb 1;2(2):123-124. doi: 10.1001/jamacardio.2016.5177. JAMA Cardiol. 2017. PMID: 28002559 No abstract available.
-
Cardiovascular Risk Prediction in Patients With Human Immunodeficiency Virus-Reply.JAMA Cardiol. 2017 Sep 1;2(9):1048-1049. doi: 10.1001/jamacardio.2017.0649. JAMA Cardiol. 2017. PMID: 28467528 Free PMC article. No abstract available.
-
Cardiovascular Risk Prediction in Patients With Human Immunodeficiency Virus.JAMA Cardiol. 2017 Sep 1;2(9):1048. doi: 10.1001/jamacardio.2017.0667. JAMA Cardiol. 2017. PMID: 28467539 No abstract available.
Similar articles
-
Association of Risk of Viremia, Immunosuppression, Serious Clinical Events, and Mortality With Increasing Age in Perinatally Human Immunodeficiency Virus-Infected Youth.JAMA Pediatr. 2017 May 1;171(5):450-460. doi: 10.1001/jamapediatrics.2017.0141. JAMA Pediatr. 2017. PMID: 28346597 Free PMC article.
-
Mortality following myocardial infarction among HIV-infected persons: the Center for AIDS Research Network Of Integrated Clinical Systems (CNICS).BMC Med. 2019 Jul 31;17(1):149. doi: 10.1186/s12916-019-1385-7. BMC Med. 2019. PMID: 31362721 Free PMC article.
-
Application of a Lifestyle-Based Tool to Estimate Premature Cardiovascular Disease Events in Young Adults: The Coronary Artery Risk Development in Young Adults (CARDIA) Study.JAMA Intern Med. 2017 Sep 1;177(9):1354-1360. doi: 10.1001/jamainternmed.2017.2922. JAMA Intern Med. 2017. PMID: 28715555 Free PMC article.
-
Risk of myocardial infarction among people living with HIV: an updated systematic review and meta-analysis.BMJ Open. 2019 Sep 24;9(9):e025874. doi: 10.1136/bmjopen-2018-025874. BMJ Open. 2019. PMID: 31551371 Free PMC article.
-
Factors Associated With Excess Myocardial Infarction Risk in HIV-Infected Adults: A Systematic Review and Meta-analysis.J Acquir Immune Defic Syndr. 2019 Jun 1;81(2):224-230. doi: 10.1097/QAI.0000000000001996. J Acquir Immune Defic Syndr. 2019. PMID: 30865179 Free PMC article.
Cited by
-
Cost-effectiveness of statins for primary prevention of atherosclerotic cardiovascular disease among people living with HIV in the United States.J Int AIDS Soc. 2021 Mar;24(3):e25690. doi: 10.1002/jia2.25690. J Int AIDS Soc. 2021. PMID: 33749164 Free PMC article.
-
Occurrence of Accelerated Epigenetic Aging and Methylation Disruptions in Human Immunodeficiency Virus Infection Before Antiretroviral Therapy.J Infect Dis. 2021 May 28;223(10):1681-1689. doi: 10.1093/infdis/jiaa599. J Infect Dis. 2021. PMID: 32959881 Free PMC article.
-
Inflammatory and cardiovascular diseases biomarkers in chronic hepatitis C virus infection: A review.Clin Cardiol. 2020 Mar;43(3):222-234. doi: 10.1002/clc.23299. Epub 2019 Nov 30. Clin Cardiol. 2020. PMID: 31785111 Free PMC article. Review.
-
Prevention of stroke in people living with HIV.Prog Cardiovasc Dis. 2020 Mar-Apr;63(2):160-169. doi: 10.1016/j.pcad.2020.01.006. Epub 2020 Jan 31. Prog Cardiovasc Dis. 2020. PMID: 32014514 Free PMC article. Review.
-
Prevention of cardiovascular disease among people living with HIV in sub-Saharan Africa.Prog Cardiovasc Dis. 2020 Mar-Apr;63(2):149-159. doi: 10.1016/j.pcad.2020.02.004. Epub 2020 Feb 5. Prog Cardiovasc Dis. 2020. PMID: 32035126 Free PMC article.
References
-
- Palella FJ, Jr, Baker RK, Moorman AC, et al. Mortality in the highly active antiretroviral therapy era: changing causes of death and disease in the HIV outpatient study. Journal of acquired immune deficiency syndromes. 2006 Sep;43(1):27–34. - PubMed
-
- Rodger AJ, Lodwick R, Schechter M, et al. Mortality in well controlled HIV in the continuous antiretroviral therapy arms of the SMART and ESPRIT trials compared with the general population. Aids. 2013 Mar 27;27(6):973–979. - PubMed
-
- Sullivan PS, Jones JS, Baral SD. The global north: HIV epidemiology in high-income countries. Current opinion in HIV and AIDS. 2014 Mar;9(2):199–205. - PubMed
Publication types
MeSH terms
Grants and funding
LinkOut - more resources
Full Text Sources
Other Literature Sources
Medical
Research Materials