. 2016 Dec 20;45(6):1311-1326.
doi: 10.1016/j.immuni.2016.11.008.

Cholesterol Accumulation in CD11c+ Immune Cells Is a Causal and Targetable Factor in Autoimmune Disease

Affiliations

Cholesterol Accumulation in CD11c+ Immune Cells Is a Causal and Targetable Factor in Autoimmune Disease

Ayaka Ito et al. Immunity. .

Abstract

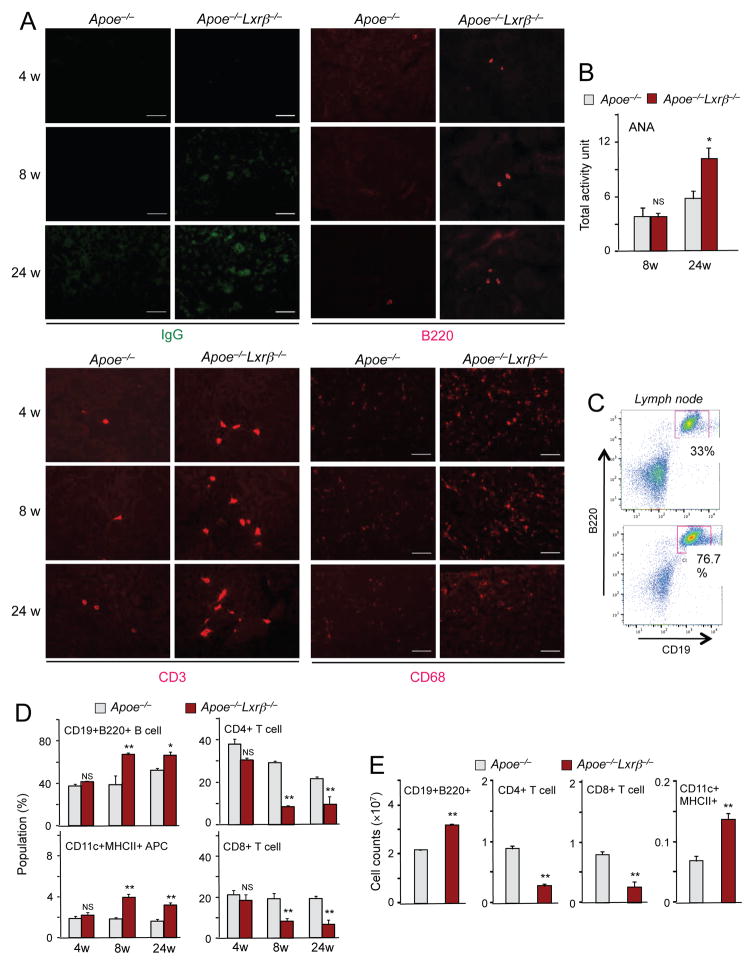
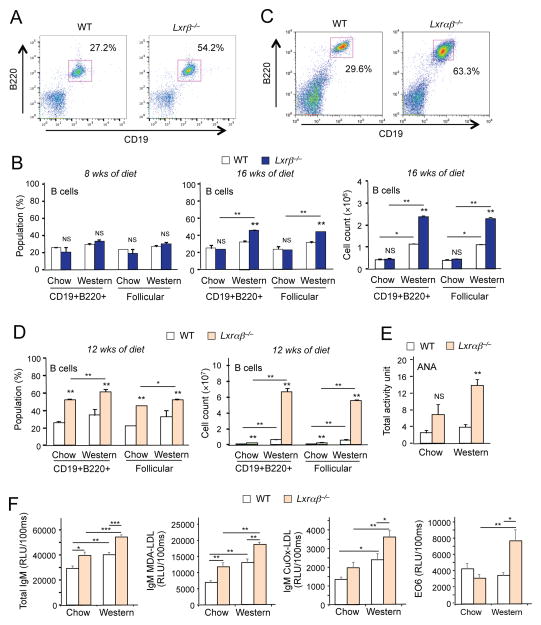
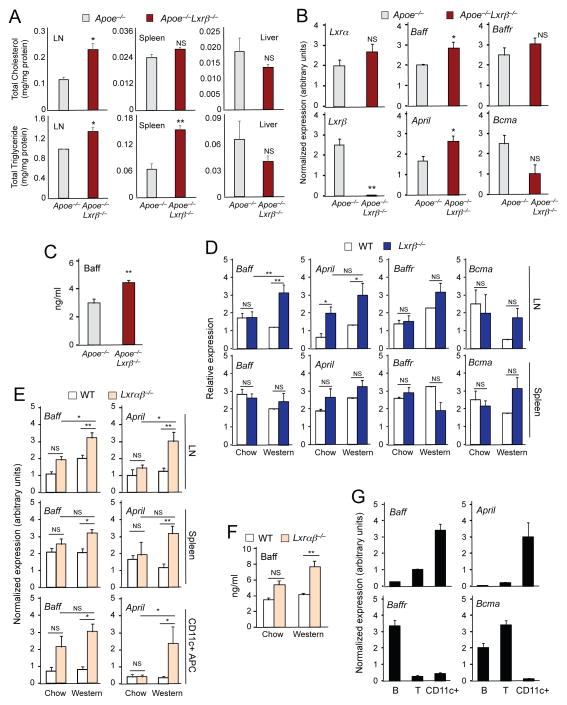
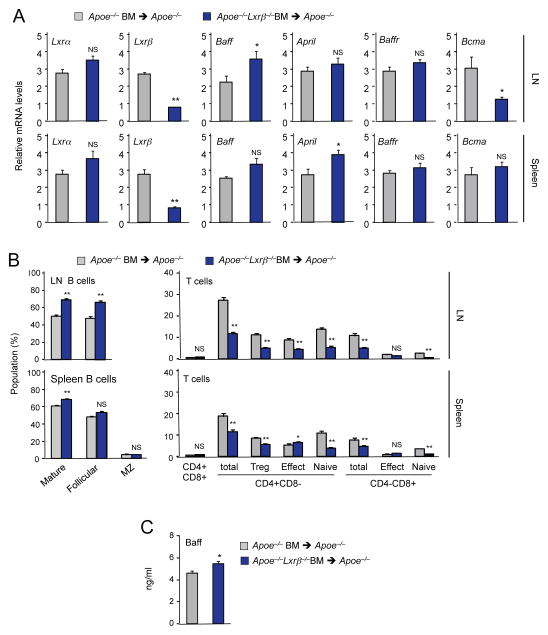
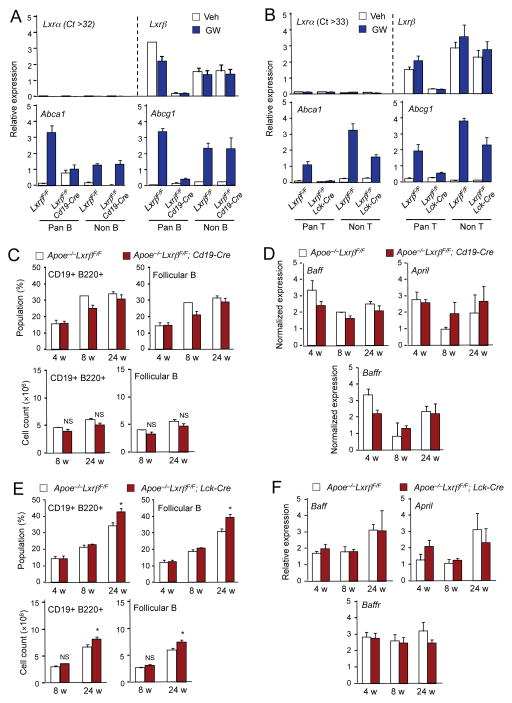
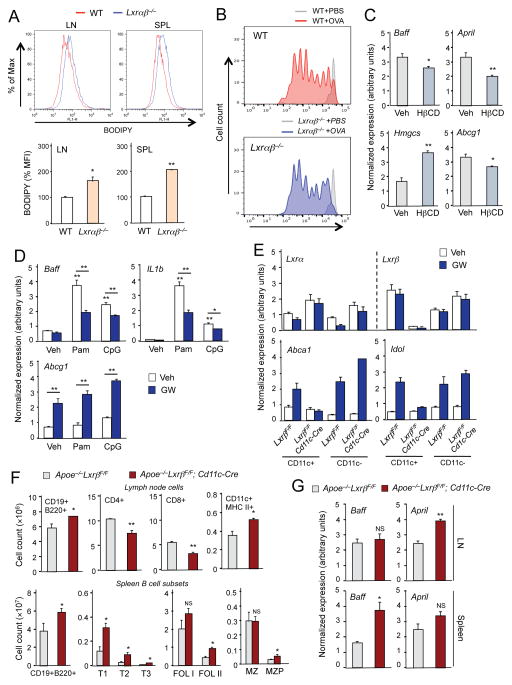
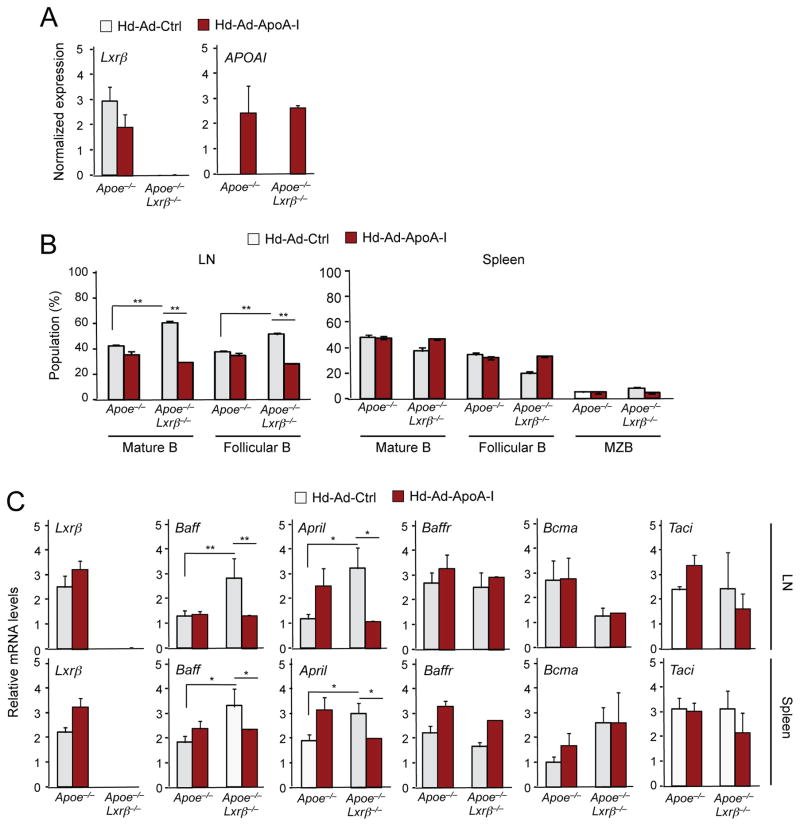
Liver X receptors (LXRs) are regulators of cholesterol metabolism that also modulate immune responses. Inactivation of LXR α and β in mice leads to autoimmunity; however, how the regulation of cholesterol metabolism contributes to autoimmunity is unclear. Here we found that cholesterol loading of CD11c+ cells triggered the development of autoimmunity, whereas preventing excess lipid accumulation by promoting cholesterol efflux was therapeutic. LXRβ-deficient mice crossed to the hyperlipidemic ApoE-deficient background or challenged with a high-cholesterol diet developed autoantibodies. Cholesterol accumulation in lymphoid organs promoted T cell priming and stimulated the production of the B cell growth factors Baff and April. Conversely, B cell expansion and the development of autoantibodies in ApoE/LXR-β-deficient mice was reversed by ApoA-I expression. These findings implicate cholesterol imbalance as a contributor to immune dysfunction and suggest that stimulating HDL-dependent reverse cholesterol transport could be beneficial in the setting of autoimmune disease.

Keywords: LXR; autoantibodies; autoimmune disease; reverse cholesterol transport.


Figures

Figure 1
Figure 1. Deletion of Lxrβ on an ApoE-null background is sufficient to provoke autoimmune disease
(A) Kidney sections from indicated ages of Apoe−/− and Apoe−/−Lxrβ−/− mice immunostained for IgG, B220, CD3 and CD68. (B) Plasma samples from 8-week-old and 24-week-old Apoe−/− and Apoe−/−Lxrβ−/− mice were analyzed for anti-nuclear antibody (ANA) titers by ELISA. (C) Flow cytometric analysis of CD19+B220+ B cells from lymph node of 8-week-old Apoe−/− and Apoe−/− Lxrβ−/− mice. (D) Percentages of indicated cell populations in lymph node of Apoe−/− and Apoe−/−Lxrβ−/− mice analyzed by flow cytometry. (E) Cell counts of the indicated cell populations in lymph node of ApoE−/− and Apoe−/−Lxrβ−/− mice analyzed by flow cytometry. N=4–6 per group. Statistical analysis was performed with Student’s t test. *p < 0.05, **p < 0.01, NS, not significant. Error bars represent means +/− SEM. See also Figure S1.
Figure 2
Figure 2. Feeding a high cholesterol diet promotes autoimmunity
(A) Flow cytometric analysis of CD19+B220+ B cells from lymph node of wild-type and Lxrβ−/− mice fed Western diet for 16 weeks. (B) Percentages and cell counts of the indicated cell populations in lymph node of wild-type and Lxrβ−/− mice fed chow or Western diet for 8 weeks or 16 weeks analyzed by flow cytometry. (C) Flow cytometric analysis of CD19+B220+ B cells from lymph node of wild-type and Lxrαβ−/− mice fed Western diet for 12 weeks. (D) Percentages and cell counts of the indicated cell populations in lymph node of wild-type and Lxrαβ−/− mice fed chow or Western diet for 12 weeks analyzed by flow cytometry. (E) Plasma samples from wild-type and Lxrαβ−/− mice fed chow and Western diet for 12 weeks analyzed for the titer of ANA by ELISA. (F) Plasma samples from wild-type and Lxrαβ−/− mice fed chow or Western diet for 12 weeks analyzed for the titers of total IgM, IgM against Cu-OxLDL, MDA-LDL and EO6 by ELISA. N=4–6 per group. Statistical analysis was performed with two-way ANOVA. *p < 0.05, **p < 0.01, NS, not significant. Error bars represent means +/− SEM. See also Figure S2.
Figure 3
Figure 3. Cholesterol accumulation in lymphoid organs promotes the production of Baff and April
(A) Lipid was extracted from lymph node, spleen and liver of 8-week-old Apoe−/− and Apoe−/−Lxrβ−/− mice. Total masses of cholesterol and triglyceride were determined by colorimetric methods. N=3. (B) Gene expression in lymph node of 8-week-old Apoe−/− and Apoe−/−Lxrβ−/− mice analyzed by real-time PCR. (C) Plasma Baff concentration in 8-week-old ApoE−/− and Apoe−/−Lxrβ−/− mice determined by ELISA. (D) Gene expression in lymph node (upper) and spleen (bottom) of wild-type and Lxrβ−/− mice fed chow or Western diet for 16 weeks analyzed by real-time PCR. (E) Gene expression in lymph node (upper), spleen (middle) and CD11c+ antigen-presenting cells (APC) (bottom) of wild-type and Lxrαβ−/− mice fed chow or Western diet for 12 weeks analyzed by real-time PCR. (F) Plasma Baff concentration in wild-type and Lxrαβ−/− mice fed chow or Western diet for 12 weeks determined by ELISA. (G) Pan B cells, pan T cells and APC were isolated from spleen of wild-type mice. Gene expression was analyzed by real-time PCR. N=4–6 per group. Statistical analysis was performed with Student’s t test (A–C) and two-way ANOVA (D–F). *p < 0.05, **p < 0.01, NS, not significant. Error bars represent means +/− SEM.
Figure 4
Figure 4. Loss of LXRβ expression in hematopoietic cells promotes the development of autoimmune disease
Bone marrow cells from Apoe−/− and Apoe−/−Lxrβ−/− mice were transplanted into Apoe−/− mice. Mice were analyzed 12 weeks after the transplantation. (A) Gene expression in from lymph node and spleen of Apoe−/− mice transplanted with bone marrow cells from Apoe−/− or Apoe−/− Lxrβ−/− mice analyzed by real-time PCR. (B) Percentages of indicated cell populations in lymph node and spleen of Apoe−/− mice transplanted with bone marrow cells from Apoe−/− or Apoe−/−Lxrβ−/− mice analyzed by flow cytometry. (C) Plasma Baff concentration in Apoe−/− mice transplanted with bone marrow cells from Apoe−/− or Apoe−/−Lxrβ−/− mice determined by ELISA. N=6 per group. Statistical analysis was performed with Student’s t test. *p < 0.05, **p < 0.01, NS, not significant. Error bars represent means +/− SEM.
Figure 5
Figure 5. Loss of LXRβ in lymphocyte does not affect the development of autoimmune disease
(A) Pan-B cells and non-B cells were isolated from spleen of LxrβF/F (F/F) and LxrβF/F; CD19-Cre (B-KO) mice. Cells were treated with GW3965 (1μM) overnight. Gene expression was analyzed by real-time PCR. (B) Pan-T cells and non-T cells were isolated from spleen of LxrβF/F (F/F) and LxrβF/F; LCK-Cre (T-KO) mice. Cells were treated with GW 3965 (1μM) overnight. Gene expression was analyzed by real-time PCR. (C) Percentages and cell counts of the indicated cell populations in lymph node of Apoe−/−LxrβF/F and ApoE−/−LxrβF/F; CD19-Cre mice analyzed by flow cytometry. (D) Gene expression in from lymph node of Apoe−/−LxrβF/Fand Apoe−/−LxrβF/F; CD19-Cre mice analyzed by real-time PCR. (E) Percentages and cell counts of the indicated cell populations in lymph node of Apoe−/−LxrβF/Fand Apoe−/−LxrβF/F; Lck-Cre mice analyzed by flow cytometry. (F) Gene expression in lymph node from Apoe−/−LxrβF/Fand Apoe−/−LxrβF/F; Lck-Cre mice analyzed by real-time PCR. N=4–5 per group. Statistical analysis was performed with Student’s t test. *p < 0.05, NS, not significant. Error bars represent means +/− SEM. See also Figures S3 and S4.
Figure 6
Figure 6. Altered antigen-presenting cell function in LXR-deficient mice
(A) Lipid content in CD11c+ APCs was analyzed by staining cells from lymph node and spleen of wild-type and Lxrαβ−/− mice fed Western diet for 12 weeks with BODIPY. MFI in CD11c+ APC population was determined by flow cytometry. (B) CFSE dilution of adoptively-transferred OT-1 T cells from lymph node and spleen of wild-type and Lxrαβ−/− mice fed Western diet for 16 weeks. On day 3 after challenge with ovalbumin (200 μg/mouse), CFSE-labeled OT-1 T cells were assessed by flow cytometry gating on CD8+TCR Va2+. (C) Bone marrow-derived dendritic cells were incubated with hydroxypropyl-β-cyclodextrin (HβCD, 10 mM) for 1 hr. Gene expression was analyzed by real-time PCR. (D) Bone marrow–derived dendritic cells were pretreated with GW3965 (1 μM) overnight, followed by stimulation with Pam3CSK4 (100 ng/ml) or CpG (1 μM) for 24 hr. Gene expression was analyzed by real-time PCR. (E) CD11c+ and CD11c cells were isolated from spleen of Apoe−/−LxrβF/F and Apoe−/−LxrβF/F; Cd11c-Cre mice. Cells were treated with GW3965 (1μM) overnight. Gene expression was analyzed by real-time PCR. (F) Cell counts of the indicated cell populations in lymph node of ApoE−/−LxrβF/F and −/−LxrβF/F; Cd11c-Cre mice at 8 weeks of age analyzed by flow cytometry. (G) Gene expression in lymph node and spleen of Apoe−/−LxrβF/F and Apoe−/−LxrβF/F; CD11c-Cre mice analyzed by real-time PCR. N=4–6 per group. Statistical analysis was performed with Student’s t test (A, C, F, G) and two-way ANOVA (D). *p < 0.05, **p < 0.01. Error bars represent means +/− SEM. See also Figures S5 and S6.
Figure 7
Figure 7. ApoA-I expression ameliorates autoimmune disease in mice deficient in ApoE and LXRβ
6 week-old Apoe−/− and Apoe−/−Lxrβ−/− mice were injected with Hd-Ad-control or Hd-Ad-ApoA-I. The mice were analyzed on 12 weeks after the injection. (A) Gene expression in liver of Apoe−/− and Apoe−/−Lxrβ−/− mice injected Hd-Ad-control or Hd-Ad-ApoA-I. (B) Percentages of indicated cell populations in lymph node and spleen of Apoe−/− and Apoe−/− Lxrβ−/− mice injected Hd-Ad-control or Ad-ApoA-I were analyzed by flow cytometry. (C) Gene expression in lymph node and spleen of Apoe−/− and Apoe−/−Lxrβ−/− mice injected with Hd-Ad-control or Ad-ApoA-I was analyzed by real-time PCR. (D) Plasma samples from Apoe−/− and Apoe−/−Lxrβ−/− mice injected with Hd-Ad-control or Ad-ApoA-I were analyzed for the presence of Baff (upper) and ANA (bottom) by ELISA. N=4–6 per group. Statistical analysis was performed with two-way ANOVA. *p < 0.05, **p < 0.01. Error bars represent means +/− SEM. See also Figure S7.

Comment in

References

    1. A-Gonzalez N, Bensinger SJ, Hong C, Beceiro S, Bradley MN, Zelcer N, Deniz J, Ramirez C, Diaz M, Gallardo G, et al. Apoptotic cells promote their own clearance and immune tolerance through activation of the nuclear receptor LXR. Immunity. 2009;31:245–258. - PMC - PubMed
    1. Allman D, Pillai S. Peripheral B cell subsets. Curr Opin Immunol. 2008;20:149–157. - PMC - PubMed
    1. Baldan A, Gonen A, Choung C, Que X, Marquart TJ, Hernandez I, Bjorkhem I, Ford DA, Witztum JL, Tarling EJ. ABCG1 is required for pulmonary B-1 B cell and natural antibody homeostasis. J Immunol. 2014;193:5637–5648. - PMC - PubMed
    1. Belalcazar LM, Merched A, Carr B, Oka K, Chen KH, Pastore L, Beaudet A, Chan L. Long-term stable expression of human apolipoprotein A-I mediated by helper-dependent adenovirus gene transfer inhibits atherosclerosis progression and remodels atherosclerotic plaques in a mouse model of familial hypercholesterolemia. Circulation. 2003;107:2726–2732. - PubMed
    1. Bensinger SJ, Bradley MN, Joseph SB, Zelcer N, Janssen EM, Hausner MA, Shih R, Parks JS, Edwards PA, Jamieson BD, Tontonoz P. LXR signaling couples sterol metabolism to proliferation in the acquired immune response. Cell. 2008;134:97–111. - PMC - PubMed

Publication types

MeSH terms