. 2017 Jan 17;8(3):4730-4746.
doi: 10.18632/oncotarget.13972.

Oncolytic adenovirus coexpressing interleukin-12 and decorin overcomes Treg-mediated immunosuppression inducing potent antitumor effects in a weakly immunogenic tumor model

Affiliations

Oncolytic adenovirus coexpressing interleukin-12 and decorin overcomes Treg-mediated immunosuppression inducing potent antitumor effects in a weakly immunogenic tumor model

Eonju Oh et al. Oncotarget. .

Abstract

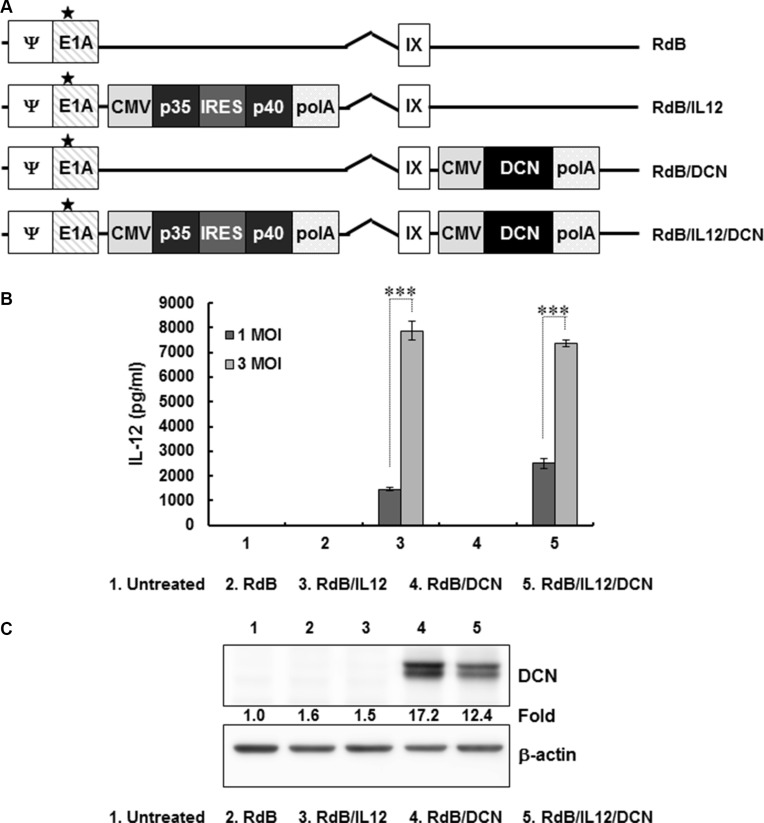
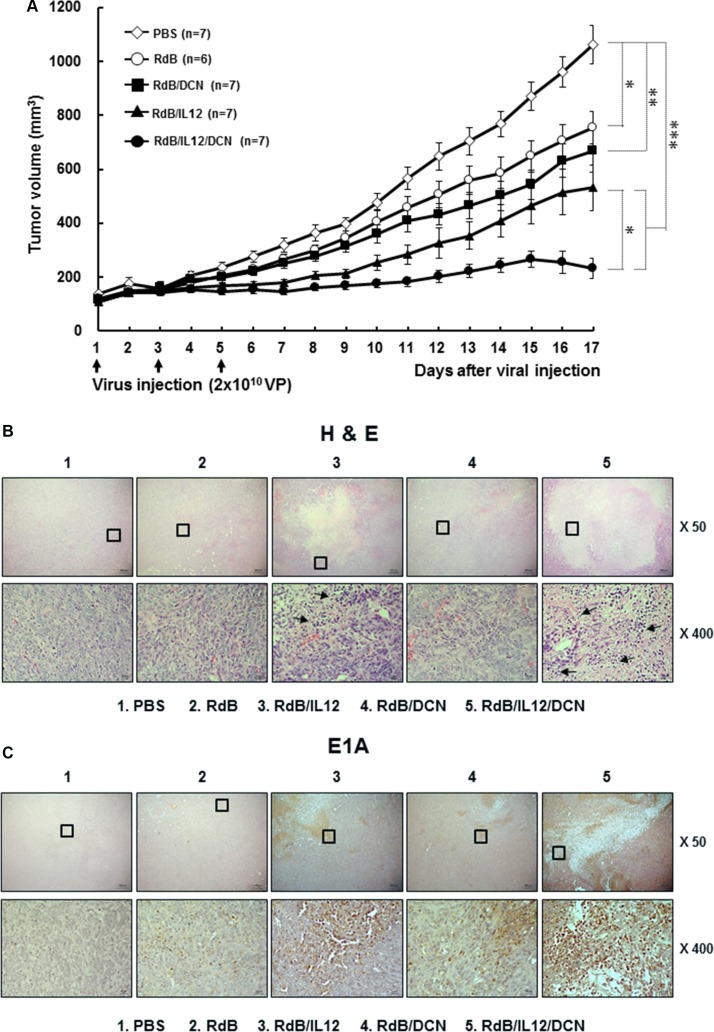
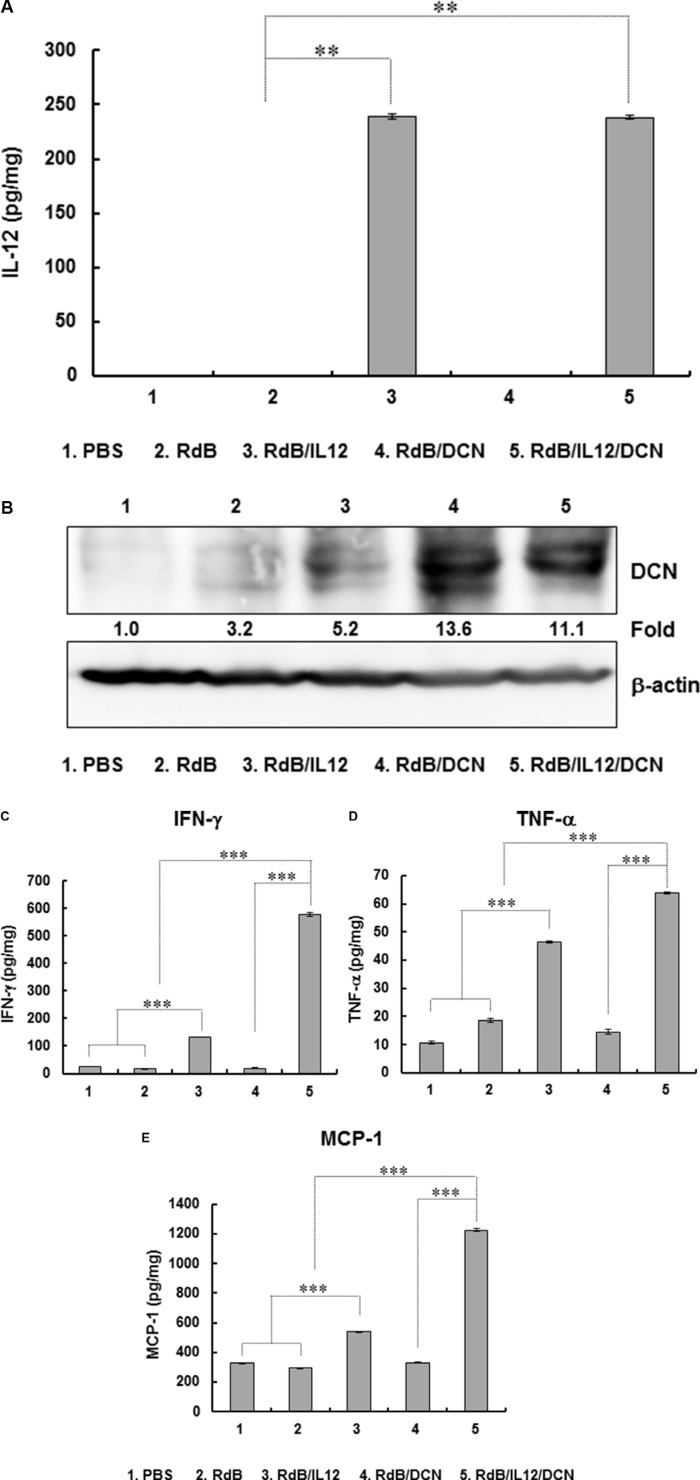
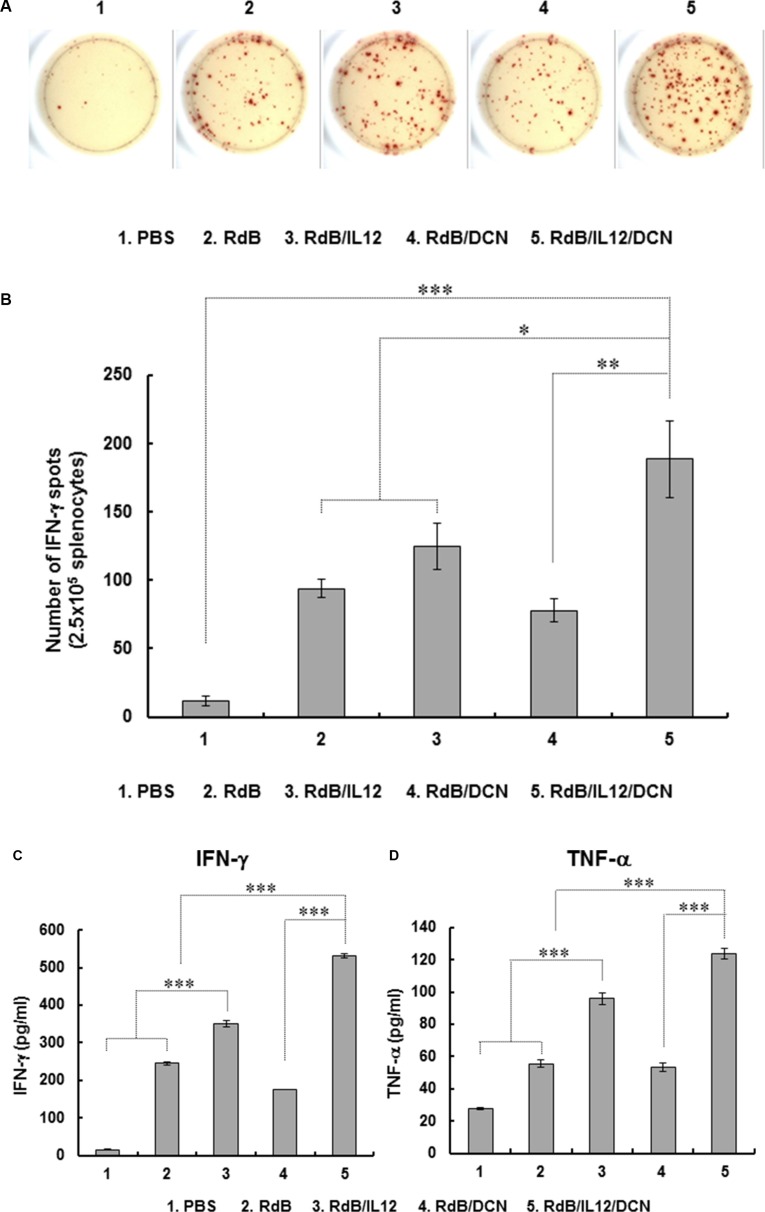
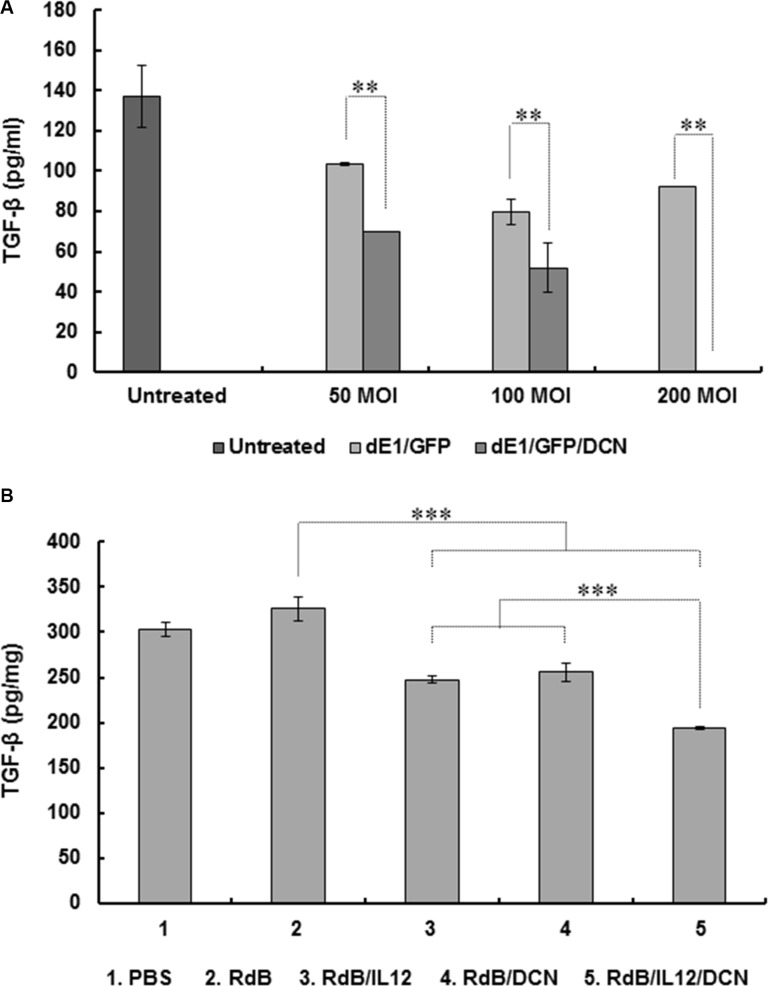
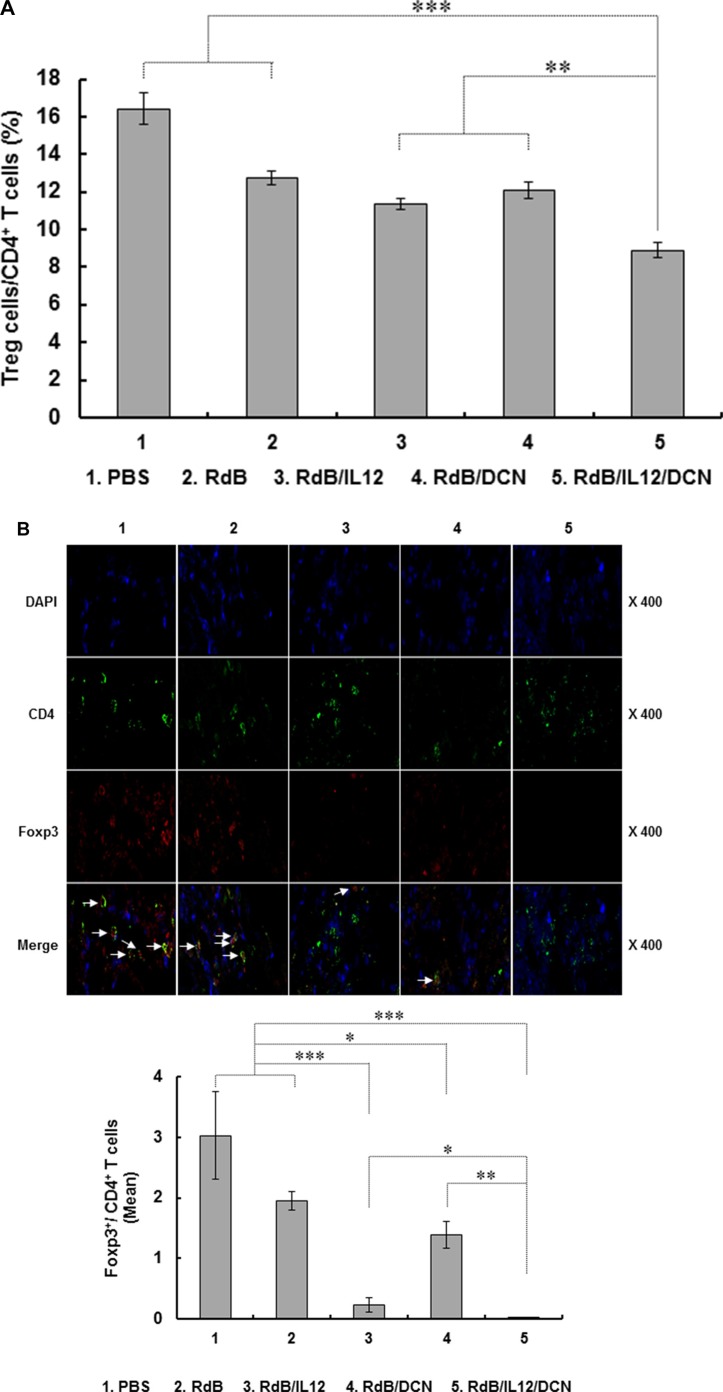
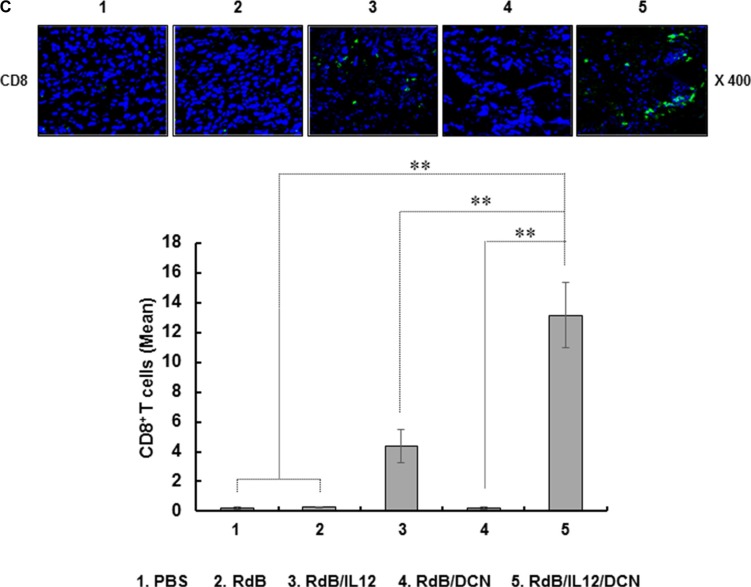
Interleukin (IL)-12 is a potent antitumor cytokine. However, immunosuppressive tumor microenvironments containing transforming growth factor-β (TGF-β) attenuate cytokine-mediated antitumor immune responses. To enhance the efficacy of IL-12-mediated cancer immunotherapy, decorin (DCN) was explored as an adjuvant for overcoming TGF-β-mediated immunosuppression. We designed and generated a novel oncolytic adenovirus (Ad) coexpressing IL-12 and DCN (RdB/IL12/DCN). RdB/IL12/DCN-treated tumors showed significantly greater levels of interferon (IFN)-γ, tumor necrosis factor-α, monocyte chemoattractant protein-1, and IFN-γ-secreting immune cells than tumors treated with cognate control oncolytic Ad expressing a single therapeutic gene (RdB/DCN or RdB/IL12). Moreover, RdB/IL12/DCN attenuated intratumoral TGF-β expression, which positively correlated with reduction of Treg cells in draining lymph nodes and tumor tissues. Furthermore, tumor tissue treated with RdB/IL12/DCN showed increases infiltration of CD8+ T cells and proficient viral spreading within tumor tissues. These results demonstrated that an oncolytic Ad co-expressing IL-12 and DCN induces a potent antitumor immune response via restoration of antitumor immune function in a weakly immunogenic murine 4T1 orthotopic breast cancer model. These findings provide new insights into the therapeutic mechanisms of IL-12 plus DCN, making it a promising cancer immunotherapeutic agent for overcoming tumor-induced immunosuppression.

Keywords: IL-12; TGF-β; Treg; decorin; oncolytic adenovirus.


Conflict of interest statement

CONFLICTS OF INTEREST

No potential conflicts of interest were disclosed.

Figures

Figure 1
Figure 1. Characterization of oncolytic adenovirus (Ad) vectors expressing interleukin (IL)-12 and/or decorin (DCN)
(A) Schematic representation of the genomic structures of oncolytic Ads. RdB has genes for mutated E1A and lacks E1B19 kD, E1B55 kD, and E3 genes. RdB/IL12 and RdB/DCN has genes for IL-12 in the E1 and DCN in the E3 region of RdB. RdB/IL12/DCN has genes for IL-12 in the E1 and DCN in the E3 region of RdB. Asterisk, mutation in the Rb binding site of E1A. (B, C) IL-12 and DCN expression in Ad-permissive U343 cells after infection with RdB, RdB/IL12, RdB/DCN, or RdB/IL12/DCN. Cell supernatants were harvested at 48 hr after infection and IL-12 expression was quantified by ELISA. Representative western blot of DCN using lysates harvested at 48 hr after infection. ELISA data are mean ± SD of triplicate experiments. ***P < 0.001.
Figure 2
Figure 2. Antitumor effect of oncolytic Ads in an orthotopic breast cancer model
(A) Established orthotopic 4T1 tumors were injected with RdB (open circles), RdB/DCN (filled squares), RdB/IL12 (filled triangles), or RdB/IL12/DCN (filled circles) at 2 × 10¹⁰ VP on days 1, 3, and 5, with PBS control (open diamonds). Tumor growth was monitored daily. Arrow, treatment administration. Data are mean ± SD of tumor volume by group (n = 6–7 mice). *P < 0.05, **P < 0.01, or ***P < 0.001. (B and C) Histology and immunohistochemistry of tumor tissues treated with PBS, RdB, RdB/IL12, RdB/DCN, or RdB/IL12/DCN. Tumor tissues were collected from mice at 6 days after final treatment. Paraffin sections were stained with hematoxylin and eosin (H&E) or anti-Ad E1A. Arrows, immune cell infiltration into tumor tissues. Images are representatives of results from three independent experiments. Original magnification: × 50 with × 400 magnification of the boxed area.
Figure 3
Figure 3. Expression of IL-12, DCN, IFN-γ, TNF-α, and MCP-1 in tumor tissues
Tissues were obtained at 6 days after final viral treatment for quantitation of (A) IL-12, (B) DCN, (C) IFN-γ, (D) TNF-α, and (E) MCP-1. Experiments were in triplicate and repeated three times (A, C, D, E) DCN expression is representative of three independent experiments (B) Data points are mean expression ± SD for IL-12, IFN-γ, TNF-α, and MCP-1 for each tumor. **P < 0.01 or ***P < 0.001.
Figure 4
Figure 4. Assessment of tumor-specific immunity
Splenocytes were collected from mice treated with PBS, RdB, RdB/IL12, RdB/DCN, or RdB/IL12/DCN at 6 days after final treatment and co-incubated with pre-irradiated 4T1 cells for 1 day. Assays were IFN-γ ELISPOT. (A) Spot-forming cell response. Images are representatives of results from three independent experiments. (B) Number of spots for 2.5 × 10⁵ splenocytes. Values are mean spot number ± SD for triplicates representative of three independent experiments. *P < 0.05, **P < 0.01, or ***P < 0.001. (C, D) Quantification of IFN-γ and TNF-α from tumor-specific immune cells. Splenocytes were co-cultured with pre-irradiated 4T1 cells for 2 days. IFN-γ and TNF-α were evaluated in co-cultured supernatants by cytometric bead array (CBA) mouse inflammation kits. Data points are mean ± SD of triplicates representative of three independent experiments. ***P < 0.001.
Figure 5
Figure 5. Inhibition of TGF-β expression by DCN-expressing Ad in vitro and in vivo
(A) 4T1 cells were transduced with replication-incompetent dE1/GFP or dE1/GFP/DCN at indicated MOIs and TGF-β expression measured from culture supernatants at 48 hr after transduction using ELISA. Values are mean ± SD of triplicates representative of three independent experiments. **P < 0.01 compared with dE1/GFP. (B) Established 4T1 tumors were treated with PBS, RdB, RdB/IL12, RdB/DCN, or RdB/IL12/DCN, and harvested from mice at 5 days after final treatment. ELISA was performed to estimate TGF-β in tumor tissues. Data points are mean ± SD of triplicates representative of three independent experiments. ***P < 0.001 compared with RdB, RdB/IL12 or RdB/DCN.
Figure 6
Figure 6. Proportion of Treg and quantification of CD8+ T cells
DLNs and tumor tissues were collected from mice treated with PBS, RdB, RdB/IL12, RdB/DCN, or RdB/IL12/DCN at 6 days after final viral treatment. (A) Population of Treg cells in DLNs from mice were analyzed by flow cytometry. Gating was for CD4+ T cells and analysis for CD25+ and Foxp3+ cells. Data points are mean ± SD of triplicate experiments with at least three mice per group. Similar results were obtained from at least two separate experiments. **P < 0.01, ***P < 0.001. (B) Cryosections of tumor tissues stained with anti-CD4 (green) and anti-Foxp3 (red) monoclonal antibodies. Arrows, T cells co-expressing CD4 and Foxp3 in tumors. Ratio of Foxp3+/CD4+ T cells was assessed by ImageJ software. The relative mean intensity of CD4- or Foxp3-positive cells were quantified from three independent fields within microscope images for each experimental group. Data are representative of three independent experiments. *P < 0.05, **P < 0.01, or ***P < 0.001. (C) Cryosections of tumor tissues were incubated with antibody against CD8 (green). Mean ± SD of CD8+ T cells was quantified by ImageJ software. The mean intensity of three different images was quantified for each sample (CD8+ T cells/field). Images are representative of three independent experiments. Original magnification: × 400. **P < 0.01.

References

    1. Kruger C, Greten TF, Korangy F. Immune based therapies in cancer. Histol Histopathol. 2007;22:687–696. - PubMed
    1. Nagai H, Hara I, Horikawa T, Oka M, Kamidono S, Ichihashi M. Elimination of CD4(+) T cells enhances anti-tumor effect of locally secreted interleukin-12 on B16 mouse melanoma and induces vitiligo-like coat color alteration. J Invest Dermatol. 2000;115:1059–1064. - PubMed
    1. Croci DO, Zacarias Fluck MF, Rico MJ, Matar P, Rabinovich GA, Scharovsky OG. Dynamic cross-talk between tumor and immune cells in orchestrating the immunosuppressive network at the tumor microenvironment. Cancer Immunol Immunother. 2007;56:1687–1700. - PMC - PubMed
    1. Bubenik J. Genetically modified tumour vaccines carrying inserted genes for immunoregulatory molecules. Folia Biol (Praha) 1996;42:295–304. - PubMed
    1. Colombo MP, Rodolfo M. Tumor cells engineered to produce cytokines or cofactors as cellular vaccines: do animal studies really support clinical trials? Cancer Immunol Immunother. 1995;41:265–270. - PMC - PubMed

MeSH terms