. 2017 Jan 17;8(3):5003-5015.
doi: 10.18632/oncotarget.14009.

Concomitant inhibition of receptor tyrosine kinases and downstream AKT synergistically inhibited growth of KRAS/BRAF mutant colorectal cancer cells

Affiliations

Concomitant inhibition of receptor tyrosine kinases and downstream AKT synergistically inhibited growth of KRAS/BRAF mutant colorectal cancer cells

Qiaoling Song et al. Oncotarget. .

Abstract

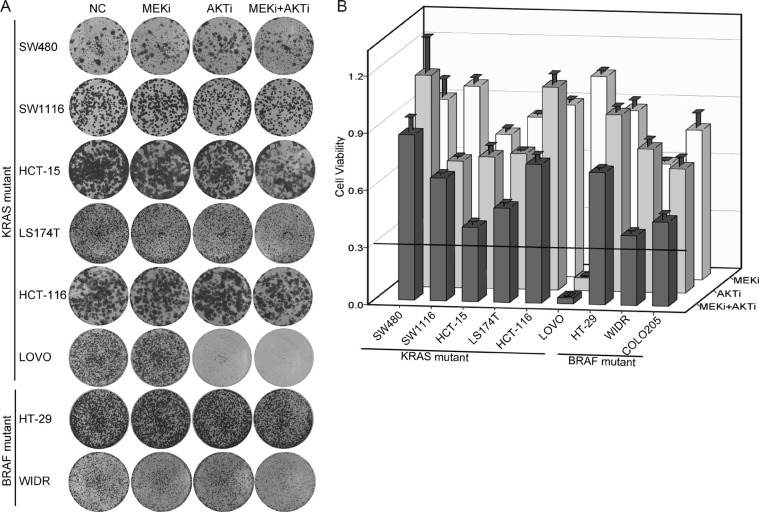
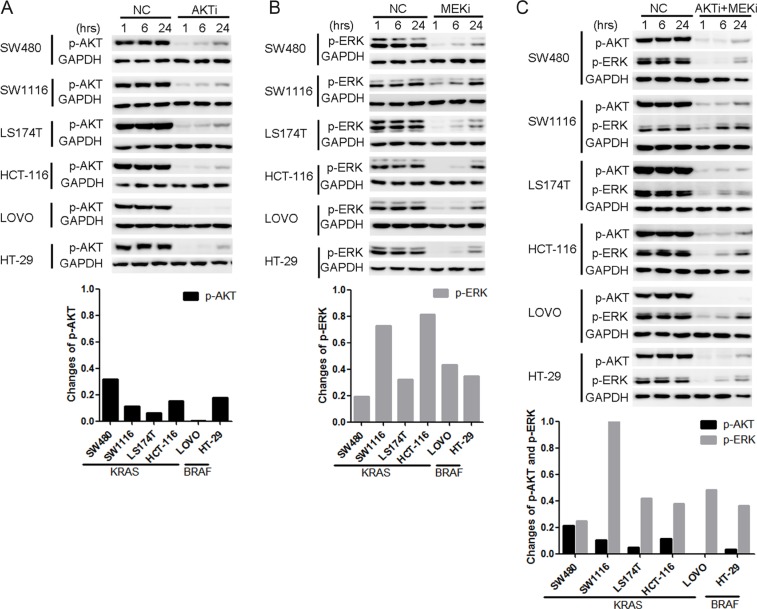
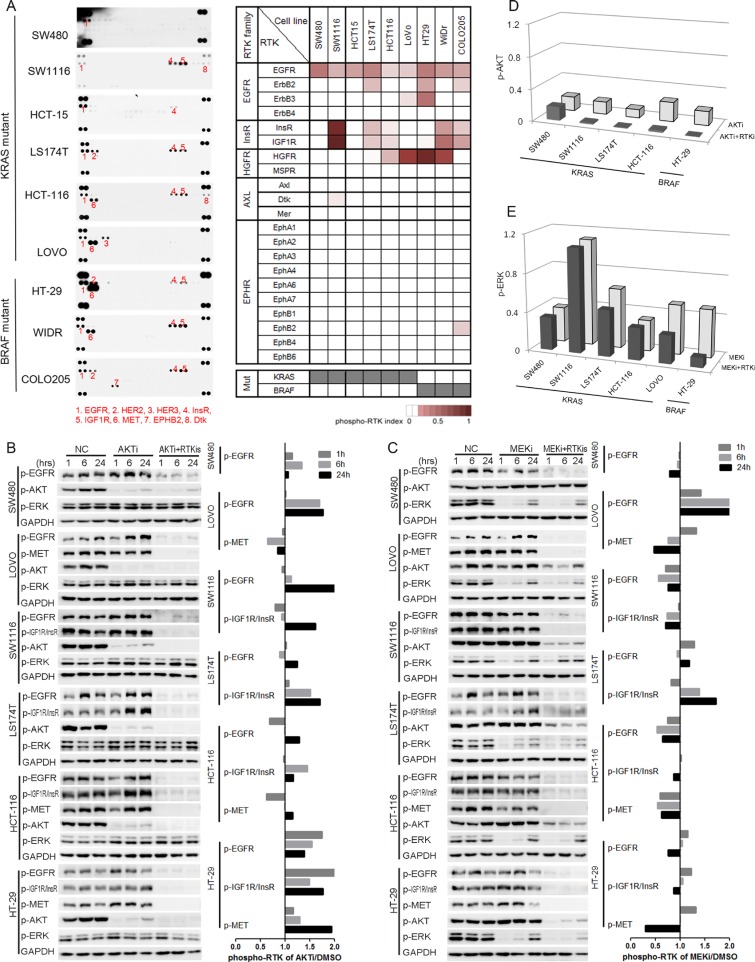
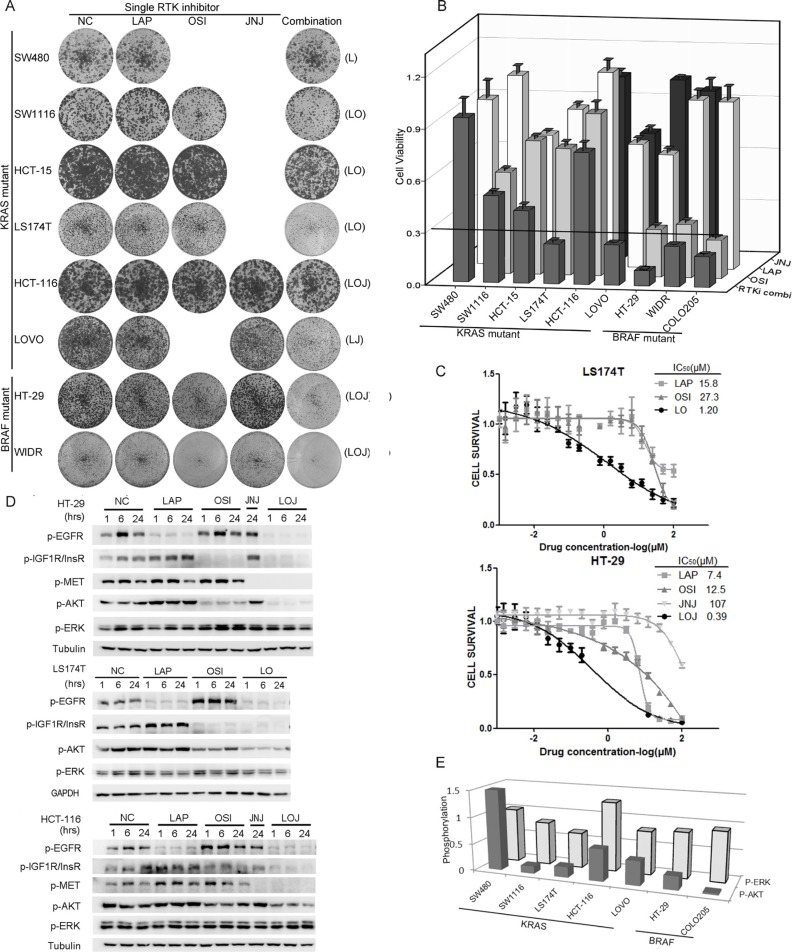
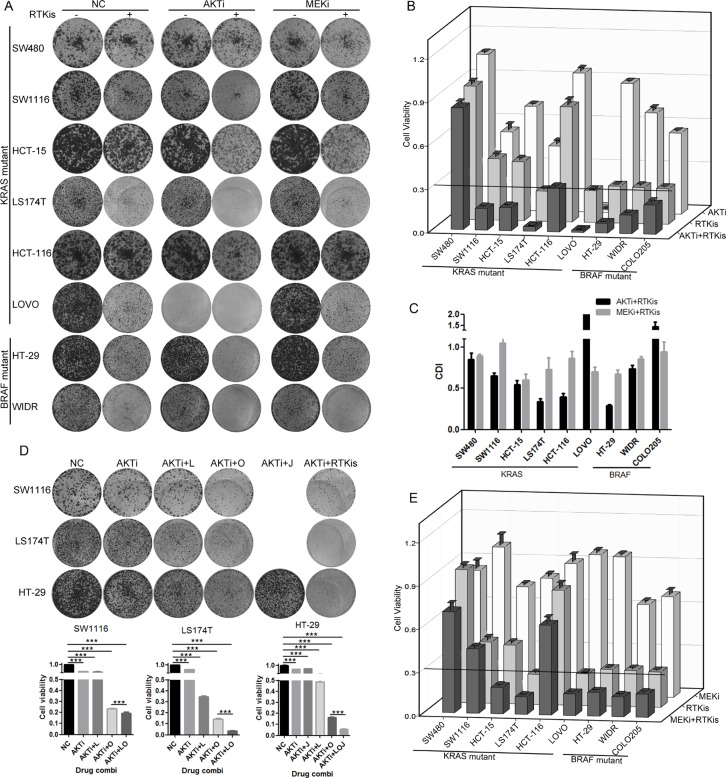
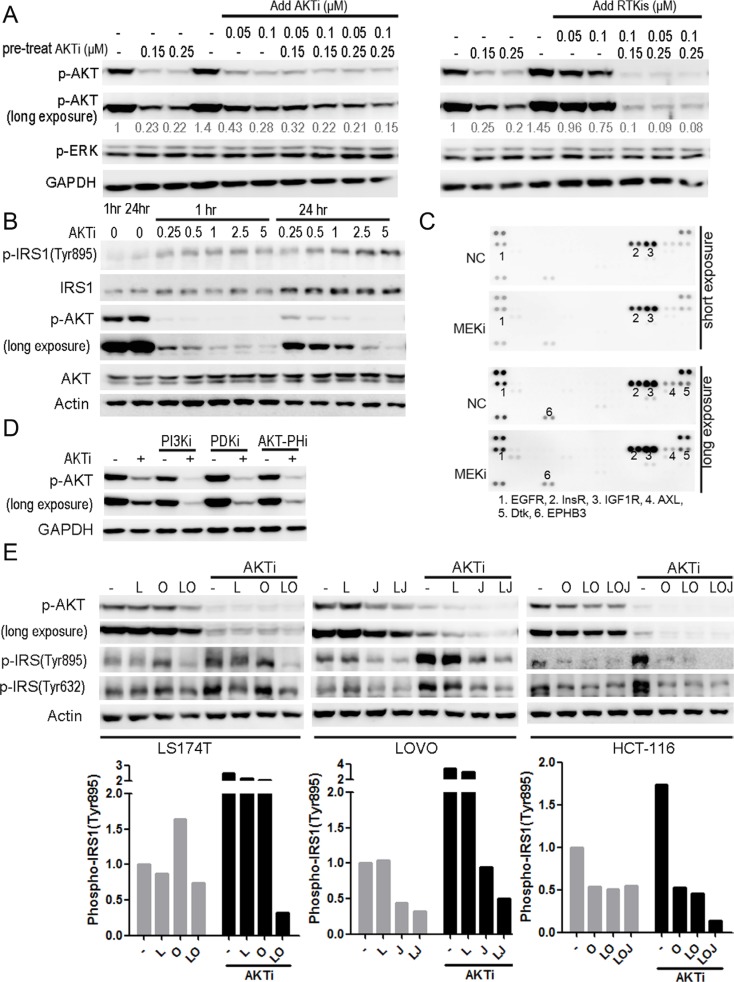
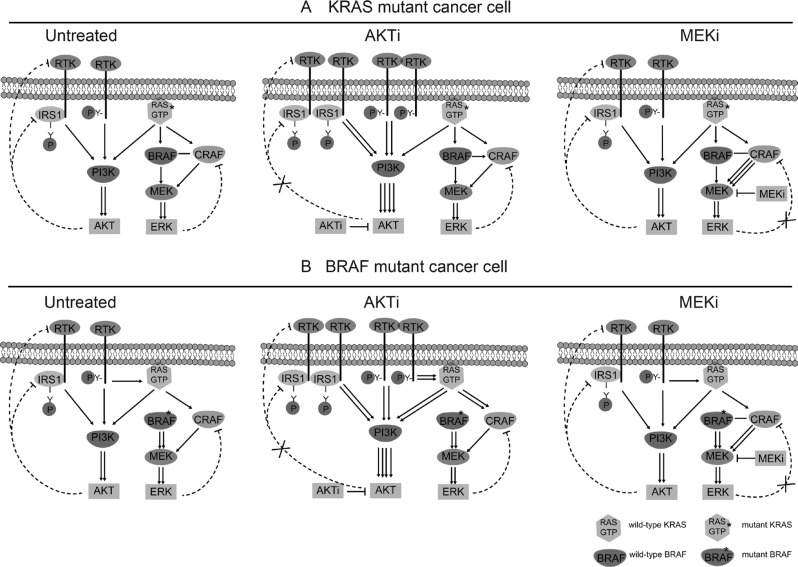
Receptor tyrosine kinase (RTK) signaling pathways are frequently activated in cancer cells due to mutations of RTKs and/or their downstream signaling proteins such as KRAS and BRAF. About 40% colorectal cancers (CRCs) contain KRAS or BRAF mutant genes and are resistant to treatments with individual inhibitors of RTKs, AKT, MEK, or BRAF. Therefore, an understanding of the molecular mechanisms of the drug resistance is necessary for developing effective strategies to treat the diseases. Here we report the discovery of an AKT/ERK reactivation mechanism that account for the cancer cell resistance to the AKT and MEK inhibitors treatments. The reactivations of AKT and ERK after the AKT or MEK inhibitor treatment were caused by a relief of an AKT or ERK-mediated feedback inhibition of the RTKs and/or their downstream pathways. A combination of RTK inhibitors, based on the RTK activation/phosphorylation profile, synergized with the AKT inhibitor, but not the MEK inhibitor, to completely inhibit the AKT phosphorylation and to block the growth of KRAS/BRAF mutant CRC cells. These results underscored the importance of AKT and the AKT feedback signaling to cancer cell growth and offered a novel therapeutic approach for the treatment of KRAS/BRAF mutant CRC cells.

Keywords: AKT; RAS/RAF; colorectal cancer; drug combination; receptor tyrosine kinases.


Conflict of interest statement

CONFLICTS OF INTEREST

The authors disclose no potential conflicts of interest.

Figures

Figure 1
Figure 1. AKTi and MEKi were insufficient to inhibit growth of most of the KRAS/BRAF mutant CRC cells
(A) Foci formation assay of six KRAS mutant CRC cell lines (SW480, SW1116, HCT-15, LS174T, HCT-116 and LOVO) and two BRAF mutant CRC cell lines (HT-29 and WIDR). Cells were treated with DMSO (NC), 0.25 μM MK2206 (AKTi), or 2.5 μM U0126 (MEKi) individually or in combination and visualized by crystal violet staining at the endpoint. (B) Quantification of the crystal violet staining in (A). For COLO205 cells, absolute cell numbers were counted by MUSE cell analyzer. Relative cell viability was calculated by comparing to the vehicle treatment. A cutoff of relative cell viability at 0.3 was drawn to define drug-sensitive and drug-resistant effects. The data was graphically represented as mean ± SD.
Figure 2
Figure 2. AKT and ERK were reactivated after the AKTi or/and MEKi treatments
(AC) Cells were treated with DMSO (NC), 0.25 μM AKTi (A), 2.5 μM MEKi (B), or the combination of AKTi and MEKi (C) for 1 hr, 6 hr and 24 hr. The whole cell lysates were processed for western blot and probed with indicated antibodies. AKT phosphorylation levels were normalized by GAPDH and compared to NC treatment. The reactivation of AKT was calculated according to the formula: p-AKTrelative = p-AKT24hr - p-AKT1hr while the reactivation of ERK was calculated according to the formula: p-ERKrelative= p-ERK24hr - p-ERK1hr.
Figure 3
Figure 3. The increased activation of RTKs was responsible for the reactivation of AKT, but not ERK
(A) RTK activation profiles of nine KRAS/BRAF mutant CRC cell lines were detected by using phospho-RTK arrays (left panel). Phospho-RTKs were numbered and illustrated below the profiles. Quantification of RTK activations was illustrated by phospho-RTK index, and shown as heat maps (right panel). Mutation status for KRAS and BRAF were shown at the bottom (gray, mutation; white, wild-type). (BC) Cells were treated with DMSO (NC), AKTi, AKTi+RTKis combination (B), or MEKi, MEKi+RTKis combination (C) for 1 hr, 6 hr and 24 hr. The whole cell lysates were processed for western blot and probed with indicated antibodies. Line graphs indicated the quantitative changes of RTK phosphorylation under AKTi or MEKi treatment versus DMSO treatment (NC). Ratio less than 1 indicated decreased RTK phosphorylation, and ratio larger than 1 indicated increased RTK phosphorylation. (D) Quantification of the AKT phosphorylation changes in five AKTi-resistant CRC cell lines in (B). The AKT phosphorylation levels were normalized to GAPDH and compared to NC treatment. (E) Quantification of the ERK phosphorylation changes in six MEKi-resistant CRC cell lines in (C). The ERK phosphorylation levels were normalized to GAPDH and compared to NC treatment. RTKis represented individual RTK activation-based RTKi combination in each cell line: LAP for SW480, LAP+OSI for SW1116 and LS174T, LAP+OSI+JNJ for HCT-116 and HT-29, and LAP+JNJ for LOVO. The concentrations for each RTKi were as follows: LAP (L), 0.5 μM; OSI (O), 0.5 μM; JNJ (J), 0.05 μM.
Figure 4
Figure 4. Phospho-RTK profile-based RTKi combinations partially inhibited the growth of BRAF/KRAS mutant CRC cells mainly by inhibiting AKT phosphorylation
(A) Foci formation assay of six KRAS mutant CRC cell lines and two BRAF mutant CRC cells. Cells were treated with LAP, OSI and JNJ individually or in combination according to the specific phospho-RTK patterns in each cell line and visualized by crystal violet staining at endpoint. The combinations of RTKis were illustrated in parenthesis. The concentrations for RTKis were: LAP (L), 0.5 μM; OSI (O), 0.5 μM; JNJ (J), 0.05 μM. (B) Quantification of the crystal violet staining in (A). For COLO205 cells, absolute cell numbers were counted by MUSE cell analyzer. A cutoff of relative cell viability at 0.3 was drawn to define drug-sensitive and drug-resistant effects. (C) LS174T cells were treated with LAP, OSI or the combination of LAP and OSI (LO) with a ratio of 1:1 at various concentrations (top panel). HT-29 cells were treated with LAP, OSI, JNJ or the combination of LAP, OSI and JNJ (LOJ) with a ratio of 10:10:1 at various concentrations (bottom panel). 72 hr later, cell viability was obtained by the MTT assay. The IC50 values of each treatment were calculated. The IC50 values of RTKi combinations were represented by the concentrations of LAP in the combination. (D) HT-29, LS174T and HCT-116 cells were treated with DMSO (NC), 0.5 μM LAP, 0.5 μM OSI and 0.05 μM JNJ individually or in combination for 1 hr, 6 hr and 24 hr. The whole cell lysates were processed for western blot and probed with indicated antibodies. (E) The quantification of AKT and ERK phosphorylation under RTKi treatments in (D) and Figure S3. P-AKT and p-ERK levels at 24 hr after drug exposure were compared to the DMSO treatment.
Figure 5
Figure 5. RTKi combinations synergized with AKTi but not with MEKi to inhibit the CRC growth
(A) Foci formation assay of eight KRAS/BRAF mutant CRC cells which were treated with DMSO (NC), 0.25 μM AKTi and 0.5 μM RTKis individually or in combination, or 2.5 μM MEKi and 0.5 μM RTKis individually or in combination. Foci were visualized by crystal violet staining at endpoint. The combination and concentration of RTKis for each cell line were the same as in Figure 4A. (B and E) Quantification of the crystal violet staining in (A). For COLO205 cells, absolute cell numbers were counted by MUSE cell analyzer. A cutoff of relative cell viability at 0.3 was drawn to define drug-sensitive and drug-resistant effects. (C) The coefficient of drug interaction (CDI) values were calculated for the combination of AKTi and RTKis or the combination of MEKi and RTKis as shown in (A). CDI = 1 indicated additive effects and CDI < 1 indicated synergistic effects. (D) Foci formation assay of LS174T, HT-29 and SW1116 cells. Cells were treated with AKTi, combination of AKTi and single RTKi, or combination of AKTi and multiple RTKis. Foci were visualized by crystal violet staining at endpoint (top panel), and quantified to DMSO (NC) treatment (bottom panel). Data were represented as mean±SD. The statistical analysis was performed by one-way ANOVA with Tukey post-hoc test. ***p < 0.001.
Figure 6
Figure 6. The RTK/IRS1-mediated reactivation of AKT was responsible for the insufficient inhibition of the cell growth by the AKTi
(A) HCT-116 cells were pretreated with AKTi for 46 hr, and then treated with AKTi or RTKis (LOJ) for 2 hr. The whole cell lysates were processed for western blot and probed with indicated antibodies. Relative AKT phosphorylation levels were quantified to DMSO treatment, and illustrated as numbers below the blots. (B) SW1116 cells were treated with AKTi at various concentrations for 1 hr and 24 hr. The whole cell lysates were processed for western blot and probed with indicated antibodies. (C) Phospho-RTK arrays of SW1116 cells, which were treated with DMSO (NC) or MEKi for 24 hr. Positive dots were numbered and illustrated below the arrays. (D) SW1116 cells which were pretreated with 0.25 μM AKTi for 24 hr and then treated with 10 μM LY294002 (PI3Ki), 2.5 μM GSK2334470 (PDKi), or 1 μM triciribine (PIP3-AKT binding inhibitor) for 1 hr. The whole cell lysates were processed for western blot and probed with indicated antibodies. (E) LS174T, LOVO and HCT-116 cells were treated with single RTKi or the specific RTKis with or without AKTi for 24 hr. The whole cell lysates were processed for western blot and probed with indicated antibodies. IRS1 phosphorylation (Tyr895) was quantified and normalized to DMSO treatment (bottom panel). The drug concentrations were as follows: AKTi: 0.25 μM; LAP (L): 0.5 μM; OSI (O): 0.5 μM; JNJ (J): 0.05 μM.
Figure 7
Figure 7. Schematic diagram of the RTK signaling pathways in the KRAS/BRAF mutant CRC cells
(A) Regulation of AKT and ERK in KRAS mutant cancer cells. Left: Untreated cells. Middle: AKTi-treated cells. Right: MEKi-treated cells. (B). Regulation of AKT and ERK in BRAF mutant cancer cells. Left: Untreated cells. Middle: AKTi-treated cells. Right: MEKi-treated cells. In the KRAS mutant cells, AKT is activated by both the mutant RAS and normal RTKs, but inhibited by a negative feedback mechanism through the RTK-IRS1-PI3K pathway. ATKi inhibits the phosphorylation of AKT, but also relieves the feedback inhibition of RTK and/or IRS1, leading to reactivation of AKT. ERK on the other hand is activated mainly by the mutant RAS, while inhibited by another feedback mechanism through CRAF. MEKi inhibits the phosphorylation of ERK, but relieves the feedback inhibition of CRAF, leading to the reactivation of ERK. In the BRAF mutant cells, AKT and ERK are regulated by similar positive and negative pathways as that in the KRAS mutant cells, except that ERK is activated by the mutant BRAF instead of KRAS.

Similar articles

Cited by

References

    1. Lemmon MA, Schlessinger J. Cell signaling by receptor tyrosine kinases. Cell. 2010;141:1117–34. doi: 10.1016/j.cell.2010.06.011. - DOI - PMC - PubMed
    1. Choura M, Rebai A. Receptor tyrosine kinases: from biology to pathology. J Recept Signal Transduct Res. 2011;31:387–94. doi: 10.3109/10799893.2011.625425. - DOI - PubMed
    1. Logue JS, Morrison DK. Complexity in the signaling network: insights from the use of targeted inhibitors in cancer therapy. Genes Dev. 2012;26:641–50. doi: 10.1101/gad.186965.112. - DOI - PMC - PubMed
    1. Volinsky N, Kholodenko BN. Complexity of receptor tyrosine kinase signal processing. Cold Spring Harb Perspect Biol. 2013;5:a009043. doi: 10.1101/cshperspect.a009043. - DOI - PMC - PubMed
    1. Mendoza MC, Er EE, Blenis J. The Ras-ERK and PI3K-mTOR pathways: cross-talk and compensation. Trends Biochem Sci. 2011;36:320–8. doi: 10.1016/j.tibs.2011.03.006. - DOI - PMC - PubMed

MeSH terms

Substances