. 2017 Mar 3;120(5):848-861.
doi: 10.1161/CIRCRESAHA.116.309833. Epub 2016 Dec 21.

Direct Reprogramming of Human Dermal Fibroblasts Into Endothelial Cells Using ER71/ETV2

Affiliations

Direct Reprogramming of Human Dermal Fibroblasts Into Endothelial Cells Using ER71/ETV2

Sangho Lee et al. Circ Res. .

Abstract

Rationale: Direct conversion or reprogramming of human postnatal cells into endothelial cells (ECs), bypassing stem or progenitor cell status, is crucial for regenerative medicine, cell therapy, and pathophysiological investigation but has remained largely unexplored.

Objective: We sought to directly reprogram human postnatal dermal fibroblasts to ECs with vasculogenic and endothelial transcription factors and determine their vascularizing and therapeutic potential.

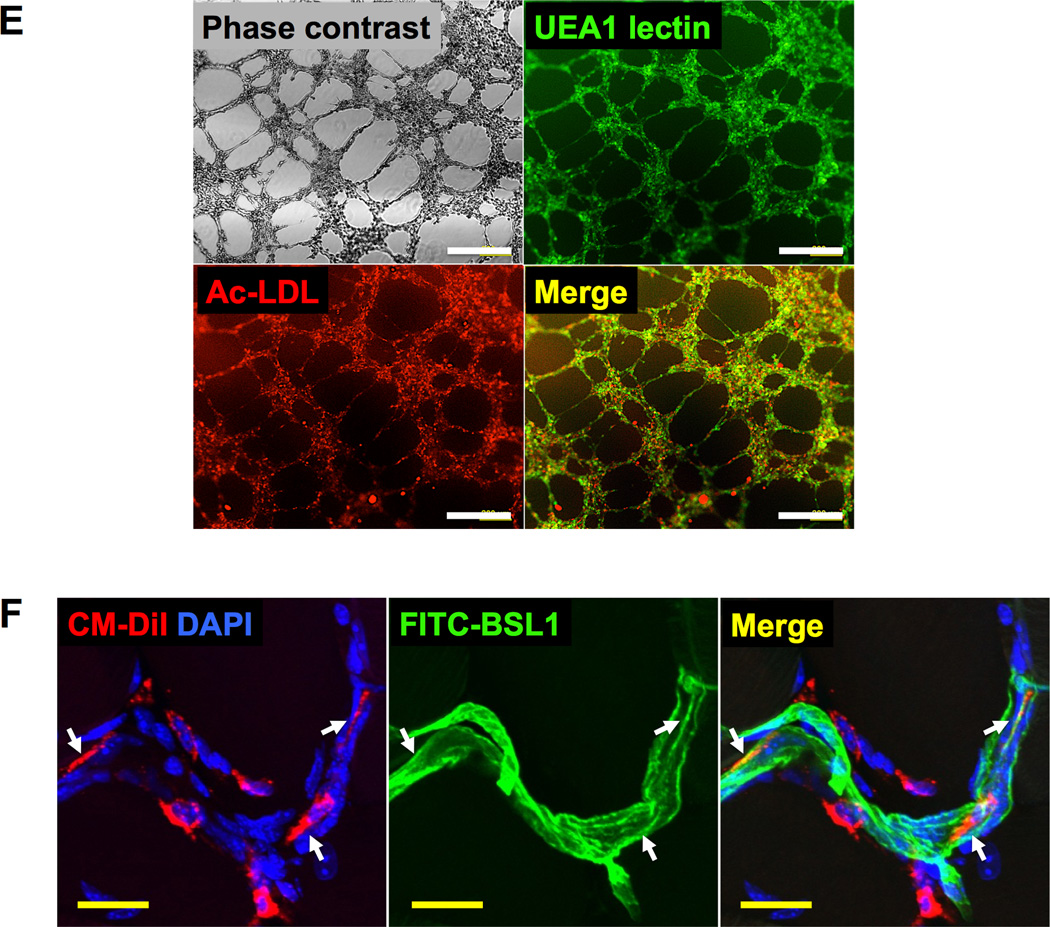
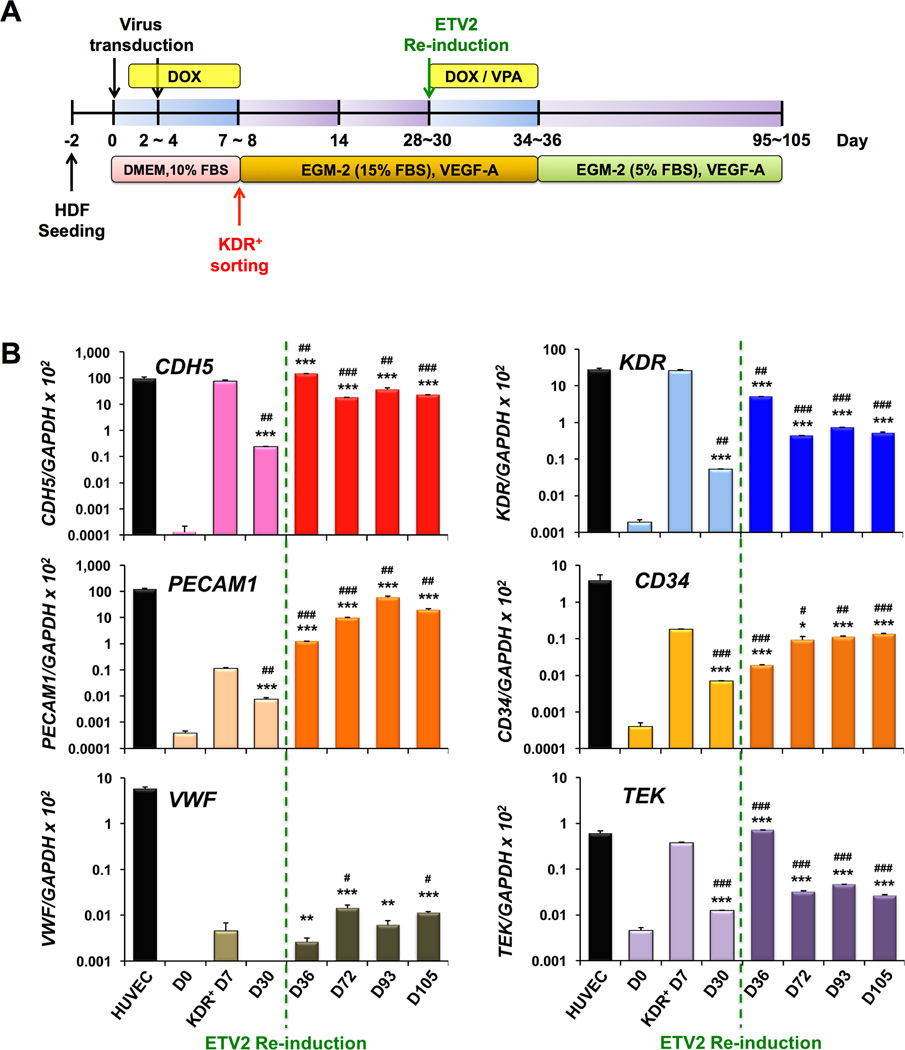
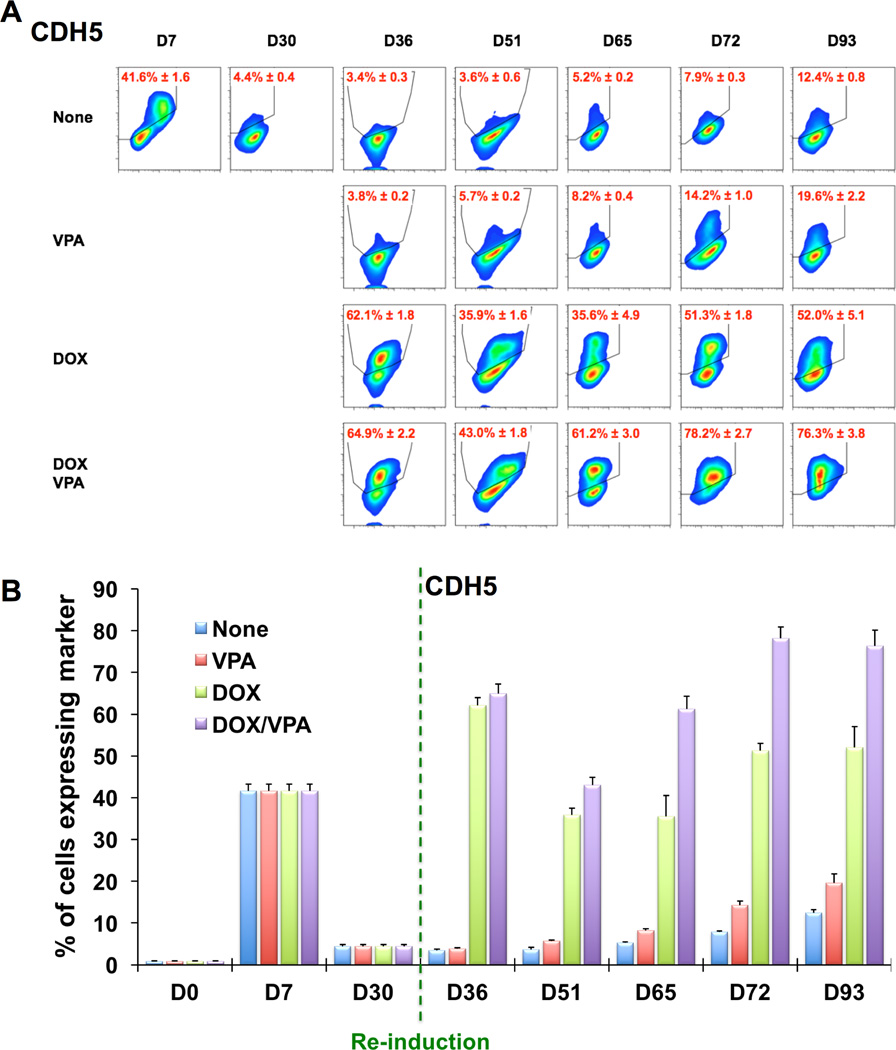
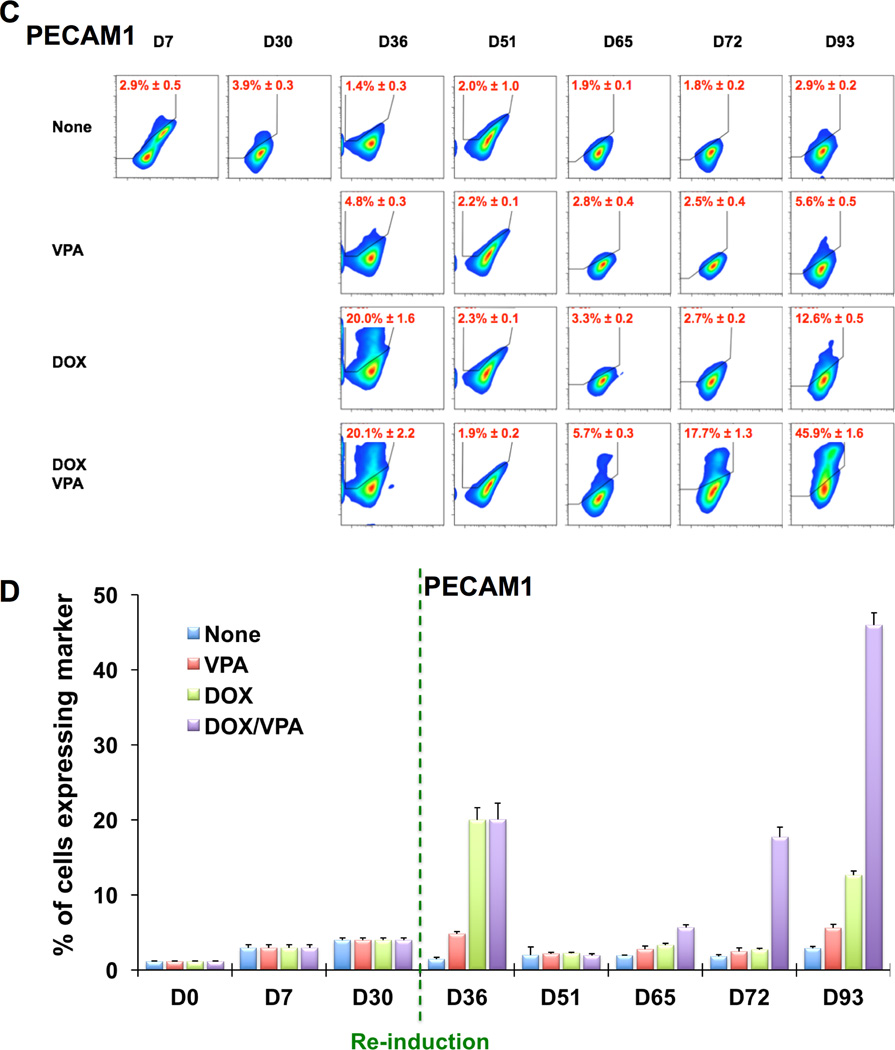
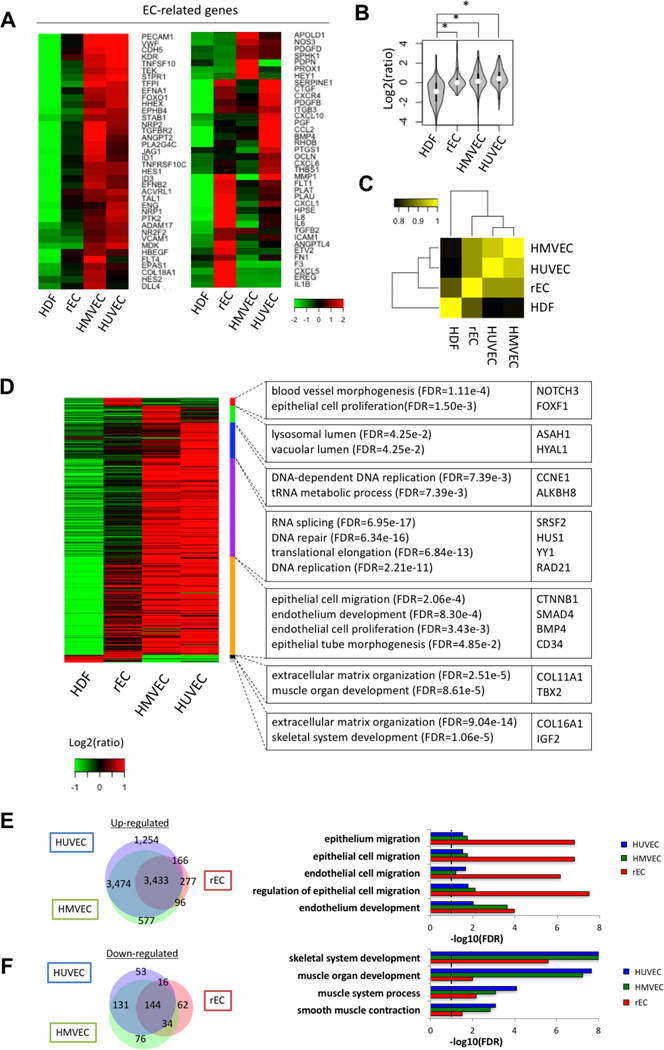
Methods and results: We utilized various combinations of 7 EC transcription factors to transduce human postnatal dermal fibroblasts and found that ER71/ETV2 (ETS variant 2) alone best induced endothelial features. KDR+ (kinase insert domain receptor) cells sorted at day 7 from ER71/ETV2-transduced human postnatal dermal fibroblasts showed less mature but enriched endothelial characteristics and thus were referred to as early reprogrammed ECs (rECs), and did not undergo maturation by further culture. After a period of several weeks' transgene-free culture followed by transient reinduction of ER71/ETV2, early rECs matured during 3 months of culture and showed reduced ETV2 expression, reaching a mature phenotype similar to postnatal human ECs. These were termed late rECs. While early rECs exhibited an immature phenotype, their implantation into ischemic hindlimbs induced enhanced recovery from ischemia. These 2 rECs showed clear capacity for contributing to new vessel formation through direct vascular incorporation in vivo. Paracrine or proangiogenic effects of implanted early rECs played a significant role in repairing hindlimb ischemia.

Conclusions: This study for the first time demonstrates that ER71/ETV2 alone can directly reprogram human postnatal cells to functional, mature ECs after an intervening transgene-free period. These rECs could be valuable for cell therapy, personalized disease investigation, and exploration of the reprogramming process.

Keywords: cell therapy; endothelial cells; fibroblasts; ischemia; regenerative medicine.


Figures

Figure 1
Figure 1. Reprogramming of HDFs to ECs with six EC transcription factors
(A) A schematic of the reprogramming protocol. (B–E) Endothelial characteristics of HDFs infected with lentiviral particles of six TFs (ETV2, FOXC2, MEF2C, SOX17, NANOG, HEY1). The infected HDFs exhibited cobblestone appearance (B), expressed endothelial genes and proteins measured by qRT-PCR (C) and flow cytometry (D), and were able to take up Ac-LDL (red) and form tubular structures (E). Scale bars: (B) 400 µm, (E) 200 µm (yellow) and 1 mm (black). All data are presented as mean ± s.e.m.; three independent experiments, each with technical triplicates.
Figure 2
Figure 2. ETV2 is essential for reprogramming of HDFs to endothelial cells
(A and B) qRT-PCR results of HDFs infected with combinations of five TFs for CDH5 (A) and KDR (B) at day (D) 6, 12, and 18. (C) qRT-PCR results of HDFs infected with one to three TFs including ETV2 for various EC genes at D0, 4, and 7. All data are presented as mean ± s.e.m.; three independent experiments, each with technical triplicates.
Figure 3
Figure 3. Endothelial characteristics of the single factor ETV2-transduced, short-term cultured HDFs
(A) Morphologic changes showing emergence of cobblestone appearance in HDFs as early as D2 after transduction with ETV2. (B) Flow cytometric analyses of transduced HDFs at D7 showing expression of CDH5 and KDR. It also shows that about 67% of KDR+ cells expressed CDH5. All data are presented as mean ± s.e.m.; three independent experiments, each with technical triplicates. ***P < 0.001 vs. isotype control, standard unpaired student t test. (C) qRT-PCR analyses demonstrated induction of various endothelial genes in ETV2-transduced HDFs. At D7, the results of unsorted cells and the sorted KDR+ and KDR cells are shown. KDR+ cells showed significantly higher endothelial gene expression (except VWF) compared to unsorted (D7) and KDR cells. All data are presented as mean ± s.e.m.; three independent experiments, each with technical triplicates. ***P < 0.001, **P < 0.01, *P < 0.05, standard unpaired Student’s t test. (D) Immunohistochemistry showed expression of CDH5 and KDR (upper panel), and VWF and PECAM1 (lower panel) in transduced HDFs at D7. (E) The sorted KDR+ cells at D7 formed tubes on Matrigel, also showing Ac-LDL uptake (red) and UEA1 lectin (green) binding. (F) Contribution of reprogrammed HDFs to vessel formation. The transduced HDFs at D7 were labeled with CM-Dil (red), and injected into the wounded skin of mice. Three weeks later, the mice were perfused with BS1 lectin (FITC-BSL1), and tissues were processed for confocal microscopic imaging. Injected cells (red) were either incorporated into the blood vessels as shown by colocalization with BSL1 (green) (arrows) or localized in close proximity to the vessels, indicating contribution to vessel formation. DAPI (blue). Scale bars: (A, E) 400 µm, (D) 100 µm, (G) 25 µm.
Figure 4
Figure 4. Endothelial characterization of long-term cultured KDR+ cells isolated from ETV2-tranduced HDFs, late rECs
(A) A schematic of the culture protocol for long-term cultured ETV2-transduced HDFs, late rECs. (B–D) Endothelial characteristics of the long-term cultured KDR+ cells in vitro which were FACS-sorted from ETV2-tranduced HDFs at D7. qRT-PCR analysis (Y axis shown in log scale) (B) and flow cytometric analysis (C, D) demonstrated increased expression and maintenance of EC genes and proteins to D93. The green lines or arrows indicate the time point of reinduction of ETV2 expression via DOX. Note that ~60% of the cells are positive for PECAM1 at D93 (D). All data are presented as mean ± s.e.m.; three independent experiments, technical triplicates/experiment for qRT-PCR analysis, single/experiment for flow cytometric analysis. ***P < 0.001, **P < 0.01, *P < 0.05, vs. D0;###P < 0.001,##P < 0.01,#P < 0.05, vs. D7, standard unpaired Student’s t test. The cells at D93 were able to form tubular structures and stained positive for Ac-LDL and UEA1-lectin (E). (F) Cells prepared at D93 were labeled with CM-Dil and injected into mice in a hindlimb ischemia model. The mice were perfused with FITC-BSL1 at 3 months, and subjected to immunohistochemistry for confocal microscope imaging. Injected cells (red) were either incorporated into the blood vessels and expressed BSL1 (green) (arrows) or localized close to the vessels, indicating contribution to vessel formation. DAPI (blue). Scale bars: (E) 200 µm, (F) 25 µm.
Figure 5
Figure 5. Flow cytometric analysis of rECs after re-induction of ETV2 by DOX and treatment with VPA
Flow cytometric analyses of CDH5 (A and B) and PECAM1 (C and D) in rECs after the following treatments. None (blue): no re-induction of ETV2 (no DOX) and no VPA, VPA (red): VPA without re-induction of ETV2 (no DOX), DOX (green): re-induction of ETV2 (+DOX) without VPA, DOX/VPA (purple): re-induction of ETV2 (+DOX) with VPA. Shown are the representative plots of flow cytometry (A and C) and their quantification results (B and D). All data are presented as mean ± s.e.m.; three independent experiments.
Figure 6
Figure 6. Transcriptome analysis on late rECs via RNA sequencing
(A) Heatmap representing EC-related genes with 2-fold difference. Expression values relative to the average expression values across all samples were represented by colors from green to red (log2 scale). (B) Comparison of EC-related genes among four samples. *P < 0.05 by two-sided Student’s t test. (C) Global gene expression similarity among HDFs, rECs, HMVECs and HUVECs. The color from black to yellow represents Pearson correlation. (D) Heatmap showing differentially-expressed genes in rECs, HMVECs and HUVECs compared to HDFs. Relative expression levels to median value with log2 scale were shown by green to red colors. Representative GO terms and gene symbols were also shown in right panel. (E) Overlap of highly-expressed genes (> 2 fold) among rECs, HMVECs and HUVECs. The right panel represents significant GO terms of up-regulated genes. (F) Overlap of lowly-expressed genes (> 2 fold) among rECs, HMVECs and HUVECs. The right panel represents significant GO terms of down-regulated genes.
Figure 7
Figure 7. Enhanced blood flow recovery and neovascularization by rECs in ischemic hindlimbs
Early rECs were intramuscularly injected into ischemic himdlimbs of nude mice. (A, B) Laser Doppler perfusion images (A) and quantitative analysis of blood flow (B) showed improved limb perfusion in the rEC- compared to the HUVEC-, HDF- or PBS-group. All data are presented as mean ± s.e.m.; n = 5 for rEC-, 10 for HUVEC-, 5 for HDF-, or 6 for PBS-group. ***P < 0.001, **P < 0.01, Repeated Measures ANOVA followed by multiple comparisons with Bonferroni’s method. (C) The rEC-injected group showed lower limb loss score compared to the HUVEC-, HDF-, or PBS-groups at day 28, suggesting better limb protection. All data are presented mean ± s.e.m.; n = 5 for rEC-, 10 for HUVEC-, 5 for HDF-, or 6 for PBS-group. **P < 0.01, *P < 0.05, standard unpaired Student’s t test. (D) The mice were perfused with FITC-BSL1 at 4 weeks and the frozen-sections of the muscle were examined under confocal microscope imaging. Quantitative analysis of vascular density is shown. Note that the vascular density was significantly increased in the rEC-, compared to the HDF-, HUVEC- or PBS-groups. All data are presented as mean ± s.e.m.; n = 5 for rEC-, 10 for HUVEC-, 5 for HDF-, or 6 for PBS-group. ***P < 0.001, **P < 0.01, standard unpaired Student’s t test. (E) Injected rECs (red) were incorporated into the blood vessels (green) as indicated by arrows, suggesting contribution of the rECs to vessel formation. DAPI (blue). Scale bars: 25 µm. (F) Early rECs transduced with lentiviral-eGFP (green) were injected into ischemic hindlimbs. The mice were perfused with Rhodamine-BSL1 (red) at 28 days and the frozen-sections of the hindlimb muscle were subjected to confocal microscope imaging. The co-localization of GFP-rEC (green) and BSL1-labeled blood vessel (red) is indicated by arrows and confirmed by orthogonal image. Scale bars: 50 µm. (G) Increased expression levels of angiogenic genes in early rECs compared to HUVECs. Red and green indicate decreased and increased levels of gene expression, respectively.

Comment in

References

    1. Fadini GP, Losordo D, Dimmeler S. Critical reevaluation of endothelial progenitor cell phenotypes for therapeutic and diagnostic use. Circ Res. 2012;110:624–637. - PMC - PubMed
    1. O'Neill TJt, Wamhoff BR, Owens GK, Skalak TC. Mobilization of bone marrow-derived cells enhances the angiogenic response to hypoxia without transdifferentiation into endothelial cells. Circ Res. 2005;97:1027–1035. - PubMed
    1. Ziegelhoeffer T, Fernandez B, Kostin S, Heil M, Voswinckel R, Helisch A, Schaper W. Bone marrow-derived cells do not incorporate into the adult growing vasculature. Circ Res. 2004;94:230–238. - PubMed
    1. Cohen DE, Melton D. Turning straw into gold: directing cell fate for regenerative medicine. Nat Rev Genet. 2011;12:243–252. - PubMed
    1. Knoepfler PS. Deconstructing stem cell tumorigenicity: a roadmap to safe regenerative medicine. Stem Cells. 2009;27:1050–1056. - PMC - PubMed