. 2017 Feb 3;292(5):1884-1898.
doi: 10.1074/jbc.M116.762393. Epub 2016 Dec 21.

Nuclear Localization of Integrin Cytoplasmic Domain-associated Protein-1 (ICAP1) Influences β1 Integrin Activation and Recruits Krev/Interaction Trapped-1 (KRIT1) to the Nucleus

Affiliations

Nuclear Localization of Integrin Cytoplasmic Domain-associated Protein-1 (ICAP1) Influences β1 Integrin Activation and Recruits Krev/Interaction Trapped-1 (KRIT1) to the Nucleus

Kyle M Draheim et al. J Biol Chem. .

Abstract

Binding of ICAP1 (integrin cytoplasmic domain-associated protein-1) to the cytoplasmic tails of β1 integrins inhibits integrin activation. ICAP1 also binds to KRIT1 (Krev interaction trapped-1), a protein whose loss of function leads to cerebral cavernous malformation, a cerebrovascular dysplasia occurring in up to 0.5% of the population. We previously showed that KRIT1 functions as a switch for β1 integrin activation by antagonizing ICAP1-mediated inhibition of integrin activation. Here we use overexpression studies, mutagenesis, and flow cytometry to show that ICAP1 contains a functional nuclear localization signal and that nuclear localization impairs the ability of ICAP1 to suppress integrin activation. Moreover, we find that ICAP1 drives the nuclear localization of KRIT1 in a manner dependent upon a direct ICAP1/KRIT1 interaction. Thus, nuclear-cytoplasmic shuttling of ICAP1 influences both integrin activation and KRIT1 localization, presumably impacting nuclear functions of KRIT1.

Keywords: ICAP1 (integrin cytoplasmic domain-associated protein); KRIT1 (Krev interaction trapped); cell compartmentalization; cerebral cavernous malformation; integrin; protein targeting.


Figures

FIGURE 1.
FIGURE 1.
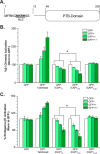
ICAP1FL is less efficient than ICAP1PTB at repressing β1 integrin activation in CHO cells. A, schematic of ICAP1 noting the NLS sequence and PTB-domain boundaries. B and C, CHO-α5β1 cells (B) or CHO cells (C) were transfected with GFP, GFP-ICAP1FL, GFP-ICAP1PTB, the integrin binding-defective mutant GFP-ICAP1FL/β1, or GFP-talin head, and the activation of stably expressed chimeric αIIbα5β3β1 (B) or endogenous α5β1 (C) integrins was assessed by flow cytometry. Gating on cell populations with different GFP intensities permits analysis of dose-dependent effects. The activation index of each gated population was expressed as the percentage of that in the GFP-negative population. Results are presented as mean percentage ± S.E. (error bars) of the activation index in the untransfected (GFP−) population from 4–8 independent experiments. *, p ≤ 0.01 as determined by a two-way ANOVA with Tukey's correction for multiple tests.
FIGURE 2.
FIGURE 2.
ICAP1FL and ICAP1PTB bind integrin β1 tails equally well. A, pull-down of GFP-tagged ICAP1 constructs from CHO cell lysates with purified recombinant αIIb or β1 integrin tails. Tail loading was assessed by Coomassie Blue staining. The input lane indicates 5% of input lysate. B, ICAP1 binding to purified recombinant αIIb and β1 tails was quantified and expressed as a percentage of input (mean ± S.E. (error bars); n = 4). C, increasing amounts of purified ICAP1FL or ICAP1PTB were pulled down with His-tagged integrin tails (either αIIb or β1a) immobilized on beads. Protein was detected by immunoblot analysis. D, a binding curve was generated by quantifying the bands, normalizing to the input control, and plotting the relative signal versus the input of purified protein (mean ± S.D. (error bars), n = 3).
FIGURE 3.
FIGURE 3.
ICAP1FL is more nuclear than ICAP1PTB. A, CHO cells overexpressing GFP-tagged ICAP1 constructs were plated on fibronectin, fixed 24 h later, and stained with DAPI to identify nuclei. Representative images are shown; bar, 10 μm. B, percentage of GFP intensity in the nucleus compared with the integrated GFP intensity of the entire cell was calculated using CellProfiler version 2.0. Boxes, 25th through 50th and 50th through 75th percentile; whiskers, 5th through 95th percentile (n = 97–130 cells from 5 independent experiments). *, p ≤ 0.0001 as determined by a one-way ANOVA with Tukey's correction for multiple tests. C, representative fractionation of CHO cells overexpressing GFP-tagged ICAP1 constructs. C, 28% of the cytoplasmic fraction; N, 80% of the nuclear fraction. Carbonyl reductase (CBR1) and histone deacetylase (HDAC1) represent quality controls for cytoplasmic and nuclear fractions, respectively. D, quantification of cell fractionation data, where the percentage nuclear = total nuclear/(total nuclear N + total cytoplasmic) × 100 (bar, mean percentage nuclear value; n = 10). *, p ≤ 0.001 as determined by a one-way ANOVA with Tukey's correction for multiple tests.
FIGURE 4.
FIGURE 4.
ICAP1 contains a functional NLS. A, CHO cells overexpressing GFP-tagged ICAP1 constructs were plated on fibronectin, fixed 24 h later, and stained with DAPI to identify nuclei. Representative images are shown; bar, 10 μm. B, relative amount of GFP intensity in the nucleus compared with the integrated GFP intensity of the entire cell. Boxes, 25th through 50th and 50th through 75th percentile; whiskers, 5th through 95th percentile (n = 88–139 cells from 5 independent experiments). *, p ≤ 0.005 as determined by a one-way ANOVA with Tukey's correction for multiple tests. C, representative fractionation of CHO cells overexpressing GFP-tagged ICAP1 constructs. C, 28% of the cytoplasmic fraction; N, 80.0% of the nuclear fraction. Carbonyl reductase (CBR1) and histone deacetylase (HDAC1) represent quality controls for cytoplasmic and nuclear fractions, respectively. D, quantification of cell fractionation data where the percentage nuclear = total nuclear/(total nuclear N + total cytoplasmic) × 100 (bar, mean percentage nuclear value; n = 9). *, p ≤ 0.02 as determined by a one-way ANOVA with Tukey's correction for multiple tests.
FIGURE 5.
FIGURE 5.
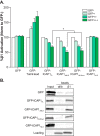
Localization of ICAP1 to the nucleus diminishes its suppression of β1-integrin activation. A, CHO cells were transfected with GFP, GFP-talin head, or GFP-tagged ICAP1 constructs, and the activation of stably expressed chimeric αIIbα5β3β1 integrins was assessed by flow cytometry. Gating on cell populations with different GFP intensities permits analysis of the dose dependence of effects. Results are the mean percentage ± S.E. (error bars) of the untransfected (GFP−) population from 6–8 independent experiments. *, p ≤ 0.001 as determined by a two-way ANOVA with Tukey's correction for multiple tests. B, pull-down of GFP-tagged ICAP1 constructs from CHO cell lysates with purified recombinant αIIb or β1 integrin tails. Tail loading was assessed by Coomassie Blue staining. The input lane indicates 5% of input lysate. Results shown are representative of four independent experiments.
FIGURE 6.
FIGURE 6.
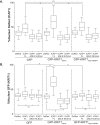
Localization of KRIT1Nterm is driven by ICAP1. A and B, CHO cells co-overexpressing GFP-tagged KRIT1 constructs and DsRed-tagged ICAP1 constructs were plated on fibronectin, fixed 24 h later, and stained with DAPI to identify nuclei. Images were analyzed using CellProfiler. Percentage nuclear fluorescence compared with the total integrated fluorescence intensity of the entire cell for DsRed (A) and GFP (B) was calculated. Boxes, 25th through 50th and 50th through 75th percentile; whiskers, 5th through 95th percentile (n = 62–138 cells from 3 independent experiments). *, p ≤ 0.0001 as determined by a one-way ANOVA with Tukey's correction for multiple tests.
FIGURE 7.
FIGURE 7.
Evaluation of putative KRIT1 localization sequences. A, schematic of KRIT1 noting the sequence of NLS1, NES, and NLS2 as well as domain boundaries. B, CHO cells overexpressing GFP-tagged KRIT1 constructs were plated on fibronectin, fixed 24 h later, and stained with DAPI to identify nuclei. Representative images are shown; bar, 10 μm. C, relative amount of GFP intensity in the nucleus compared with the integrated GFP intensity of the entire cell. Boxes, 25th through 50th and 50th through 75th percentile; whiskers, 5th through 95th percentile (n = 85–157 cells from 4 independent experiments). *, p ≤ 0.0001 as determined by a one-way ANOVA with Tukey's correction for multiple tests.
FIGURE 8.
FIGURE 8.
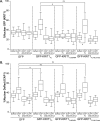
Localization of KRIT1FL is driven by ICAP1. CHO cells co-overexpressing GFP or GFP-tagged KRIT1 constructs and DsRed-tagged ICAP1 constructs were plated on fibronectin, fixed 24 h later, and stained with DAPI to identify nuclei. A and B, percentage nuclear fluorescence compared with the integrated fluorescence intensity of the entire cell for GFP (A) and DsRed (B) was calculated. Boxes, 25th through 50th and 50th through 75th percentile; whiskers, 5th through 95th percentile (n = 47–103 cells from three independent experiments). *, p ≤ 0.0001 as determined by a one-way ANOVA with Tukey's correction for multiple tests.
FIGURE 9.
FIGURE 9.
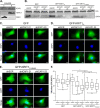
Localization of exogenous KRIT1 in EAhy926 cells changes upon loss of ICAP1. A, representative fractionation of endogenous ICAP1 in EAhy926 cells. C, 28% of the cytoplasmic fraction; N, 80% of the nuclear fraction. Carbonyl reductase (CBR1) and histone deacetylase (HDAC1) represent quality controls for cytoplasmic and nuclear fractions, respectively. Results are representative of three independent experiments. B, immunoblot of EAhy926 lysates that overexpress either GFP or GFP-tagged KRIT1 constructs and have been infected with either an shSCR or shRNAs targeting ICAP1 (shICAP1-21, shICAP1-23). Vinculin (VCL) was used as a loading control. C–E, EAhy926 cells infected with either shSCR or shICAP1 and overexpressing GFP or GFP-tagged KRIT1 constructs were plated on fibronectin, fixed 24 h later, and stained with DAPI to identify nuclei. Representative images are shown; bar, 10 μm. F, percentage of GFP intensity in the nucleus compared with the integrated GFP intensity of the entire cell. Boxes, 25th through 50th and 50th through 75th percentile; whiskers, 5th through 95th percentile (n = 88–93 cells from 3 independent experiments). *, p ≤ 0.0001 as determined by a one-way ANOVA with Tukey's correction for multiple tests.

Similar articles

Cited by

References

    1. Hynes R. O. (2002) Integrins: bidirectional, allosteric signaling machines. Cell 110, 673–687 - PubMed
    1. Harburger D. S., and Calderwood D. A. (2009) Integrin signalling at a glance. J. Cell Sci. 122, 159–163 - PMC - PubMed
    1. Morse E. M., Brahme N. N., and Calderwood D. A. (2014) Integrin cytoplasmic tail interactions. Biochemistry 53, 810–820 - PMC - PubMed
    1. Iwamoto D. V., and Calderwood D. A. (2015) Regulation of integrin-mediated adhesions. Curr. Opin. Cell Biol. 36, 41–47 - PMC - PubMed
    1. Calderwood D. A., Campbell I. D., and Critchley D. R. (2013) Talins and kindlins: partners in integrin-mediated adhesion. Nat. Rev. Mol. Cell Biol. 14, 503–517 - PMC - PubMed

MeSH terms