. 2017 Feb 10;292(6):2266-2277.
doi: 10.1074/jbc.M116.767681. Epub 2016 Dec 21.

Stromal Interaction Molecule 1 (STIM1) Regulates ATP-sensitive Potassium (KATP) and Store-operated Ca2+ Channels in MIN6 β-Cells

Affiliations

Stromal Interaction Molecule 1 (STIM1) Regulates ATP-sensitive Potassium (KATP) and Store-operated Ca2+ Channels in MIN6 β-Cells

Colin A Leech et al. J Biol Chem. .

Abstract

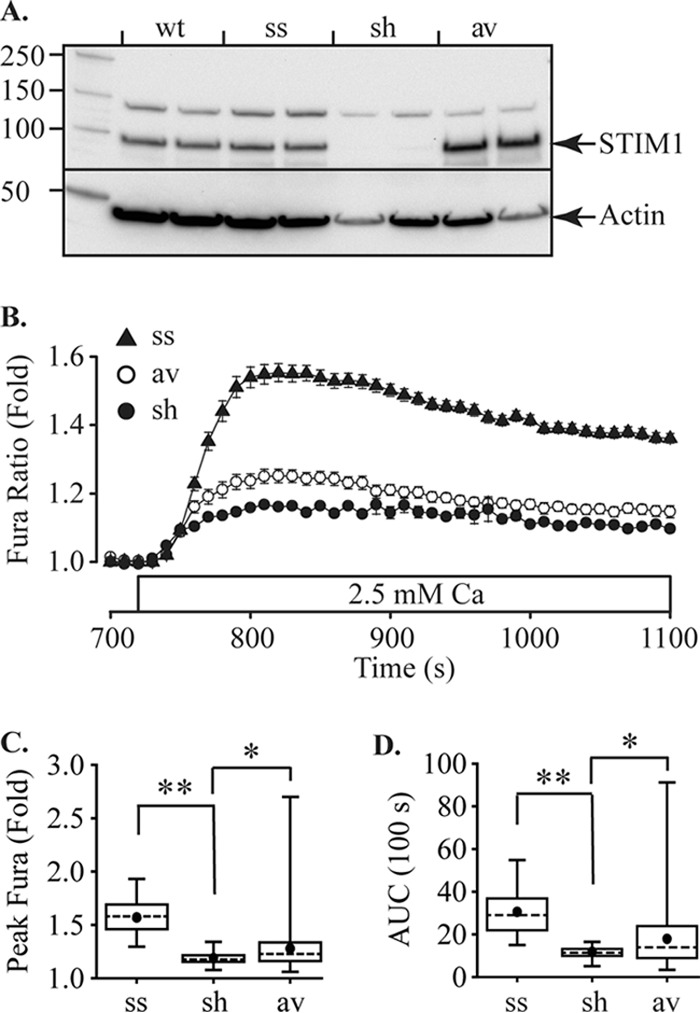
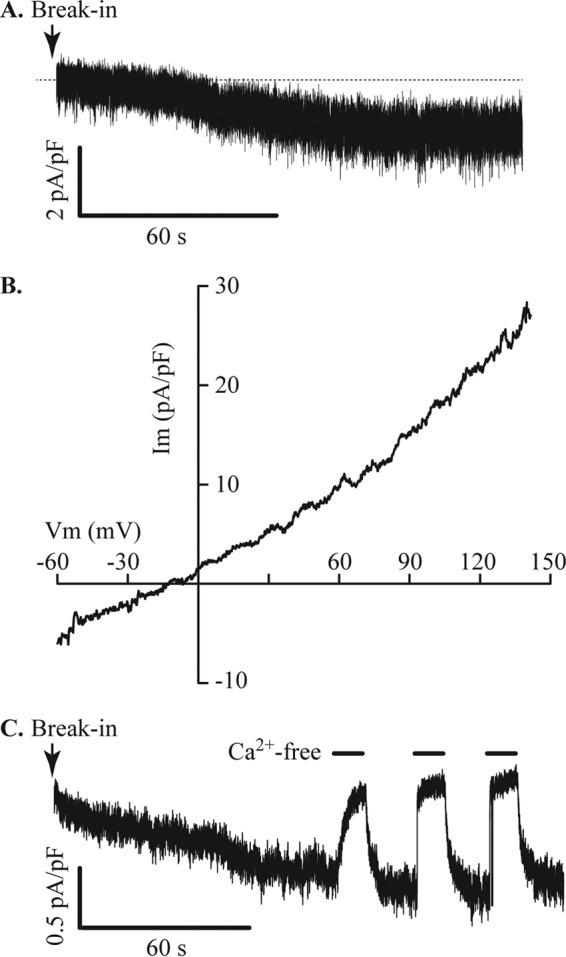
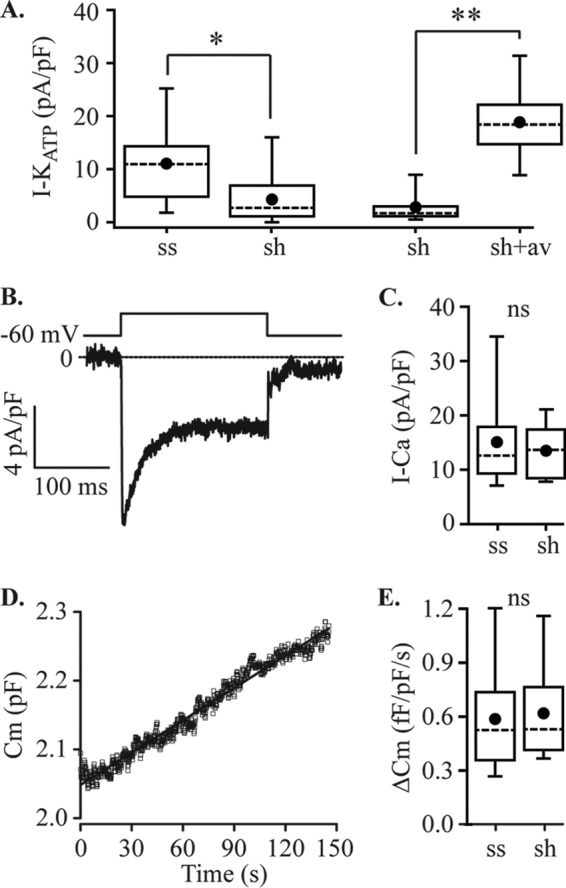
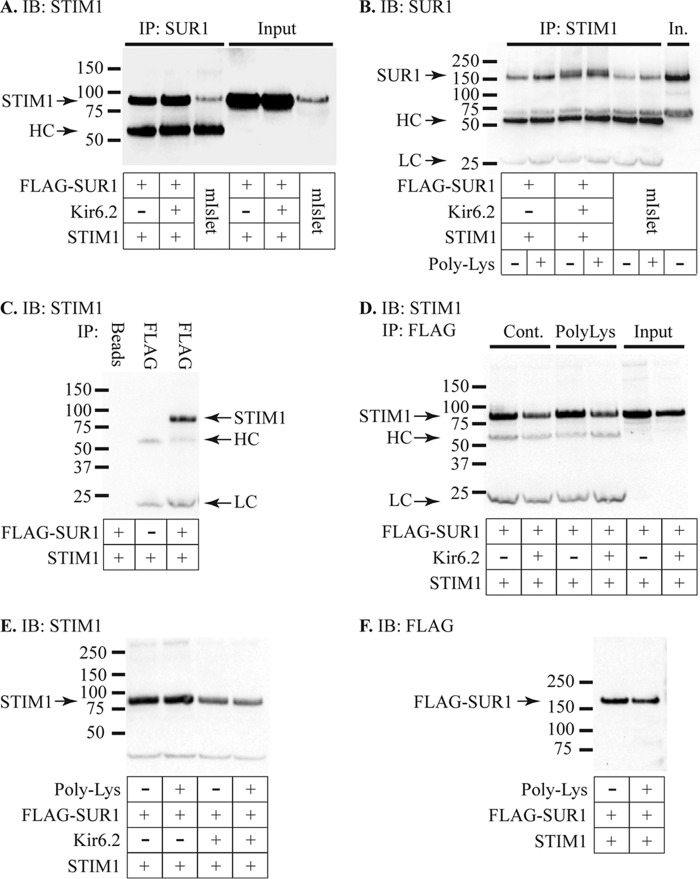
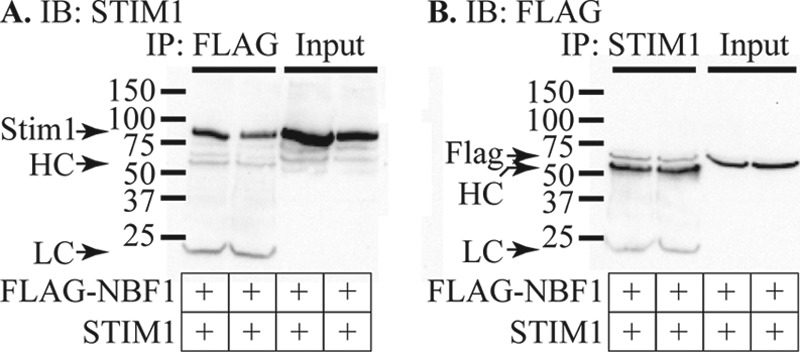
Stromal interaction molecule 1 (STIM1) regulates store-operated Ca2+ entry (SOCE) and other ion channels either as an endoplasmic reticulum Ca2+-sensing protein or when present in the plasma membrane. However, the role of STIM1 in insulin-secreting β-cells is unresolved. We report that lowering expression of STIM1, the gene that encodes STIM1, in insulin-secreting MIN6 β-cells with RNA interference inhibits SOCE and ATP-sensitive K+ (KATP) channel activation. The effects of STIM1 knockdown were reversed by transduction of MIN6 cells with an adenovirus gene shuttle vector that expressed human STIM1 Immunoprecipitation studies revealed that STIM1 binds to nucleotide binding fold-1 (NBF1) of the sulfonylurea receptor 1 (SUR1) subunit of the KATP channel. Binding of STIM1 to SUR1 was enhanced by poly-lysine. Our data indicate that SOCE and KATP channel activity are regulated by STIM1. This suggests that STIM1 is a multifunctional signaling effector that participates in the control of membrane excitability and Ca2+ signaling events in β-cells.

Keywords: Ca2+ signaling; KATP channels; STIM1; SUR1; beta cell (B-cell); calcium imaging; cell signaling; electrophysiology; endoplasmic reticulum (ER); store-operated ion channels.


Conflict of interest statement

The authors declare that they have no conflicts of interest with the contents of this article

Figures

FIGURE 1.
FIGURE 1.
Store-operated Ca2+ entry in MIN6 cells. A, MIN6 cells were loaded with Fura 2 and perifused with test solutions containing 2 mm glucose at 37 °C. Cells were initially bathed in normal, 2.5 mm Ca2+ extracellular solution to establish a baseline. The bath solution was then exchanged for Ca2+-free solution (10 μm EGTA), Ca2+-free with 250 μm carbachol (CCh) followed by Ca2+-free with 10 μm cyclopiazonic acid (CPA) to discharge and prevent refilling of intracellular Ca2+ stores. Reintroduction of 2.5 mm Ca2+ caused a rise of cytosolic [Ca2+] ([Ca2+]c) representing SOCE. B, the addition of 5 μm nimodipine (Nimod) before the reintroduction of extracellular Ca2+ caused a small decrease in the peak amplitude. The efficacy of nimodipine to block voltage-gated Ca2+ channels was confirmed by applying a pulse of 56 mm KCl solution (indicated by arrow). Whereas under control conditions KCl elicited a large rise in [Ca2+]c, this rise was inhibited by nimodipine. C, the AUC of the SOCE response shown in B was measured for the 160-s period after Ca2+ addition and was significantly reduced by nimodipine (52 control cells, 24 nimodipine-treated; *, p = 0.002, ANOVA). D, MIN6 cells in a 96-well plate were loaded with Fura 2 in Ca2+-free solution containing 2 mm glucose and 1 μm Tg. The cells were then washed with fresh bath solution containing Tg. Ca2+-free bath solution (Cont) or Ca2+-containing solution with Tg and SKF96365 (final, 2 mm [Ca2+], SKF96365 concentration indicated in μm) was injected at 100 s. SOCE was dose-dependently blocked by SKF96365.Data are plotted as the mean ± S.E., error bars shown are larger than symbols, averaged from 12 wells for each solution and are representative of three independent experiments.
FIGURE 2.
FIGURE 2.
Store-operated Ca2+ entry in MIN6 cells is regulated by STIM1. A, Western blotting shows expression of STIM1 in MIN6 cells and knockdown of STIM1 protein expression by shRNA-STIM1 (sh) relative to either wild-type MIN6 cells (wt) or cells with shRNA-scr (ss). Expression of STIM1 was reconstituted in the shRNA-STIM1 cells by transduction with an adenovirus expression vector encoding the human isoform of STIM1 (av). The left lane shows Mr markers and then duplicate lanes for each cell line. Anti-STIM1 is shown in the top part of the gel and anti-actin as a loading control in the lower part. B, stable MIN6 cell lines were treated using the protocol shown in Fig. 1A. Traces show only the records immediately before and after reintroduction of Ca2+ (indicated by open bar). SOCE in shRNA-STIM1 cells (sh) is inhibited relative to shRNA-scr (ss) and was partially rescued by adenoviral transduction with human STIM1 (av). Traces show the mean ± S.E. The peak SOCE amplitude (C) and AUC for the first 100 s after Ca2+ addition (D) were quantified for ss, sh, and av cells (28, 26 and 139 cells, respectively). Both peak and AUC were significantly reduced for sh cells relative to ss cells and were significantly recovered by av (*, p = 0.05; **, p < 0.01, ANOVA).
FIGURE 3.
FIGURE 3.
Store depletion and activation of an inward current in MIN6 cells. A, membrane current and [Ca2+]ER were measured simultaneously in cells expressing D1ER, a FRET-based genetically encoded indicator of ER Ca2+. Whole cell recording of membrane current with normal bath solution and Cs+ pipette solution designed to passively deplete ER stores is shown. The FRET ratio decreased, proportional to [Ca2+]ER, immediately after break-in to the whole cell configuration. An inward membrane current started to develop within a few seconds and reached a peak after ∼1 min in this cell. The whole cell capacitance (Cm) of the cell illustrated was 4.2 pF. B, the current-voltage relation of the current after a voltage ramp from the holding potential of −60 mV to +40 mV at 1 V/s. This inward current has a linear current-voltage relation, and the mean reversal potential was −12.7 ± 2.3 mV (n = 27, −13.3 mV in the cell illustrated). C, extracellular application of the channel blocker SKF96365 (100 μm) reversibly inhibits the inward current. Break-in for this whole cell record occurred at the start of the trace. Shown is a representative example of six cells with a mean current inhibition of 92.3 ± 2.6% induced by SKF96365.
FIGURE 4.
FIGURE 4.
Inward currents through KATP channels. MIN6 cells were voltage-clamped at −60 mV in the whole cell configuration with a Cs+ pipette solution containing 200 μm EGTA. Under these recording conditions, with normal bath solution, an inward current developed, and the effects of ion substitution were tested. A, the current was not inhibited by substituting extracellular Na+ with NMDG+ (NMG, application indicated by filled bar). B, the inward current amplitude increased upon removal of extracellular Ca2+ (Ca-free, filled bar). C, raising extracellular K+ from 5.9 to 56 mm (56 K, filled bar) produced an increase in current amplitude (−30.9 ± 9.1 pA/pF at normal extracellular K+ and −247.2 ± 75.0 pA/pF at 56 mm K+, n = 7). D, increasing K+ produced a positive shift of the reversal potential for the current. In the cell illustrated, the reversal potential shifted from −16.1 mV to +15.9 mV and recovered to −14.3 mV, the mean change was from −17.6 ± 2.5 mV at normal (5.9 mm K+) to +13.0 ± 3.1 mV at 56 mm K+ and −15.2 ± 2.2 after returning to normal K+. Im, inward current. E, substitution of extracellular Ca2+ for Ba2+ also inhibited the inward current. Current inhibition caused by a 10-s pulse of Ba2+ was 97.1 ± 1.2% (n = 7). F, the inward current was reversibly inhibited by 100 μm tolbutamide (Tolbut). G, increasing concentrations of ATP in the pipette solution inhibited the inward current (Im). Data points were curve-fitted indicating an IC50 of 0.6 mm (data from 9–13 cells at each concentration). H, inhibition of inward current (Im) by 1 mm ATP was reversed by 1 mm ADP (C, control (no ATP), n = 13 cells; ATP, n = 9 cells; ATP+ADP, n = 9 cells).
FIGURE 5.
FIGURE 5.
Store-operated Ca2+ current in MIN6 cells. A, glyburide (1 μm) and nimodipine (10 μm) were added to the bath solution to block KATP and L-type VDCCs, respectively, in cells dialyzed with Cs+ pipette solution containing 5 mm EGTA. Under these conditions a small inward current developed. B, measurement of the reversal potential of the current shown in A indicates that this current is not Ca2+-selective. Im, membrane current; Vm, membrane potential. C, using an extracellular solution containing TEA (substituted for Na+) to block inward K+ currents through KATP channels, a small inward current carried by Ca2+ was revealed. This current was inhibited by transient puffer applications of Ca2+-free bath solution, indicated by filled bars. The current illustrated is representative of seven cells with a mean current density of 0.5 ± 0.1 pA/pF.
FIGURE 6.
FIGURE 6.
Effects of STIM1 knockdown on MIN6 cell membrane currents and Ca2+-dependent exocytosis. A, ShRNA-STIM1 (sh) reduced the amplitude of the inward current recorded with normal bath and Cs+ pipette solutions, as shown in Fig. 3, by ∼50% relative to shRNA-scr (ss) controls (*, p = 0.014; ss, n = 18 cells; sh, n = 24 cells), and this effect was reversed by adenoviral transduction of sh cells with human STIM1 (sh, n = 6 cells; sh + av, n = 8 cells; **, p < 0.001, ANOVA). B and C, STIM1 knockdown had no effect on the amplitude of voltage-dependent Ca2+ currents measured using the same solutions with voltage steps from −60 mV to 0 mV (ss, n = 7 cells; sh, n = 8 cells, not significantly different, ANOVA). A representative example of a record is shown in B, and quantification of peak current data for ss and sh cells is shown in C. D and E, exocytosis measured by capacitance tracking in cells dialyzed with 1.5 μm Ca2+ was also unaffected by STIM1 knockdown. A representative example of a capacitance record is shown in D, and quantification of the data for ss and sh cells shown in E (ss, n = 10 cells; sh, n = 8 cells; ns, not significantly different, ANOVA). The rate of exocytosis was determined by linear fitting of the data using Origin software. For the cell shown in D, the linear fit is illustrated and gave a y intercept of 2.05 pF, used to normalize data to cell size, and the slope was 0.76 fF/pF/s. Cm, whole cell capacitance.
FIGURE 7.
FIGURE 7.
Interaction of STIM1 and KATP. A, IP studies using mouse islet (mIslet) extracts or HEK293T cell extracts expressing STIM1 and FLAG-SUR1 in the presence or absence of Kir6.2. IP was performed using anti-SUR1 antibody followed by IB with anti-STIM1.The SUR1 antibody pulled down STIM1 in all three samples. The input protein (IB only with anti-STIM1) is shown in the right three lanes. The band indicated as HC represents the heavy chain of the IP antibody, detected by the secondary antibody, and is only seen in the three IP samples. Co-immunoprecipitation was observed in two independent experiments using mouse islet or HEK cell proteins performing IP with anti-STIM1 and IB with anti-SUR1. B, IP was performed using anti-STIM1 and IB with anti-SUR1 using the same protein samples as in A, representative of two independent experiments with this protocol. The STIM1 antibody pulled down SUR1 in all three samples, and pulldown was enhanced by adding 50 μg/ml poly-lysine to the samples during IP. The SUR1 antibody exhibited a secondary band of slightly higher molecular weight than the heavy chain band, and subsequent experiments were performed using anti-FLAG to avoid any confounding effects of this band. LC represents the light chain of the IP antibody, and In is the mouse islet input protein. C, control IP studies using HEK293T cells expressing STIM1 in the presence or absence of FLAG-SUR1. IP performed with protein A-agarose beads (Beads) alone with samples expressing STIM1 and FLAG-SUR1 failed to pull down STIM1. IP with the FLAG antibody in cells expressing STIM1 but not FLAG-SUR1 also failed to pull down STIM1. IP using the FLAG antibody did, however, pull down STIM1 in cells expressing both STIM1 and FLAG-SUR1. STIM1 was detected by IB with anti-STIM1 along with nonspecific bands for the heavy-chain (HC) and light-chain (LC) of the FLAG antibody in the two FLAG-IP lanes but not the beads-only lane. IP of STIM1 using the FLAG antibody was observed in six experiments using four different protein samples. D, IP with the FLAG antibody pulled down STIM1 in the presence or absence of Kir6.2 under control conditions, and this pulldown was enhanced by the addition of 50 μg/ml poly-lysine (PolyLys). The image shown is representative of three independent experiments, and the increase in band density with poly-lysine was 27 ± 3% (n = 9, range 17 −44%) relative to control for cells expressing STIM1 and FLAG-SUR1 and 11 ± 1% (n = 6, range 8–16%) for cells expressing STIM1, FLAG-SUR1, and Kir6.2. Densities of STIM1 IB bands were significantly higher for poly-lysine-treated extracts relative to controls for these samples with STIM1 and FLAG-SUR1 (paired t test, p = 0.003) and also for samples with STIM1, FLAG-SUR1, and Kir6.2 (paired t test, p < 0.001). E, the STIM1 band density was 97 ± 2% (n = 6, range 92–102%, not significantly different, paired t test) relative to control for cells expressing STIM1 and FLAG-SUR1 and 94 ± 5% (n = 6, range 83–105%, not significantly different, paired t test) for cells expressing STIM1, FLAG-SUR1, and Kir6.2. F, the FLAG band density was significantly lower with poly-lysine (91 ± 6%, n = 10, range 75–133%, p = 0.04, three independent experiments, paired t test) relative to control for cells expressing STIM1 and FLAG-SUR1 and 83 ± 5% (n = 7, range 74–99%, p = 0.03, two independent experiments, paired t test) for cells expressing STIM1, FLAG-SUR1, and Kir6.2.
FIGURE 8.
FIGURE 8.
STIM1 interacts with NBF-1 of SUR1. HEK293T cells were transfected with STIM1 and FLAG-NBF1 and IP performed using anti-FLAG (A) or anti-STIM1 (B). The data shown are representative of three independent IP experiments using four protein samples from different transfections. A, two protein samples from different transfections were collected and subject to IP using anti-FLAG followed by IB using anti-STIM1. The two left lanes show the results of IP, whereas the two right lanes show the corresponding input protein. The bands marked HC and LC that appear only in the IP lanes represent the heavy and light chains of the IP antibody. B, the same two protein samples as used in A were subjected to IP using anti-STIM1 followed by IB with anti-FLAG. IP lanes are shown on the left side of the panel, whereas the input protein is shown on the right. IP with anti-STIM1 pulled down FLAG-NBF1 and additional bands for the heavy and light chains of the IP antibody can be seen only in the IP lanes.

References

    1. Henquin J. C., Nenquin M., Ravier M. A., and Szollosi A. (2009) Shortcomings of current models of glucose-induced insulin secretion. Diabetes Obes. Metab. 11, 168–179 - PubMed
    1. Jairaman A., and Prakriya M. (2013) Molecular pharmacology of store-operated CRAC channels. Channels 7, 402–414 - PMC - PubMed
    1. Moccia F., Zuccolo E., Soda T., Tanzi F., Guerra G., Mapelli L., Lodola F., and D'Angelo E. (2015) Stim and Orai proteins in neuronal Ca2+ signaling and excitability. Front Cell Neurosci. 9, 153. - PMC - PubMed
    1. Leech C. A., Holz G. G. 4th, and Habener J. F. (1994) Voltage-independent calcium channels mediate slow oscillations of cytosolic calcium that are glucose-dependent in pancreatic beta cells. Endocrinology 135, 365–372 - PMC - PubMed
    1. Worley J. F. 3rd, McIntyre M. S., Spencer B., and Dukes I. D. (1994) Depletion of intracellular Ca2+ stores activates a maitotoxin-sensitive nonselective cationic current in beta cells. J. Biol. Chem. 269, 32055–32058 - PubMed

Publication types

LinkOut - more resources