. 2017 Mar 1;117(3):1126-1142.
doi: 10.1152/jn.00762.2016. Epub 2016 Dec 21.

Dorsal vs. ventral differences in fast Up-state-associated oscillations in the medial prefrontal cortex of the urethane-anesthetized rat

Affiliations

Dorsal vs. ventral differences in fast Up-state-associated oscillations in the medial prefrontal cortex of the urethane-anesthetized rat

Sabine Gretenkord et al. J Neurophysiol. .

Abstract

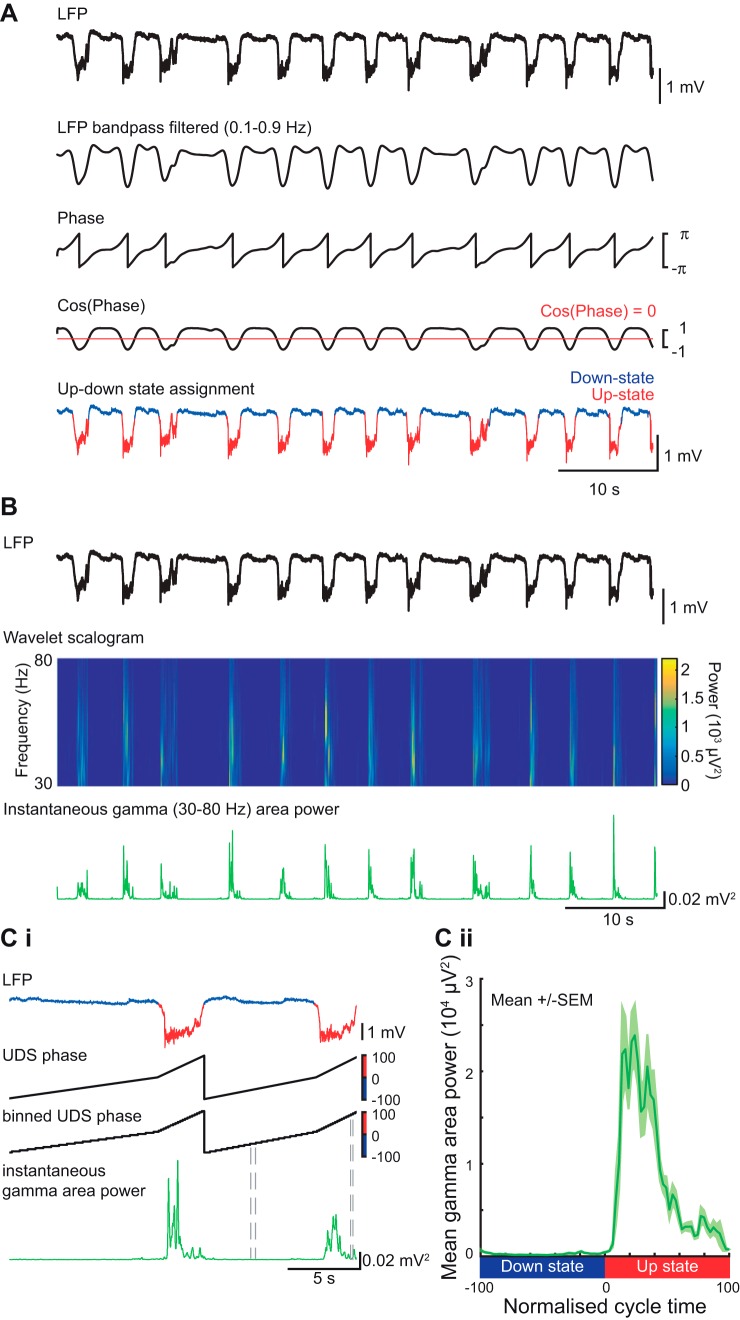
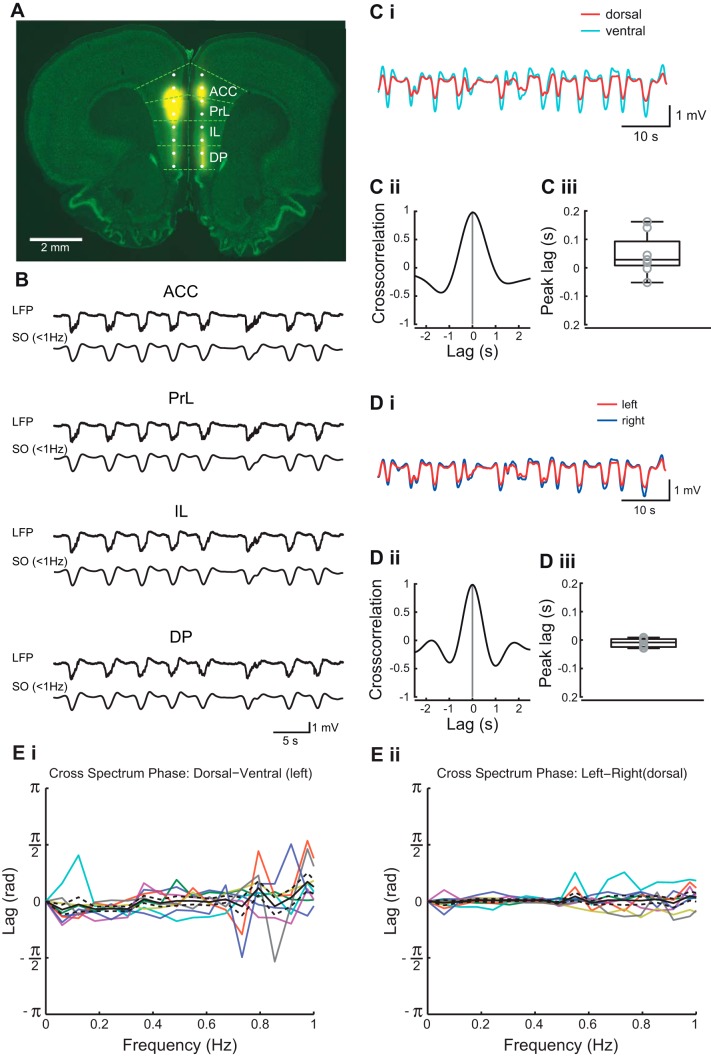
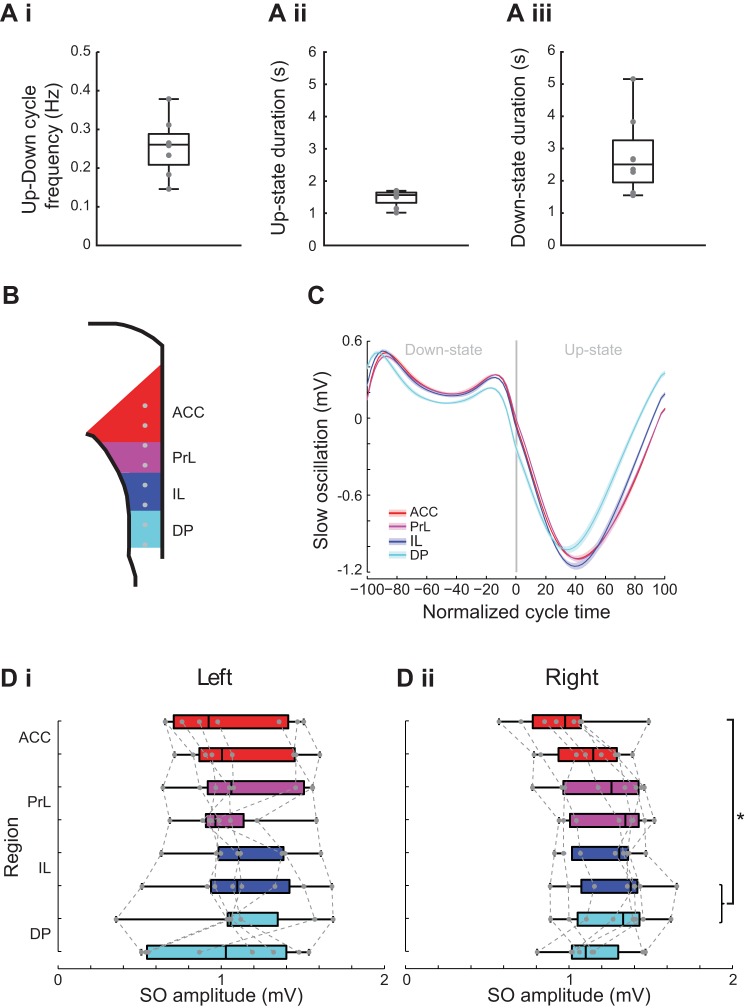
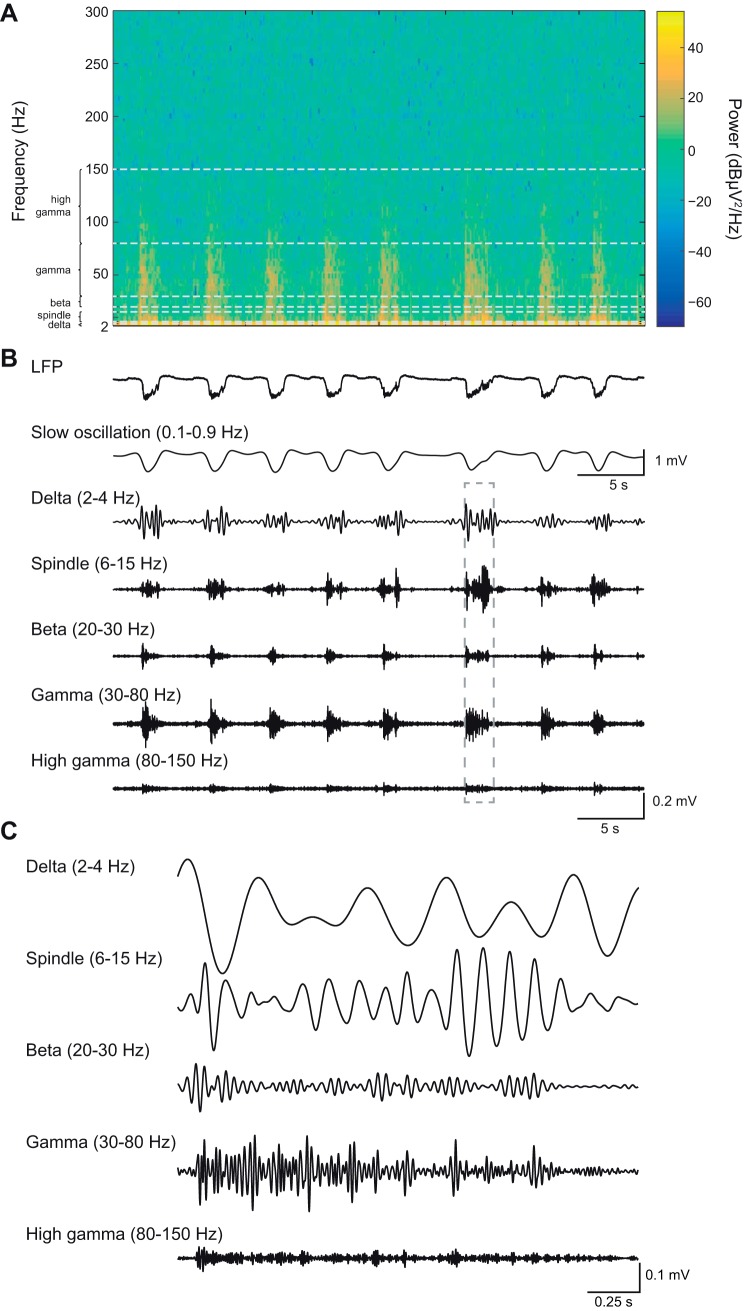
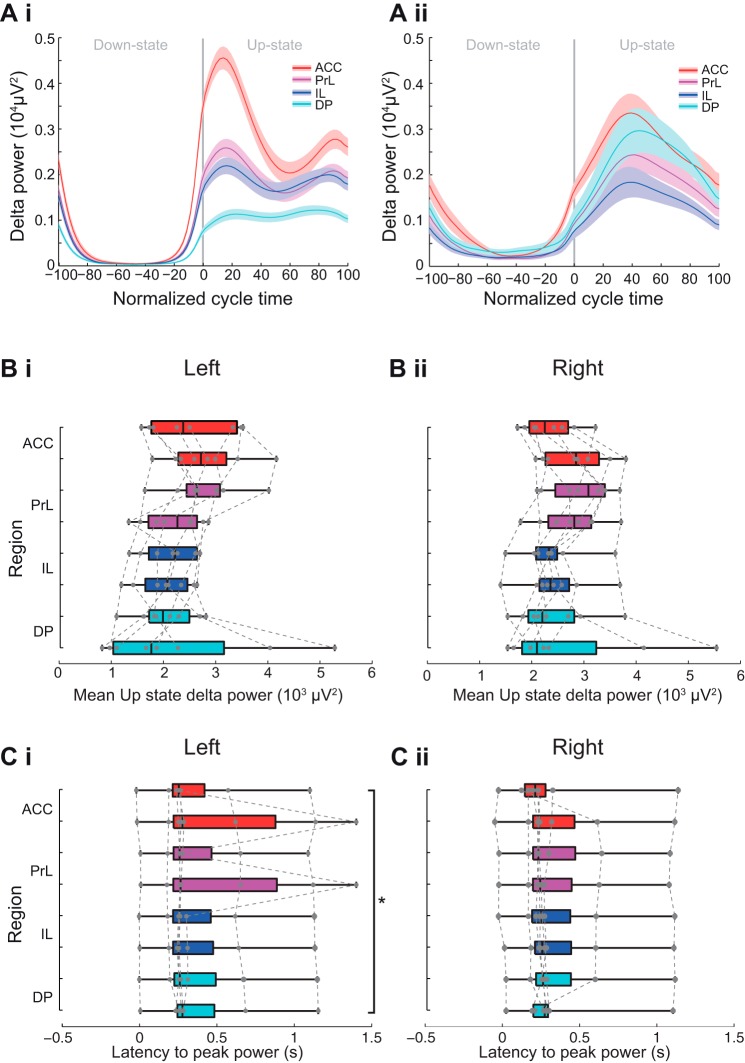
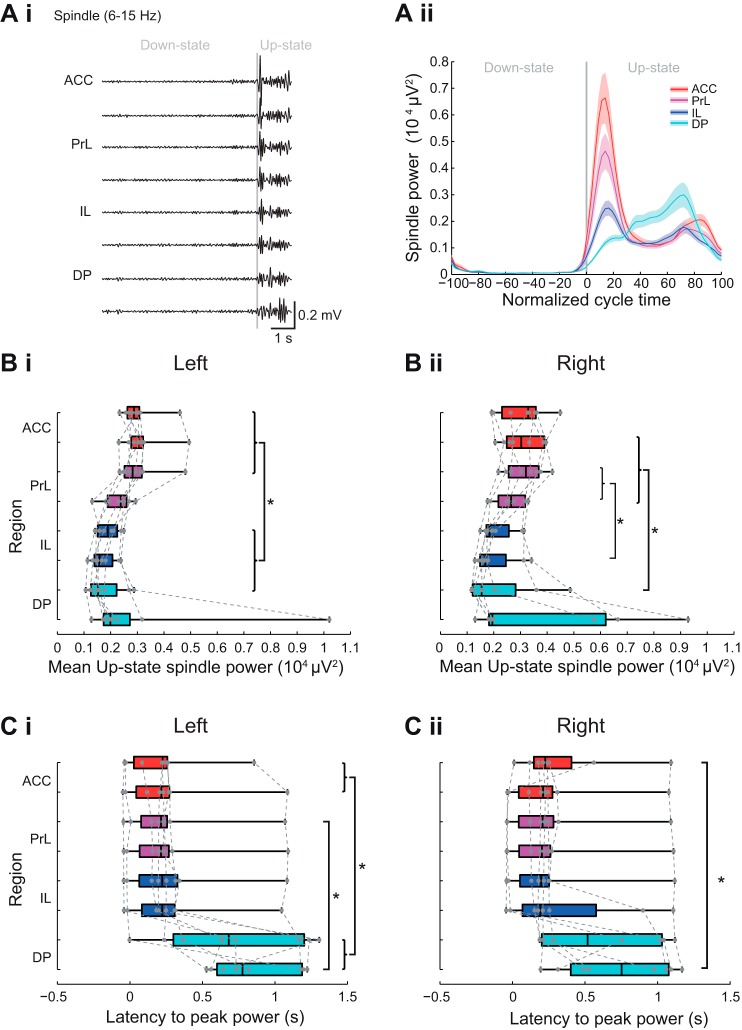
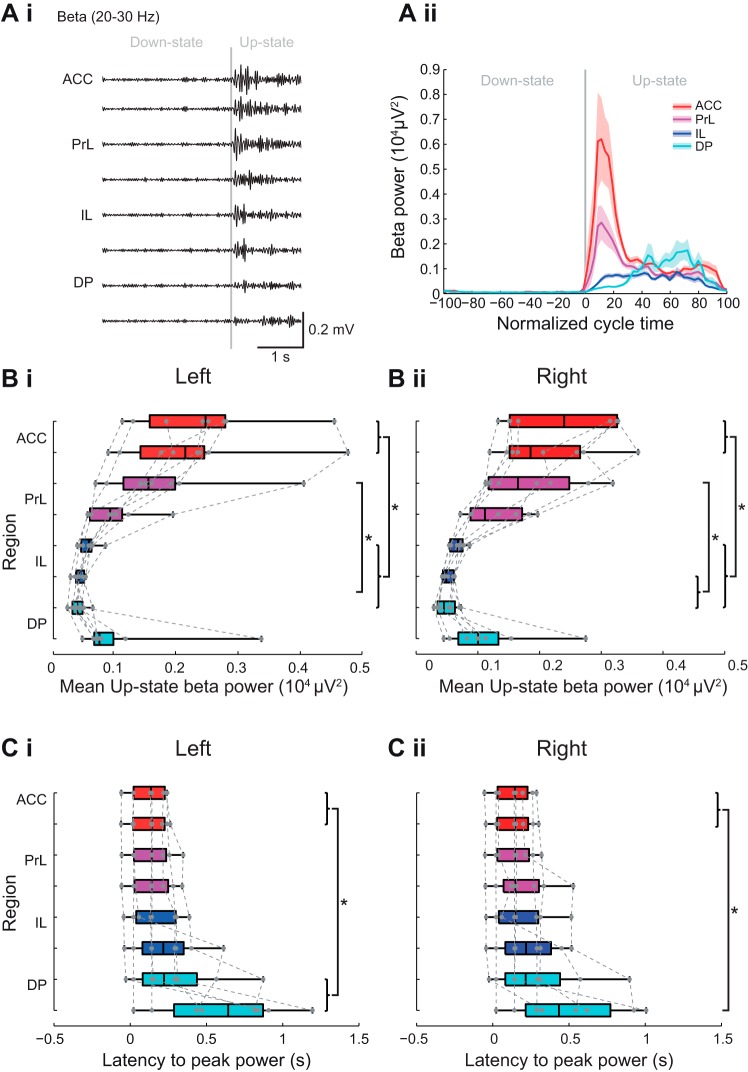
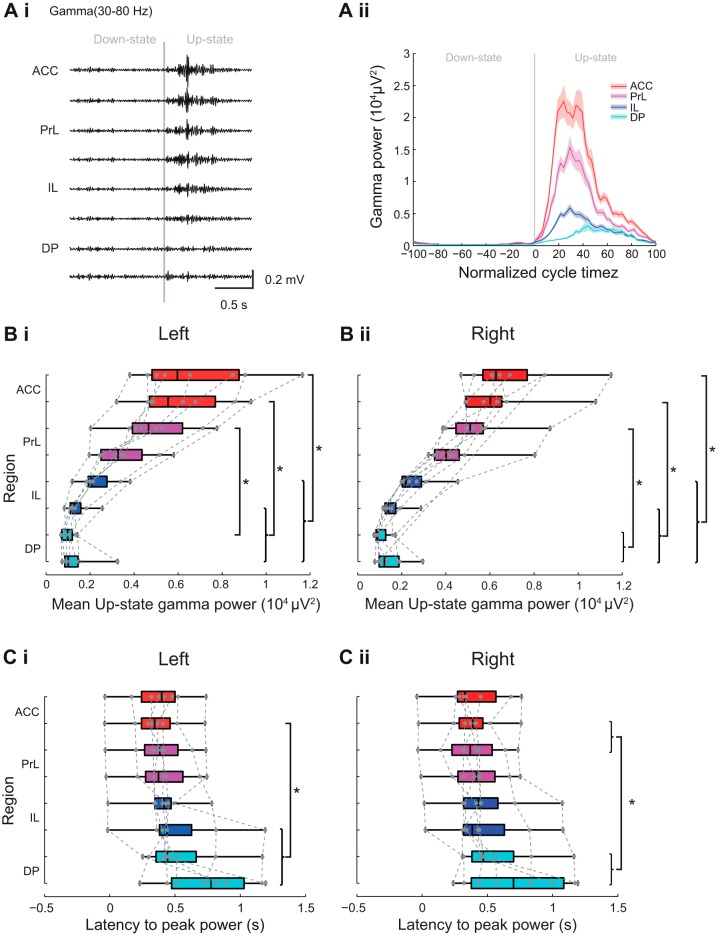
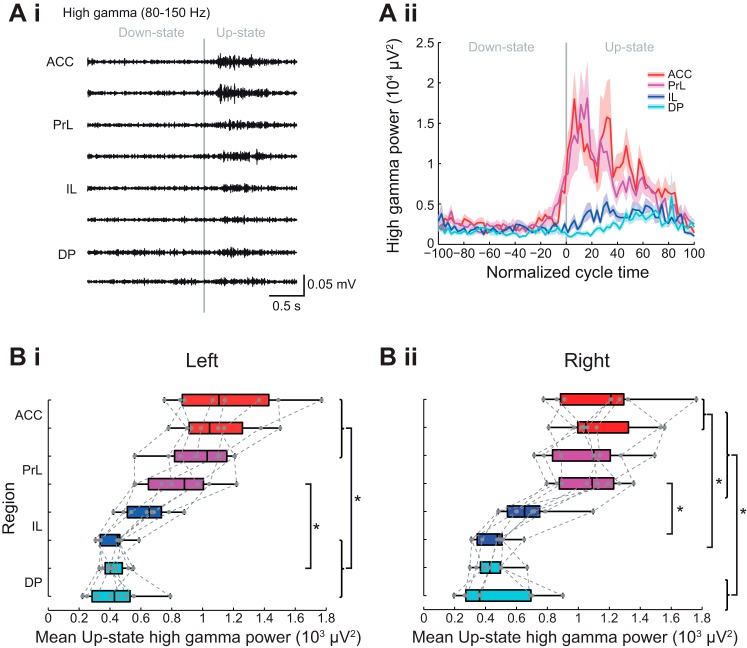
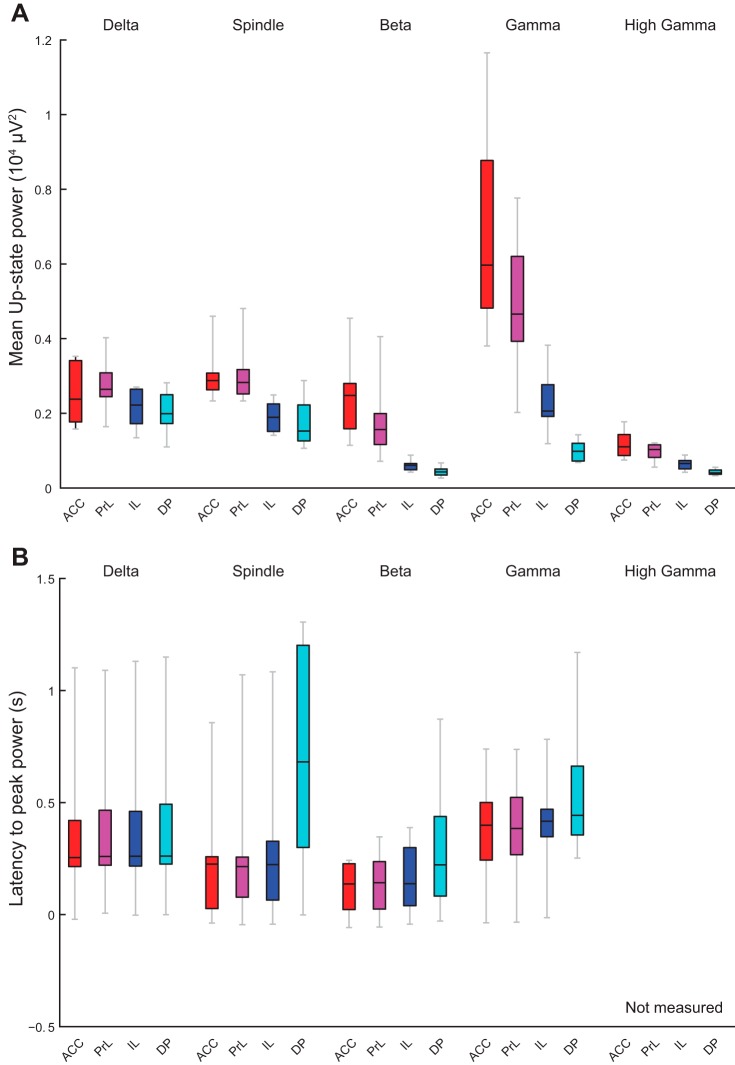
Cortical slow oscillations (0.1-1 Hz), which may play a role in memory consolidation, are a hallmark of non-rapid eye movement (NREM) sleep and also occur under anesthesia. During slow oscillations the neuronal network generates faster oscillations on the active Up-states and these nested oscillations are particularly prominent in the PFC. In rodents the medial prefrontal cortex (mPFC) consists of several subregions: anterior cingulate cortex (ACC), prelimbic (PrL), infralimbic (IL), and dorsal peduncular cortices (DP). Although each region has a distinct anatomy and function, it is not known whether slow or fast network oscillations differ between subregions in vivo. We have simultaneously recorded slow and fast network oscillations in all four subregions of the rodent mPFC under urethane anesthesia. Slow oscillations were synchronous between the mPFC subregions, and across the hemispheres, with no consistent amplitude difference between subregions. Delta (2-4 Hz) activity showed only small differences between subregions. However, oscillations in the spindle (6-15 Hz)-, beta (20-30 Hz), gamma (30-80 Hz)-, and high-gamma (80-150 Hz)-frequency bands were consistently larger in the dorsal regions (ACC and PrL) compared with ventral regions (IL and DP). In dorsal regions the peak power of spindle, beta, and gamma activity occurred early after onset of the Up-state. In the ventral regions, especially the DP, the oscillatory power in the spindle-, beta-, and gamma-frequency ranges peaked later in the Up-state. These results suggest variations in fast network oscillations within the mPFC that may reflect the different functions and connectivity of these subregions.NEW & NOTEWORTHY We demonstrate, in the urethane-anesthetized rat, that within the medial prefrontal cortex (mPFC) there are clear subregional differences in the fast network oscillations associated with the slow oscillation Up-state. These differences, particularly between the dorsal and ventral subregions of the mPFC, may reflect the different functions and connectivity of these subregions.

Keywords: Up-state; gamma oscillations; prefrontal cortex; rat; slow oscillations; spindles.


Figures

Fig. 1.
Fig. 1.
Up-Down state detection and alignment of fast oscillation power. A: illustration of Up- Down-state detection method. The local field potential (LFP) was filtered for the slow oscillation band. A threshold was set on the cosine of the slow oscillation phase to distinguish between Up- and Down-states leading to Up-and Down-state (UDS) assignment in the LFP trace. B: LFP trace (black) and wavelet time-frequency representation of the same signal (only gamma-frequency band is shown). The instantaneous gamma-frequency area power (green trace) was calculated from the wavelet scalogram. Ci: illustration of alignment method used for averaging gamma power over several cycles (despite variability in UDS cycle length). To align the instantaneous gamma power to the normalized UDS cycle, a UDS phase vector was calculated after the UDS detection. This vector was then binned into 40 phase bins per state and was used to calculate gamma power for each normalized cycle. Cii: gamma-frequency area power aligned to the normalized UDS cycle (mean over all cycles from 1 animal).
Fig. 2.
Fig. 2.
Recording sites and slow oscillation properties in medial prefrontal cortex (mPFC). A: coronal section through the rat mPFC indicating the position of the recording sites of the 16-channel dual shank silicon probe. Yellow represents DiI labeling of the electrode track. The background stain is green fluorescent Nissl. The light green dotted lines indicate the borders of the mPFC subregions anterior cingulate cortex (ACC), prelimbic cortex (PrL), infralimbic cortex (IL), and dorsal peduncular cortex (DP). The right hemisphere was lesioned before cutting for the purpose of tracking the hemisphere. B: examples of 60-s recordings of LFP and filtered traces of slow oscillations (SO) recorded simultaneously in each of the 4 mPFC subregions. C: example of 40 s LFP traces (i) from most dorsal (ACC) and most ventral (DP) recording sites, filtered for the slow oscillation; cross correlation of the 2 traces (ii) and box plot (iii) showing peak lags of cross correlation. D: example of 60 s LFP traces (i) from most dorsal (ACC) sites in the left and right hemisphere, filtered for the slow oscillation; cross correlation of the 2 traces (ii) and box plot (iii) showing peak lags of cross correlation. E: cross spectrum phase analysis between the most dorsal (ACC) and most ventral (DP) recording sites (i) and between the most dorsal (ACC) sites (ii) in the right and left hemisphere. Solid black lines and dashed lines represent means ± SE, respectively, with individual data points from each experiment in colored lines.
Fig. 3.
Fig. 3.
Subregional comparison of slow oscillation amplitude. A: box plots showing Up-Down cycle frequency (i), Up-state duration (ii), and Down-state duration (iii). B: schema of the mPFC with indication of recording sites (gray dots) within each subregion color coded (ACC, red; PrL, purple; IL, dark blue; DP, light blue). C: example of the slow oscillation in each region aligned to the normalized Down-state-Up-state cycle. Solid line shows means ± SE (shaded region) over all cycles in the analyzed data segment from 1 animal (regions color coded as indicated in the above schema). Di: box plot showing slow oscillation peak-to-peak amplitude in the left hemisphere in each subregion of the mPFC. Dii: box plot showing slow oscillation peak-to-peak amplitude in the right hemisphere in each subregion of the mPFC.
Fig. 4.
Fig. 4.
High-frequency activity occurred nested on the Up-state. Example spectrogram shows the time-frequency representation of a 40-s LFP segment recorded in ACC (A) and the corresponding (line-noise filtered) LFP trace (B). The low- and high-frequency components of the LFP are shown by filtering for specific frequency bands. Note that the high-frequency oscillations occur during the negative phase of the slow oscillation deflection (i.e., the Up-state). C: magnification of selected sections (indicated by gray dotted box in B of the filtered LFP.
Fig. 5.
Fig. 5.
Subregional profile of Up-state delta-frequency oscillation power and latency. Ai and Aii: 2 different examples of delta power across the normalized slow oscillation cycle. Solid line shows means ± SE (shaded region) over all cycles in the analyzed data segment from 2 different animals (regions color coded as indicated in the schema in Fig. 3B). Boxplot showing subregional profile of mean Up-state spindle-frequency power in the left (Bi) and right (Bii) hemisphere (gray dots show individual data points). Boxplot showing subregional profile of peak Up-state delta-power latency in the left (Ci) and right (Cii) hemisphere (gray dots show individual data points).
Fig. 6.
Fig. 6.
Subregional profile of Up-state spindle-frequency oscillation power and latency. Ai: example of filtered LFP traces showing spindle-frequency oscillations over 1 cycle of Down- to Up-state. Aii: example of spindle power across the normalized slow oscillation cycle. Solid line shows means ± SE (shaded region) over all cycles in the analyzed data segment from 1 animal (regions color coded as indicated in the schema in Fig. 3B). Boxplots showing subregional profile of mean Up-state spindle-frequency power in the left (Bi) and right hemispheres (Bii) (gray dots show individual data points). Boxplots showing subregional profile of peak Up-state spindle-power latency in the left (Ci) and right (Cii) hemisphere (gray dots show individual data points).
Fig. 7.
Fig. 7.
Subregional profile of Up-state beta-frequency oscillation power and latency. Ai: example of filtered LFP traces showing beta-frequency oscillations over 1 cycle of Down to Up-state. Aii: example of beta-frequency power across the normalized slow oscillation cycle. Solid line shows means ± SE (shaded region) over all cycles in the analyzed data segment from 1 animal (regions color coded as indicated in the schema in Fig. 3B). Boxplots showing subregional profile of mean Up-state beta power in the left (Bi) and right (Bii) hemisphere (gray dots show individual data points). Boxplots showing subregional profile of peak Up-state beta-power latency in the left (Ci) and right (Cii) hemisphere (gray dots show individual data points).
Fig. 8.
Fig. 8.
Subregional profile of Up-state gamma-frequency oscillation power and latency. Ai: example of filtered LFP traces showing gamma-frequency oscillations over 1 cycle of Down to Up-state. Aii: example of gamma-frequency power across the normalized slow oscillation cycle. Solid line shows means ± SE (shaded region) over all cycles in the analyzed data segment from 1 animal (regions color coded as indicated in the schema in Fig. 3B). Boxplots showing subregional profile of mean Up-state gamma power in the left (Bi) and right (Bii) hemisphere (gray dots show individual data points). Boxplots showing subregional profile of peak Up-state gamma-power latency in the left (Ci) and right (Cii) hemisphere (gray dots show individual data points).
Fig. 9.
Fig. 9.
Subregional profile of Up-state high-gamma-frequency oscillation power. Ai: Example of filtered LFP traces showing high frequency oscillations over 1 cycle of Down to Up-state. Aii: example of high-gamma-frequency power across the normalized slow oscillation cycle. Solid line shows means ± SE (shaded region) over all cycles in the analyzed data segment from 1 animal (regions color coded as indicated in the schema in Fig. 3B). Boxplots showing subregional profile of mean Up-state high-gamma power in the left (Bi) and right (Bii) hemisphere (gray dots show individual data points). Boxplots showing subregional profile of peak Up-state high-gamma-power latency in the left (Ci) and right (Cii) hemisphere (gray dots show individual data points).
Fig. 10.
Fig. 10.
Subregional comparisons of power and latency in each frequency band and latency to peak power. Boxplots replot the median area power (A) and latency (B) values in each frequency band for 1 recording site as shown in Figs. 5–9 for direct comparison across regions. Regions color coded as indicated in the schema in Fig. 3B.

Similar articles

Cited by

References

    1. Akhter F, Haque T, Sato F, Kato T, Ohara H, Fujio T, Tsutsumi K, Uchino K, Sessle BJ, Yoshida A. Projections from the dorsal peduncular cortex to the trigeminal subnucleus caudalis (medullary dorsal horn) and other lower brainstem areas in rats. Neuroscience 266: 23–37, 2014. doi:10.1016/j.neuroscience.2014.01.046. - DOI - PubMed
    1. Alcaraz F, Marchand AR, Courtand G, Coutureau E, Wolff M. Parallel inputs from the mediodorsal thalamus to the prefrontal cortex in the rat. Eur J Neurosci 44: 1972–1986, 2016. doi:10.1111/ejn.13316. - DOI - PubMed
    1. Amzica F, Nuñez A, Steriade M. Delta frequency (1–4 Hz) oscillations of perigeniculate thalamic neurons and their modulation by light. Neuroscience 51: 285–294, 1992. doi:10.1016/0306-4522(92)90315-S. - DOI - PubMed
    1. Barthó P, Slézia A, Mátyás F, Faradzs-Zade L, Ulbert I, Harris KD, Acsády L. Ongoing network state controls the length of sleep spindles via inhibitory activity. Neuron 82: 1367–1379, 2014. doi:10.1016/j.neuron.2014.04.046. - DOI - PMC - PubMed
    1. Carracedo LM, Kjeldsen H, Cunnington L, Jenkins A, Schofield I, Cunningham MO, Davies CH, Traub RD, Whittington MA. A neocortical delta rhythm facilitates reciprocal interlaminar interactions via nested theta rhythms. J Neurosci 33: 10750–10761, 2013. doi:10.1523/JNEUROSCI.0735-13.2013. - DOI - PMC - PubMed

Publication types

MeSH terms

LinkOut - more resources