

High-velocity stimulation evokes "dense" population response in layer 2/3 vibrissal cortex
- PMID: 28003414
- PMCID: PMC5349327
- DOI: 10.1152/jn.00815.2016
High-velocity stimulation evokes "dense" population response in layer 2/3 vibrissal cortex
Abstract
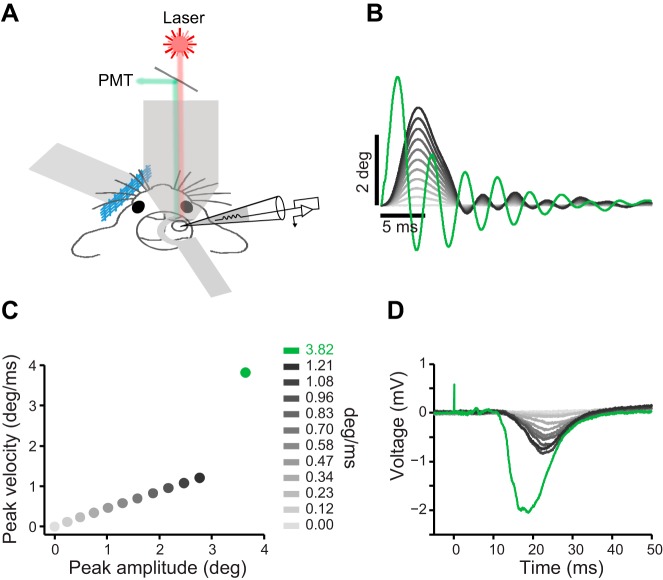
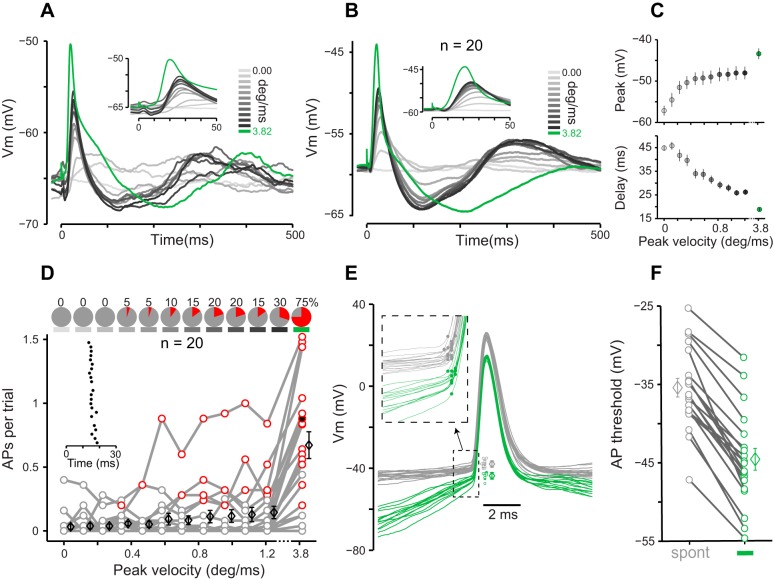
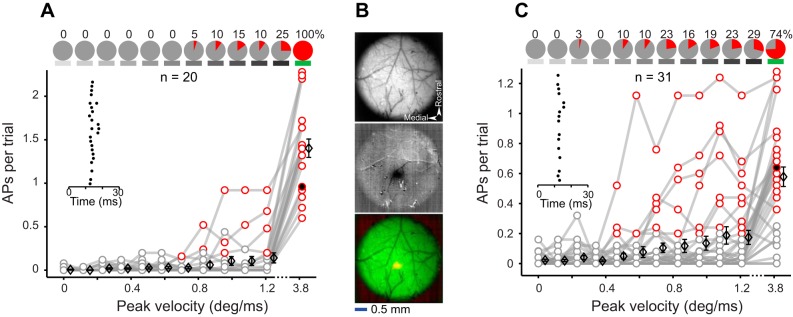
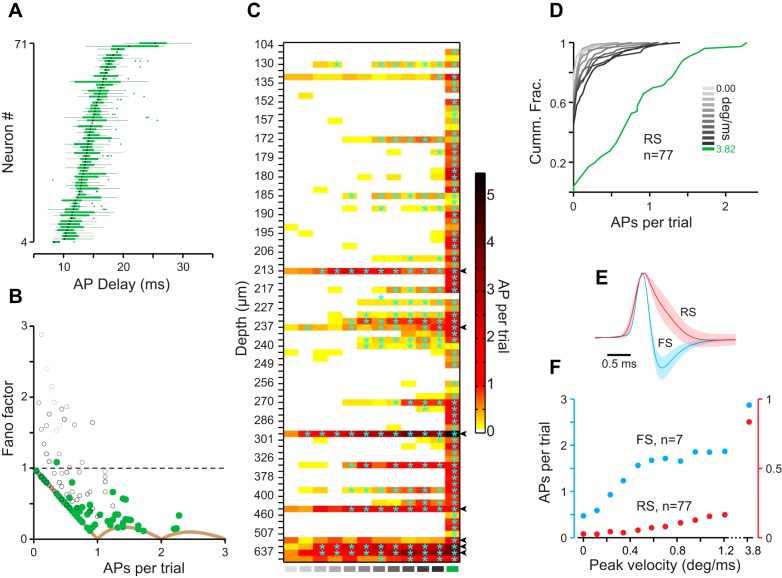
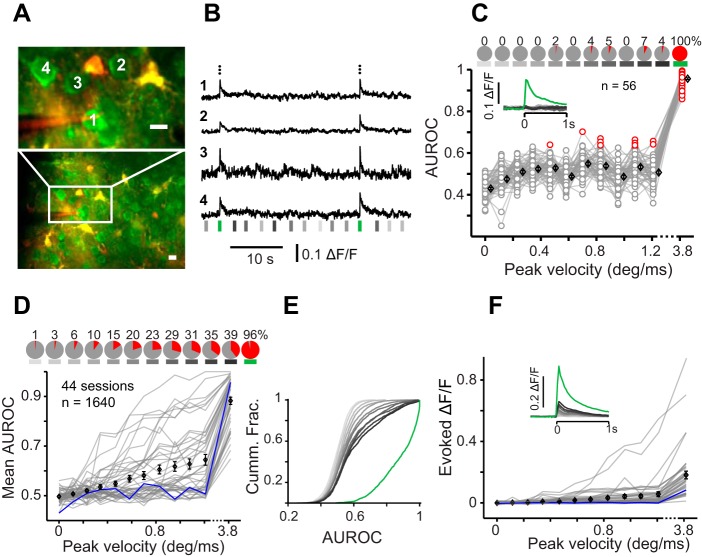
Supragranular layers of sensory cortex are known to exhibit sparse firing. In rodent vibrissal cortex, a small fraction of neurons in layer 2 and 3 (L2/3) respond to whisker stimulation. In this study, we combined whole cell recording and two-photon imaging in anesthetized mice and quantified the synaptic response and spiking profile of L2/3 neurons. Previous literature has shown that neurons across layers of vibrissal cortex are tuned to the velocity of whisker movement. We therefore used a broad range of stimuli that included the standard range of velocities (0-1.2 deg/ms) and extended to a "sharp" high-velocity deflection (3.8 deg/ms). Consistent with previous literature, whole cell recording revealed a sparse response to the standard range of velocities: although all recorded cells showed tuning to velocity in their postsynaptic potentials, only a small fraction produced stimulus-evoked spikes. In contrast, the sharp stimulus evoked reliable spiking in the majority of neurons. The action potential threshold of spikes evoked by the sharp stimulus was significantly lower than that of the spontaneous spikes. Juxtacellular recordings confirmed that application of sharp stimulus to single or multiple whiskers produced temporally precise spiking with minimal trial-to-trial spike count variability (Fano factors equal or close to the theoretical minimum). Two-photon imaging further confirmed that most neurons that were not responsive to the standard deflections responded to the sharp stimulus. Altogether, our results indicate that sparseness in L2/3 cortex depends on the choice of stimulus: strong single- or multiwhisker stimulation can induce the transition from sparse to "dense" population response.NEW & NOTEWORTHY In superficial layers of sensory cortex, only a small fraction of neurons fire most of the spontaneous and sensory evoked spikes. However, the functional relevance of such "sparse" activity remains unknown. We found that a "dense" population response is evoked by high-velocity micromotions applied to whiskers. Our results suggest that flashes of precisely timed population response on an almost silent background can provide a high capacity for coding of ecologically salient stimuli.
Keywords: AP threshold; Fano factor; postsynaptic potentials; somatosensory; sparse coding; two-photon imaging; whisker velocity.
Copyright © 2017 the American Physiological Society.
Figures
Similar articles
-
Diverse tuning underlies sparse activity in layer 2/3 vibrissal cortex of awake mice.J Physiol. 2019 May;597(10):2803-2817. doi: 10.1113/JP277506. Epub 2019 Apr 16. J Physiol. 2019. PMID: 30932197 Free PMC article.
-
Intrinsic firing patterns and whisker-evoked synaptic responses of neurons in the rat barrel cortex.J Neurophysiol. 1999 Mar;81(3):1171-83. doi: 10.1152/jn.1999.81.3.1171. J Neurophysiol. 1999. PMID: 10085344
-
Whisker row deprivation affects the flow of sensory information through rat barrel cortex.J Neurophysiol. 2017 Jan 1;117(1):4-17. doi: 10.1152/jn.00289.2016. Epub 2016 Oct 5. J Neurophysiol. 2017. PMID: 27707809 Free PMC article.
-
From single cells and single columns to cortical networks: dendritic excitability, coincidence detection and synaptic transmission in brain slices and brains.Exp Physiol. 2017 May 1;102(5):489-521. doi: 10.1113/EP085776. Epub 2017 Apr 21. Exp Physiol. 2017. PMID: 28139019 Free PMC article. Review.
-
Experimental evidence for sparse firing in the neocortex.Trends Neurosci. 2012 Jun;35(6):345-55. doi: 10.1016/j.tins.2012.03.008. Epub 2012 May 12. Trends Neurosci. 2012. PMID: 22579264 Review.
Cited by
-
Diverse tuning underlies sparse activity in layer 2/3 vibrissal cortex of awake mice.J Physiol. 2019 May;597(10):2803-2817. doi: 10.1113/JP277506. Epub 2019 Apr 16. J Physiol. 2019. PMID: 30932197 Free PMC article.
-
Superior colliculus modulates cortical coding of somatosensory information.Nat Commun. 2020 Apr 3;11(1):1693. doi: 10.1038/s41467-020-15443-1. Nat Commun. 2020. PMID: 32245963 Free PMC article.
-
Identifying what makes a neuron fire.J Physiol. 2019 May;597(10):2607-2608. doi: 10.1113/JP278049. Epub 2019 Apr 14. J Physiol. 2019. PMID: 30931533 Free PMC article. No abstract available.
-
Ipsilateral Stimulus Encoding in Primary and Secondary Somatosensory Cortex of Awake Mice.J Neurosci. 2022 Mar 30;42(13):2701-2715. doi: 10.1523/JNEUROSCI.1417-21.2022. Epub 2022 Feb 8. J Neurosci. 2022. PMID: 35135855 Free PMC article.
-
Dendritic Spikes Expand the Range of Well Tolerated Population Noise Structures.J Neurosci. 2019 Nov 13;39(46):9173-9184. doi: 10.1523/JNEUROSCI.0638-19.2019. Epub 2019 Sep 26. J Neurosci. 2019. PMID: 31558617 Free PMC article.
References
-
- Ahissar E, Sosnik R, Bagdasarian K, Haidarliu S. Temporal frequency of whisker movement. II. Laminar organization of cortical representations. J Neurophysiol 86: 354–367, 2001. - PubMed
Publication types
MeSH terms
Substances
LinkOut - more resources
Full Text Sources
Other Literature Sources