

Home ranges, habitat and body mass: simple correlates of home range size in ungulates
- PMID: 28003441
- PMCID: PMC5204158
- DOI: 10.1098/rspb.2016.1234
Home ranges, habitat and body mass: simple correlates of home range size in ungulates
Abstract
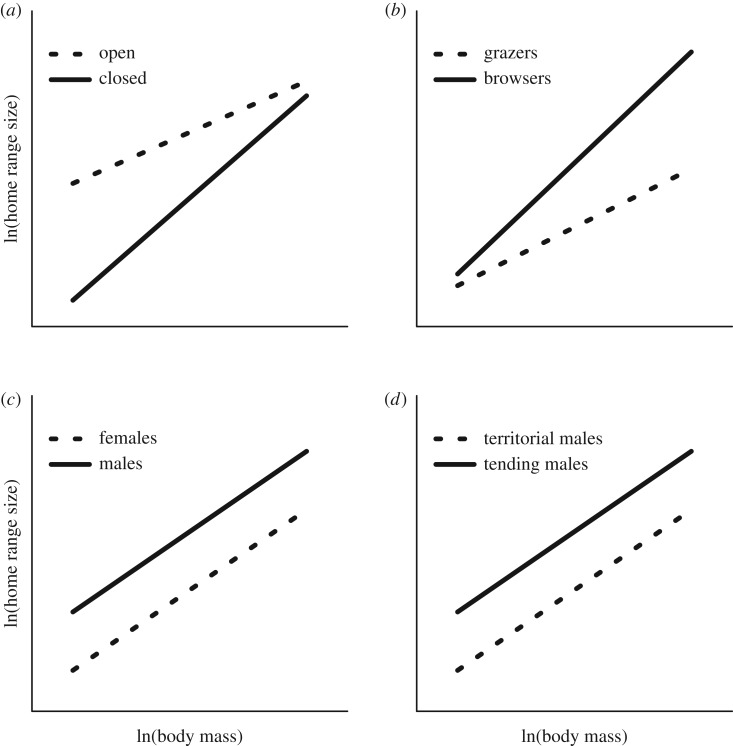
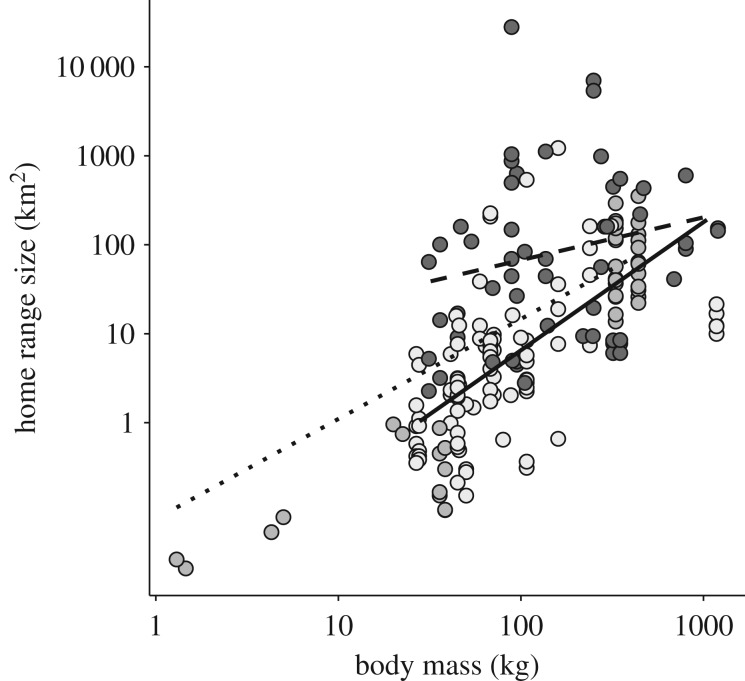
The spatial scale of animal space use, e.g. measured as individual home range size, is a key trait with important implications for ecological and evolutionary processes as well as management and conservation of populations and ecosystems. Explaining variation in home range size has therefore received great attention in ecological research. However, few studies have examined multiple hypotheses simultaneously, which is important provided the complex interactions between life history, social system and behaviour. Here, we review previous studies on home range size in ungulates, supplementing with a meta-analysis, to assess how differences in habitat use and species characteristics affect the relationship between body mass and home range size. Habitat type was the main factor explaining interspecific differences in home range size after accounting for species body mass and group size. Species using open habitats had larger home ranges for a given body mass than species using closed habitats, whereas species in open habitats showed a much weaker allometric relationship compared with species living in closed habitats. We found no support for relationships between home range size and species diet or mating system, or any sexual differences. These patterns suggest that the spatial scale of animal movement mainly is a combined effect of body mass, group size and the landscape structure. Accordingly, landscape management must acknowledge the influence of spatial distribution of habitat types on animal behaviour to ensure natural processes affecting demography and viability of ungulate populations.
Keywords: allometry; diet; group size; landscape effects; mating system; space use.
© 2016 The Author(s).
Figures
Similar articles
-
Movement is the glue connecting home ranges and habitat selection.J Anim Ecol. 2016 Jan;85(1):21-31. doi: 10.1111/1365-2656.12394. Epub 2015 Jul 30. J Anim Ecol. 2016. PMID: 25980987
-
Sexual segregation in ungulates: a comparative test of three hypotheses.Biol Rev Camb Philos Soc. 2002 Feb;77(1):77-96. doi: 10.1017/s1464793101005814. Biol Rev Camb Philos Soc. 2002. PMID: 11911375
-
Reconciling competing ecological explanations for sexual segregation in ungulates.Ecology. 2008 Mar;89(3):693-704. doi: 10.1890/07-0645.1. Ecology. 2008. PMID: 18459333
-
Landscape complexity persists as a critical source of bias in terrestrial animal home range estimation.Ecology. 2021 Aug;102(8):e03427. doi: 10.1002/ecy.3427. Epub 2021 Jul 12. Ecology. 2021. PMID: 34105787 Review.
-
Distribution, habitat and adaptability of the genus Tapirus.Integr Zool. 2012 Dec;7(4):346-355. doi: 10.1111/j.1749-4877.2012.00317.x. Integr Zool. 2012. PMID: 23253366 Review.
Cited by
-
Forage stoichiometry predicts the home range size of a small terrestrial herbivore.Oecologia. 2021 Oct;197(2):327-338. doi: 10.1007/s00442-021-04965-0. Epub 2021 Jun 15. Oecologia. 2021. PMID: 34131817
-
Earliest evidence of herd-living and age segregation amongst dinosaurs.Sci Rep. 2021 Oct 21;11(1):20023. doi: 10.1038/s41598-021-99176-1. Sci Rep. 2021. PMID: 34675327 Free PMC article.
-
Resource partitioning facilitates coexistence in sympatric cetaceans in the California Current.Ecol Evol. 2017 Sep 27;7(21):9085-9097. doi: 10.1002/ece3.3409. eCollection 2017 Nov. Ecol Evol. 2017. PMID: 29152200 Free PMC article.
-
Megafauna mobility: Assessing the foraging range of an extinct macropodid from central eastern Queensland, Australia.PLoS One. 2025 Apr 23;20(4):e0319712. doi: 10.1371/journal.pone.0319712. eCollection 2025. PLoS One. 2025. PMID: 40267930 Free PMC article.
-
Habitat quality influences trade-offs in animal movement along the exploration-exploitation continuum.Sci Rep. 2023 Mar 24;13(1):4814. doi: 10.1038/s41598-023-31457-3. Sci Rep. 2023. PMID: 36964167 Free PMC article.
References
-
- Herfindal I, Tremblay J-P, Hansen BB, Solberg EJ, Heim M, Sæther B-E. 2009. Scale dependency and functional response in moose habitat selection. Ecography 32, 849–859. (10.1111/j.1600-0587.2009.05783.x) - DOI
-
- Beier P, McCullough DR. 1990. Factors influencing white-tailed deer activity patterns and habitat use. Wildl. Monogr. 109, 1–51.
Publication types
MeSH terms
Associated data
LinkOut - more resources
Full Text Sources
Other Literature Sources
