. 2016 Dec 28;283(1845):20161319.
doi: 10.1098/rspb.2016.1319.

The heritability of chimpanzee and human brain asymmetry

Affiliations

The heritability of chimpanzee and human brain asymmetry

Aida Gómez-Robles et al. Proc Biol Sci. .

Abstract

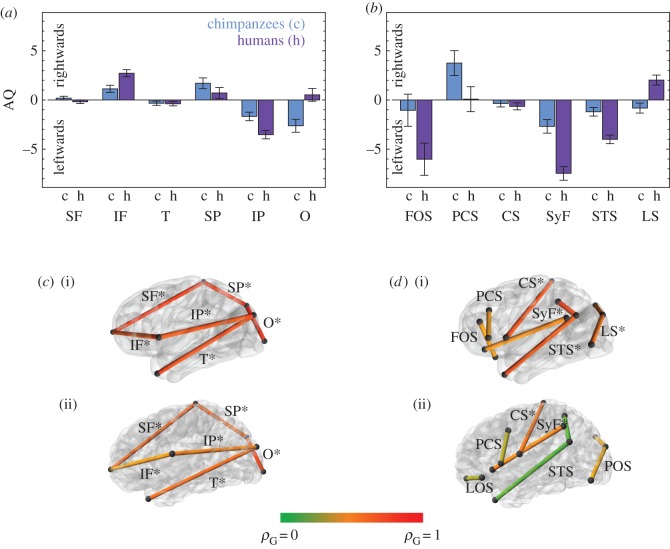
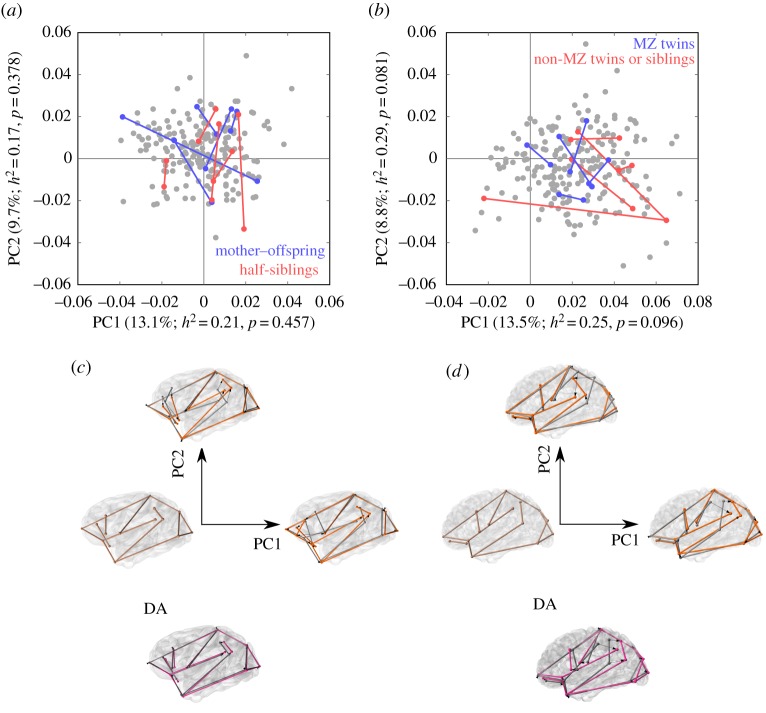
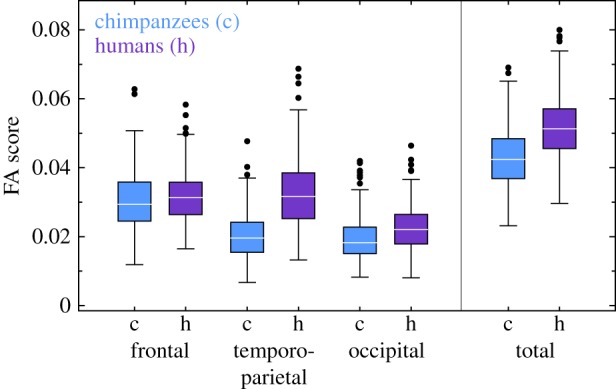
Human brains are markedly asymmetric in structure and lateralized in function, which suggests a relationship between these two properties. The brains of other closely related primates, such as chimpanzees, show similar patterns of asymmetry, but to a lesser degree, indicating an increase in anatomical and functional asymmetry during hominin evolution. We analysed the heritability of cerebral asymmetry in chimpanzees and humans using classic morphometrics, geometric morphometrics, and quantitative genetic techniques. In our analyses, we separated directional asymmetry and fluctuating asymmetry (FA), which is indicative of environmental influences during development. We show that directional patterns of asymmetry, those that are consistently present in most individuals in a population, do not have significant heritability when measured through simple linear metrics, but they have marginally significant heritability in humans when assessed through three-dimensional configurations of landmarks that reflect variation in the size, position, and orientation of different cortical regions with respect to each other. Furthermore, genetic correlations between left and right hemispheres are substantially lower in humans than in chimpanzees, which points to a relatively stronger environmental influence on left-right differences in humans. We also show that the level of FA has significant heritability in both species in some regions of the cerebral cortex. This suggests that brain responsiveness to environmental influences, which may reflect neural plasticity, has genetic bases in both species. These results have implications for the evolvability of brain asymmetry and plasticity among humans and our close relatives.

Keywords: brain evolution; environment; fluctuating asymmetry; geometric morphometrics; primates; quantitative genetics.


Figures

Figure 1.
Figure 1.
Analysis of asymmetry based on interlandmark linear distances. (a) Asymmetry quotients (AQs) for lobe proportions (mean AQs and standard errors). (b) AQs for sulcal lengths. (c) Genetic correlations between left and right lobe proportions in chimpanzees (i) and humans (ii). (d) Genetic correlations between left and right sulcal lengths in chimpanzees (i) and humans (ii). Asterisks mark significant genetic correlations in (c) and (d). No AQ shows significant heritability in (a) and (b). Numerical values for heritabilities and colour-coded genetic correlations are provided in the electronic supplementary material, tables S5, S8–S10. SF, superior frontal length; IF, inferior frontal length; T, temporal length; SP, superior parietal length; IP, inferior parietal length; O, occipital length; FOS, fronto-orbital sulcus (latero-orbital sulcus—LOS—in humans); PCS, precentral sulcus; CS, central sulcus; SyF, Sylvian fissure; STS, superior temporal sulcus; LS, lunate sulcus (parieto-occipital sulcus—POS—in humans); ρG, genetic correlation.
Figure 2.
Figure 2.
Geometric morphometric analysis of asymmetry. (a) Principal component analysis (PCA) of asymmetric shape variation in chimpanzees showing five randomly selected mother–offspring and half-sibling pairs (50 versus 25% genetic similarity). (b) PCA of asymmetric shape variation showing five randomly selected pairs of monozygotic twins and of non-monozygotic twins or non-twin siblings (100 versus 50% genetic similarity). PCA plots in (a,b) are centred on a hypothetical perfectly symmetric individual. The percentage of variance explained by each PC and their heritabilities and p-values are provided (see the electronic supplementary material, tables S11 and S12 for extended information). (c,d) Major patterns of shape variation in (c) chimpanzees and (d) humans, showing the symmetric consensus for each species and major patterns of variation corresponding to the positive extremes of PC1 and PC2 (grey for the right hemisphere and orange for the left). The DA pattern for each species is shown on the bottom panels. For DA, grey corresponds to the right hemisphere and magenta to the left hemisphere. PC1, PC2, and DA shape variation has been exaggerated beyond the range observed in actual data to facilitate visualization.
Figure 3.
Figure 3.
FA scores for chimpanzees and humans. FA scores have been calculated as the residual variation in each individual after removing the DA pattern typical of each species. Heritabilities of FA scores are provided in table 1. (Online version in colour.)

References

    1. Geschwind N, Levitsky W. 1968. Human brain: left-right asymmetries in temporal speech region. Science 161, 186–187. ( 10.1126/science.161.3837.186) - DOI - PubMed
    1. Amunts K, Schleicher A, Bürgel U, Mohlberg H, Uylings HB, Zilles K. 1999. Broca's region revisited: cytoarchitecture and intersubject variability. J. Comp. Neurol. 412, 319–341. ( 10.1002/(SICI)1096-9861(19990920)412:2%3C319::AID-CNE10%3E3.0.CO;2-7) - DOI - PubMed
    1. Sowell ER, Thompson PM, Rex D, Kornsand D, Tessner KD, Jernigan TL, Toga AW. 2002. Mapping sulcal pattern asymmetry and local cortical surface gray matter distribution in vivo: maturation in perisylvian cortices. Cereb. Cortex 12, 17–26. ( 10.1093/cercor/12.1.17) - DOI - PubMed
    1. Toga AW, Thompson PM. 2003. Mapping brain asymmetry. Nat. Rev. Neurosci. 4, 37–48. ( 10.1038/nrn1009) - DOI - PubMed
    1. Vigneau M, et al. 2011. What is right-hemisphere contribution to phonological, lexico-semantic, and sentence processing? Insights from a meta-analysis. Neuroimage 54, 577–593. ( 10.1016/j.neuroimage.2010.07.036) - DOI - PubMed