. 2017 Jan 10;114(2):E228-E236.
doi: 10.1073/pnas.1619238114. Epub 2016 Dec 21.

Congenital myopathy results from misregulation of a muscle Ca2+ channel by mutant Stac3

Affiliations

Congenital myopathy results from misregulation of a muscle Ca2+ channel by mutant Stac3

Jeremy W Linsley et al. Proc Natl Acad Sci U S A. .

Abstract

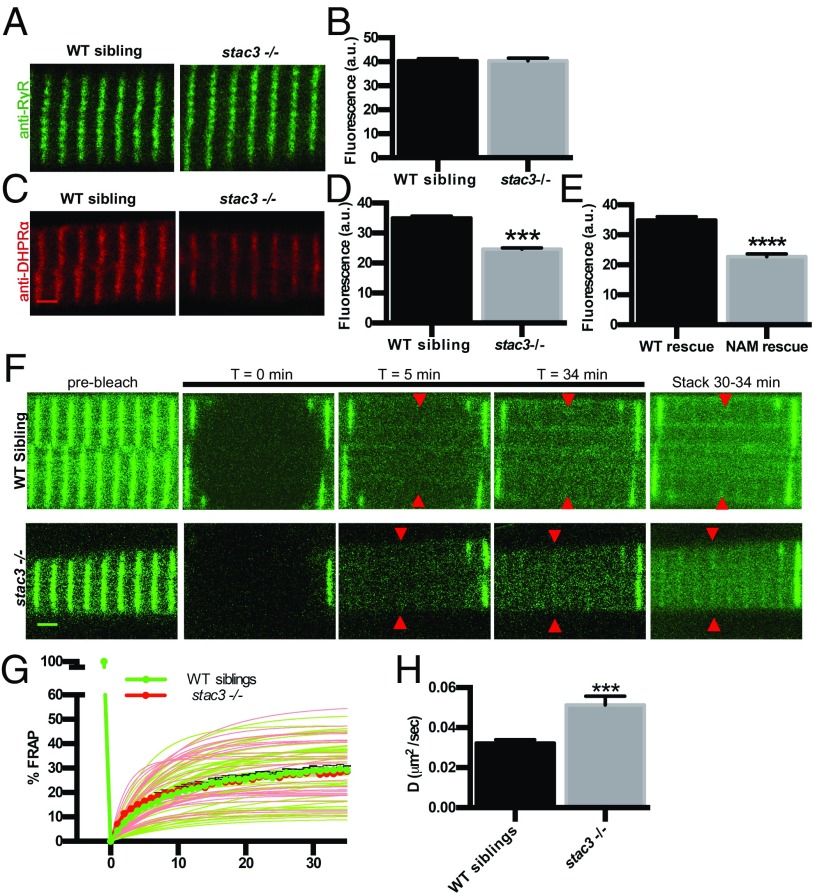
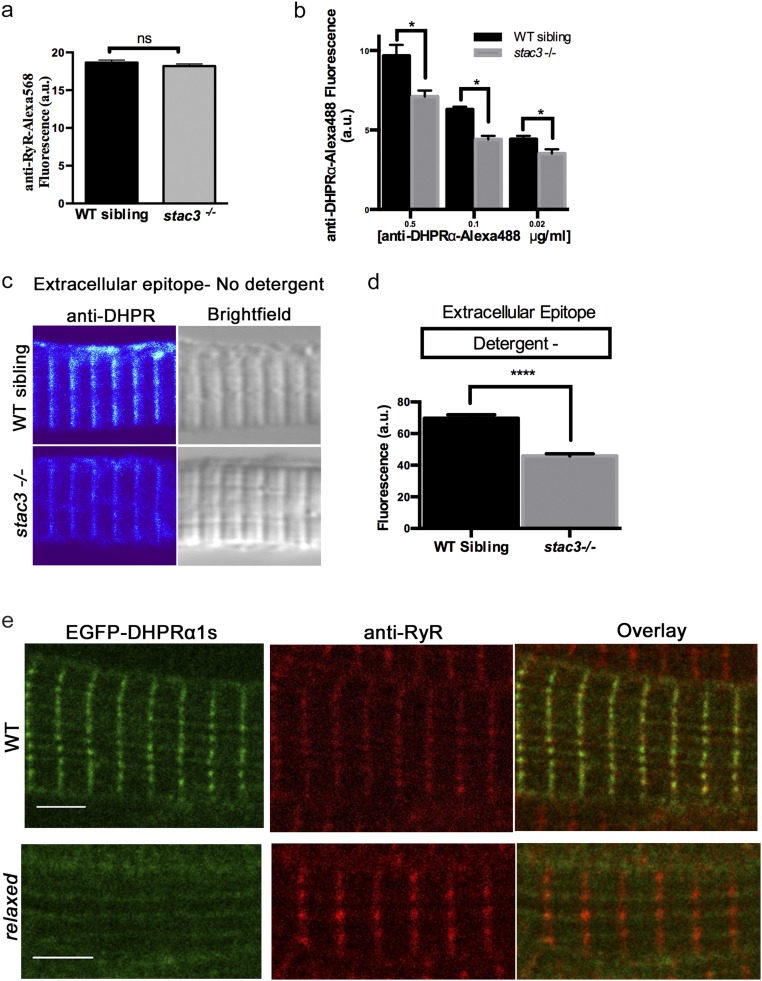
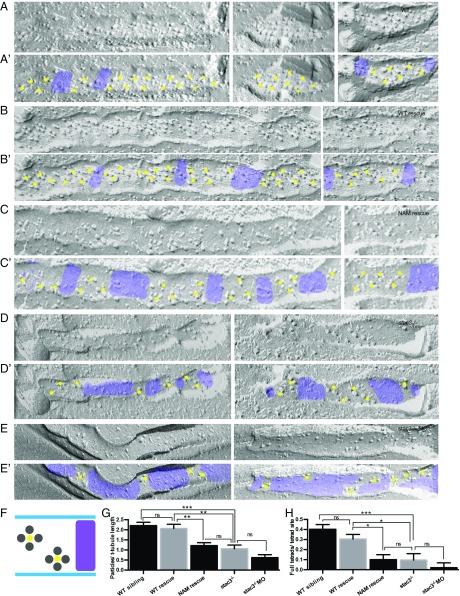
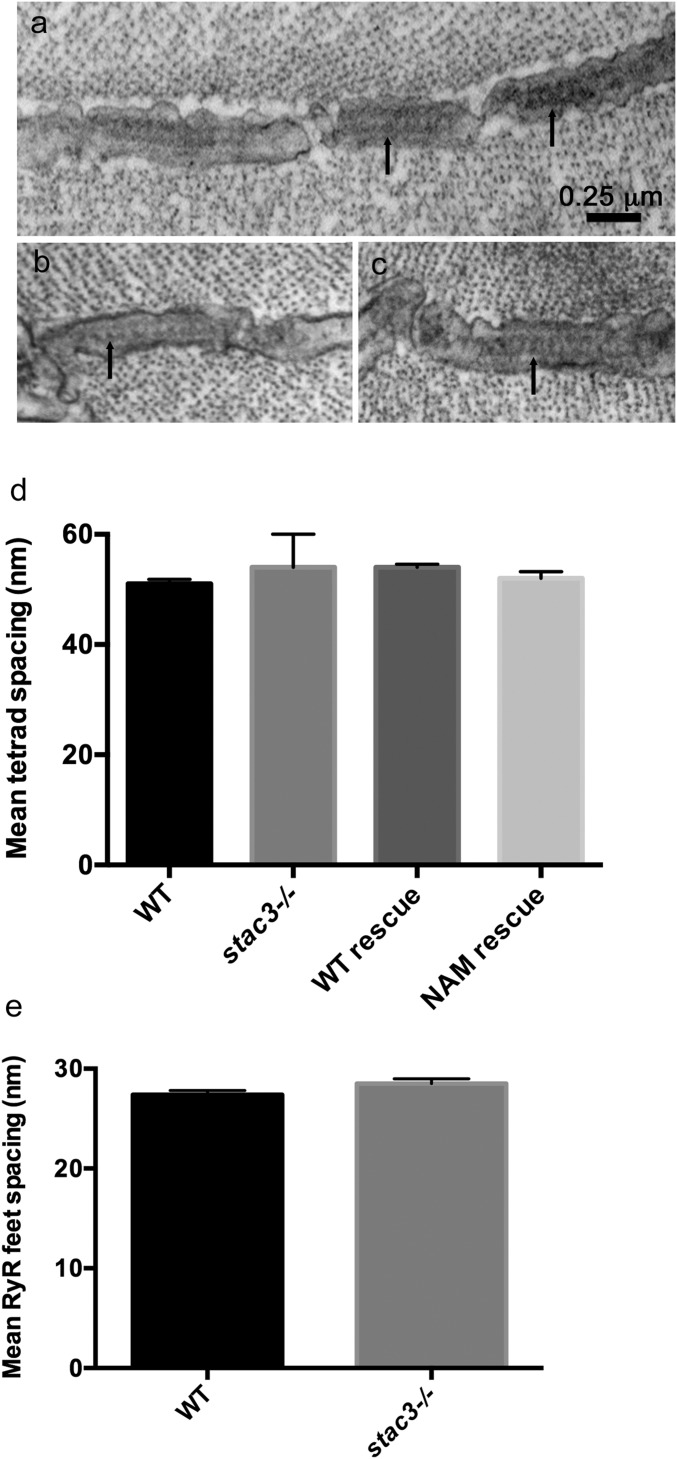
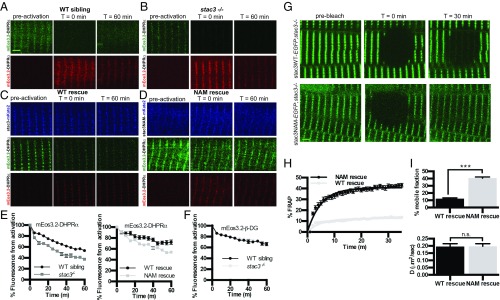
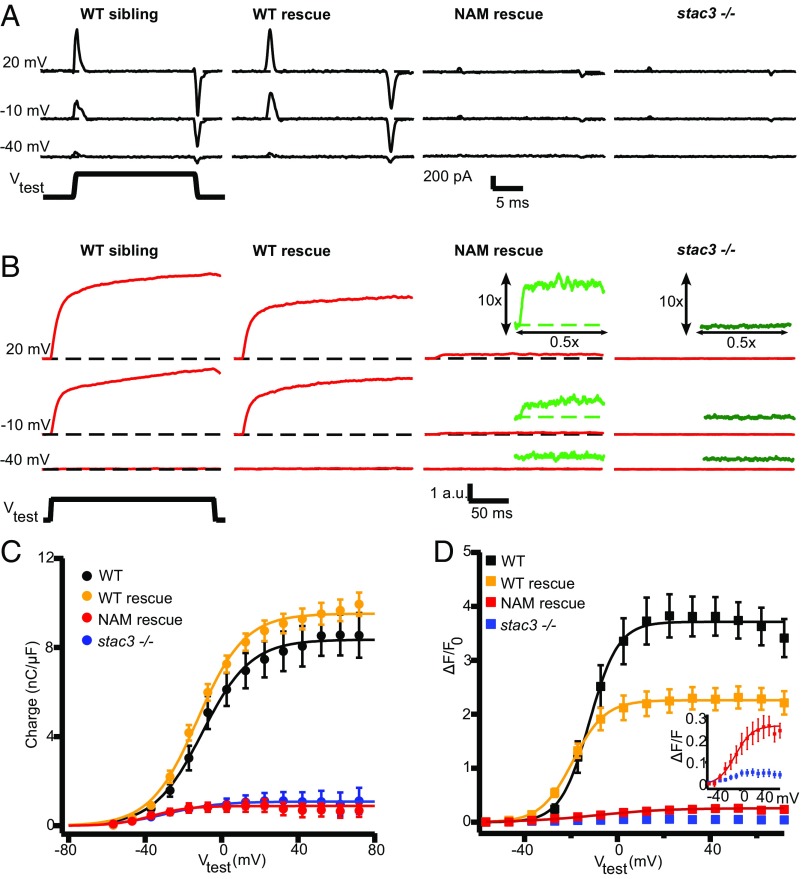
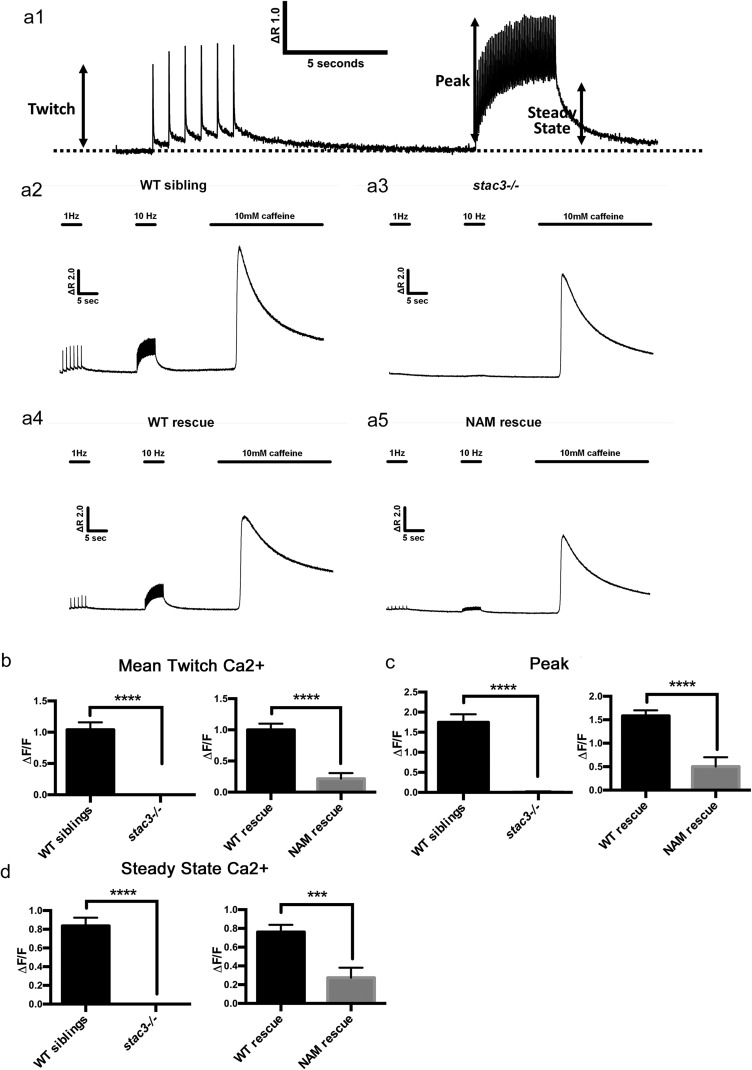
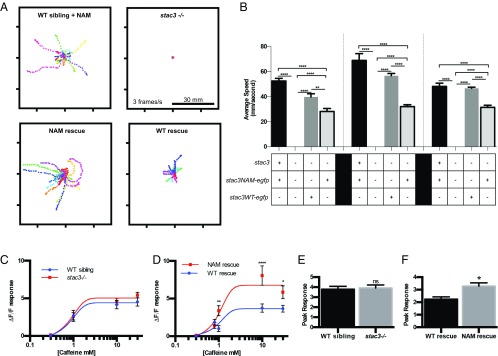
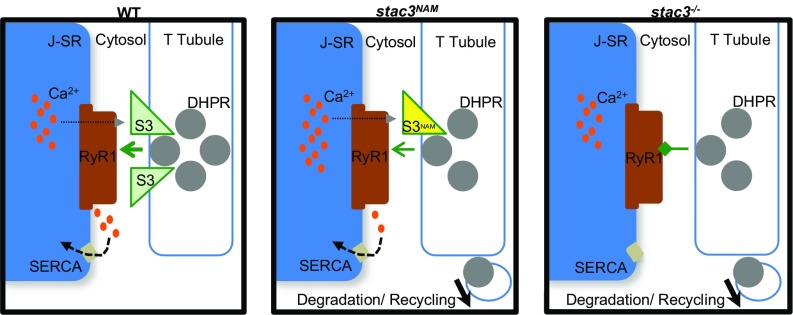
Skeletal muscle contractions are initiated by an increase in Ca2+ released during excitation-contraction (EC) coupling, and defects in EC coupling are associated with human myopathies. EC coupling requires communication between voltage-sensing dihydropyridine receptors (DHPRs) in transverse tubule membrane and Ca2+ release channel ryanodine receptor 1 (RyR1) in the sarcoplasmic reticulum (SR). Stac3 protein (SH3 and cysteine-rich domain 3) is an essential component of the EC coupling apparatus and a mutation in human STAC3 causes the debilitating Native American myopathy (NAM), but the nature of how Stac3 acts on the DHPR and/or RyR1 is unknown. Using electron microscopy, electrophysiology, and dynamic imaging of zebrafish muscle fibers, we find significantly reduced DHPR levels, functionality, and stability in stac3 mutants. Furthermore, stac3NAM myofibers exhibited increased caffeine-induced Ca2+ release across a wide range of concentrations in the absence of altered caffeine sensitivity as well as increased Ca2+ in internal stores, which is consistent with increased SR luminal Ca2+ These findings define critical roles for Stac3 in EC coupling and human disease.

Keywords: Native American myopathy; dihydropyridine receptor; excitation–contraction coupling; skeletal muscle; zebrafish.


Conflict of interest statement

The authors declare no conflict of interest.

Figures

Fig. 1.
Fig. 1.
DHPRα1 but not RyR1 is reduced in T-tubule striations of stac3 mutants. (A) Immunofluorescence labeling of WT sibling and stac3−/− disassociated myotubes with anti-pan RyR (34c). (B) Mean immunofluorescence intensity of anti-RyR in stac3−/− compared with WT siblings showing no difference in triadic RyR (t test, P = 0.89, n = 85 WT sibling, n = 50 stac3−/−). a.u., arbitrary units. (C) Immunofluorescence labeling of WT sibling and stac3−/− disassociated myotubes with mAb1 1A against a cytoplasmic region of DHPRα1S (15). (D) Mean mAb1 1A labeling in WT siblings and stac3−/− showing a decrease in triadic DHPRα1S (t test, ***P < 0.0001, n = 216 WT sibling, n = 264 stac3−/−). (E) Quantification of the mean of immunofluorescence labeling of anti-DHPRα1S in stac3−/− expressing stac3NAM (NAM rescue) at triads compared with stac3−/− expressing stac3WT (WT rescue) (n = 75 stac3−/−; stac3WT, n = 53 stac3−/−; stac3NAM, t test, ****P < 0.0001). (F) Time course for FRAP of EGFP-DHPRα1S expressed in WT siblings and stac3−/− myofibers. Shown are EGFP-DHPRα1S before (prebleach), after photobleaching (T = 0, 5, 34 min), and a maximum projection (stack) of T = 30 to 34 min (Right). (G) Mean quantification of the time course of FRAP in WT siblings (thick green line and circles) and stac3−/− (thick red line and circles). Thin lines represent nonlinear regressions from individual traces of FRAPs from WT siblings (green) and stac3−/− (red). The vertical thick green line depicts bleaching. (H) Histogram showing that the diffusion rate (D) of EGFP-DHPRα1S is higher in stac3−/− (t test, ***P < 0.0001, n = 33 stac3−/−, n = 45 WT siblings). SEMs are indicated. (Scale bars, 2 μm.)
Fig. S1.
Fig. S1.
Loss of Stac3 does not prevent trafficking of DHPRα to triads. (A) Quantification of the mean of immunofluorescence labeling (±SEM) of Alexa 568 directly coupled to anti-RyR in stac3−/− at triads compared with WT siblings (n = 60, t test, P = 0.29). (B) Quantification of the mean of immunofluorescence labeling of Alexa 488 directly coupled to anti-DHPRα1S at different concentrations in stac3−/− at triads compared with WT siblings (n = 40 WT sibling, n = 40 stac3−/−, t test, *P < 0.0001). (C) Immunofluorescence (Left) and bright-field images (Right) of WT sibling and stac3−/− disassociated myotubes labeled without detergent with anti-DHPRα1S that recognizes an extracellular epitope. (D) Histogram showing that there is a decrease in T-tubule triadic DHPRα1S in stac3−/− dissociated myotubes (n = 160 WT sibling, n = 125 stac3−/−, t test, ****P < 0.0001). (E) Anti-Ryr immunolabeling of a fixed muscle fiber expressing EGFP-DHPRα1S showing that EGFP-DHPRα1S does not localize to triads in a relaxed mutant fiber, whereas it does in a WT fiber. SEMs are indicated. n.s., not significant. (Scale bars, 4 μm.)
Fig. S2.
Fig. S2.
Transcription of EC coupling genes is normal in stac3−/−. Histograms showing quantitative PCR for target mRNAs relative to the housekeeping mRNA sdha. (A) ryr1a message (stac3−/− n = 6, WT sibling n = 6, t test, P = 0.215). (B) ryr1b message (stac3−/− n = 6, WT sibling n = 6, t test, P = 0.148). (C) cacna1b1 message (stac3−/− n = 6, WT sibling n = 6, t test, P = 0.270). (D) cacna1sa message (stac3−/− n = 6, WT sibling, n = 6, t test, P = 0.744). (E) cacna1sb message (stac3−/− n = 12, WT sibling n = 12, t test, P = 0.149). SEMs are indicated.
Fig. S3.
Fig. S3.
DHPR trafficking is temperature-dependent. (A) Time course for FRAP of EGFP-DHPRα in WT sibling embryos incubated at 30 °C (n = 6), 22 to 24 °C (n = 45), and 10 °C (n = 6); 22 to 24 °C data are the same data as in Fig. 1. (B) Histogram showing that the diffusion rate of EGFP-DHPRα increases as a function of temperature (30 °C versus 10 °C, ANOVA, **P < 0.01) and decreases at low temperature (10 °C versus 22 to 24 °C, ANOVA, *P < 0.05). SEMs are indicated. ns, not significant.
Fig. 2.
Fig. 2.
DHPR tetrads are reduced and incomplete in stac3 mutants. (AE) Freeze-fracture electron micrographs of 4-d postfertilization larvae showing DHPR particles in triadic clusters of WT (A), stac3−/− expressing stac3WT-EGFP (WT rescue) (B), stac3−/− expressing stac3NAM-mKate2 (NAM rescue) (C), stac3−/− (D), and stac3−/− injected with an antisense morpholino oligonucleotide against stac3 (stac3−/− + MO) (E). (A′E′) Same as AE, with yellow dots and purple shading added for clarity to denote, respectively, segments of T tubules with tetrad sites of DHPRs and segments of T tubules with no tetrad sites in muscle fibers of WT (A′), WT rescue (B′), NAM rescue (C′), stac3−/− (D′), and stac3−/− + MO (E′). (F) Illustration showing stereotypical DHPR particles in tetrad sites (labeled with yellow dots) along a T tubule and gaps with no tetrad sites (purple) as seen above. (G) Histogram showing that the particles per T-tubule length are decreased in NAM rescue, stac3−/−, and stac3−/− + MO muscles compared with WT and WT rescue. (ANOVA Tukey's; ***P < 0.001, **P < 0.01.) (H) Histogram showing that full tetrads per tetrad site are decreased in NAM rescue, stac3−/−, and stac3−/− + MO muscles compared with WT and WT rescue. ns, not significant. SEMs are indicated. (ANOVA Tukey's; ***P < 0.001, *P < 0.05.)
Fig. S4.
Fig. S4.
DHPR particles and tetrads are reduced in stac3 mutants but Ryr feet are unaffected. (A) Transverse EM section showing the RyR feet (arrows) at triads in a WT muscle fiber (96 hpf). (B and C) Examples of transverse EM sections showing that the distribution of RyR feet (arrows) in stac3−/− muscles is comparable to that in WT muscles. (D) Histogram showing that the spacing of tetrads was comparable in fibers from WT (n = 39) and stac3−/− (n = 25). stac3−/− expressing Stac3WT (WT rescue, n = 45) and stac3−/− expressing Stac3NAM (NAM rescue, n = 44) larvae (ANOVA, P = 0.07). (E) Histogram showing that the spacing of RyR feet was comparable in WT (n = 27) and stac3−/− (n = 39) fibers (t test, P = 0.11). SEMs are indicated.
Fig. 3.
Fig. 3.
DHPRα is less stable in stac3 mutants. (A and B) Time course for optical pulse-labeling assay of mEos3.2-DHPRα1S expressed in the myofibers of WT sibling (A) and stac3−/− (B). Green channel (Top) and red channel (Bottom) before photoconversion (Left), immediately following photoconversion (Middle), and 60 min after photoconversion (Right). (C and D) Time course for optical pulse-labeling assay of mEos3.2-DHPRα1S in stac3−/− muscles expressing stac3WT-mKate2 (C) or stac3NAM-mKate2 (D). Blue channel representing the far-red mKate2 fluorescence (Top), green channel (Middle), and red channel (Bottom) for mEos3.2-DHPRα1S fluorescence as in A and B. (E) Time course of decay of photoconverted mEos3.2-DHPRα1S shows that fluorescence decays faster in stac3−/− (n = 24) compared with WT siblings (n = 24) (t-permutation test, P < 0.001) (Left) and that photoconverted mEos3.2-DHPRα1S decays faster in myofibers of stac3−/− expressing stac3NAM (n = 20) compared with expressing stac3WT (n = 20) (t-permutation test, P < 0.001) (Right). (F) Time course of decay of photoconverted mEos3.2-β-dystroglycan in WT siblings (n = 9) and stac3−/− (n = 9) shows that fluorescence decays at the same rate in WT and stac3−/− (t-permutation test, P = 0.86). (G) FRAP analysis of stac3−/− myofibers expressing stac3WT-EGFP (Top) or stac3NAM-EGFP (Bottom) before photobleaching (Left), immediately after photobleaching (Middle), and 30 min after photobleaching (Right). (H) Mean time course of FRAP of stac3−/− myofibers expressing stac3WT (n = 18) and stac3NAM (n = 36). (I, Top) Histogram showing the percentage of the mobile fraction is larger in stac3−/− myofibers expressing stac3NAM compared with stac3WT (t test, P < 0.0001). (I, Bottom) Histogram showing that the rate of recovery following photobleaching is unchanged between stac3−/− myofibers expressing stac3WT and stac3NAM (t test, ***P = 0.9). SEMs are indicated. n.s., not significant. (Scale bars, 2 μm.)
Fig. 4.
Fig. 4.
DHPR charge movement and SR Ca2+ release are dramatically reduced in stac3 mutants. (A) Representative DHPR gating currents elicited by test pulses (Vtest) to +20 mV, −10 mV, and −40 mV from a holding potential of −80 mV in myofibers from WT siblings, stac3−/− expressing stac3WT-EGFP (WT rescue), stac3−/− expressing stac3NAM-EGFP (NAM rescue), and stac3−/− zebrafish. Gating currents in WT rescue fibers were comparable to WT fibers but dramatically decreased in stac3−/− and NAM rescue fibers. (B) Representative Fluo-4 fluorescence traces elicited by 200-ms test pulses to −40, −10, and +20 mV in fibers from WT siblings, WT rescue, NAM rescue, and stac3−/−. Fluo-4 transients in WT rescue myofibers were comparable to WT fibers but dramatically decreased in stac3−/− and NAM rescue fibers. (Insets) Magnifications (10×) of the Fluo-4 transients (green) in NAM rescue and stac3−/− fibers. (C) The voltage dependence of the integrated ON component of intramembrane DHPR charge movement was comparable between myofibers from WT siblings (n = 10) and WT rescue (n = 14) (ANOVA, ns) but dramatically decreased in fibers from stac3−/− (n = 19) and NAM rescue (n = 12) fibers. Data from stac3−/− fibers were too small to be accurately fit (SI Materials and Methods). (D) Voltage dependence of Fluo-4 transients in fibers from WT siblings (n = 6), WT rescue (n = 13), NAM rescue (n = 8), and stac3−/− (n = 6) (ANOVA Tukey’s, P < 0.01). (Inset) Fluo-4 transients were small but clearly detectable in NAM rescue fibers but not in stac3−/− fibers. SEMs are indicated.
Fig. S5.
Fig. S5.
Ca2+ transients are reduced in dissociated muscle fibers from stac3 mutants in response to electrically evoked twitch and 10-Hz trains of stimulation. (A1) Representative Fluo-4 fluorescence trace in a WT fiber during six successive single electrically evoked (twitch) stimuli, a 5-s 10-Hz stimulation train showing both measurement of peak and steady-state levels during the train. (A2A5) Representative Fluo-4 fluorescence traces from WT sibling, stac3−/−, WT rescue (muscle actin:stac3WT-EGFP; stac3−/−), and NAM rescue (muscle actin:stac3NAM-EGFP; stac3−/−) following stimulation. The stimulation protocol consisted of six successive single-voltage pulses (1-Hz) followed by a 5-s 10-Hz stimulation, and finally addition of 10 mM caffeine. (B) Histograms showing that average (±SE) peak electrically evoked change in relative Fluo-4 fluorescence (ΔF/F) during twitch stimulation is dramatically reduced in stac3−/− and NAM rescue fibers compared with WT sibling and WT rescue fibers (t test, WT sibling versus stac3−/−, P < 0.0001 and WT rescue versus NAM rescue, P < 0.0001). (C) Histograms showing that average (±SE) peak change in relative Fluo-4 fluorescence during twitch stimulation is reduced in stac3−/− and NAM rescue fibers compared with WT sibling and WT rescue fibers (t test, WT sibling versus stac3−/−, P < 0.0001 and WT rescue versus NAM rescue, P < 0.0001). (D) Histograms showing that average (±SE) steady-state change in relative Fluo-4 fluorescence during 10-Hz stimulation is reduced in stac3−/− and NAM rescue fibers compared with WT sibling and WT rescue fibers (t test, WT sibling versus stac3−/−, P < 0.0001 and WT rescue versus NAM rescue, P < 0.001). WT sibling, n = 42; stac3−/−, n = 16; WT rescue, n = 27; NAM rescue, n = 14. SEMs are indicated.
Fig. 5.
Fig. 5.
Stac3NAM transgenic zebrafish have reduced motility and hallmarks of malignant hyperthermia. (A) Overlaid traces of touch-evoked swimming by transgenic 72-hpf WT siblings expressing stac3NAM-EGFP (WT sibling + NAM), stac3−/−, transgenic stac3−/−;stac3WT-EGFP (WT rescue), transgenic stac3−/−; stac3NAM-EGFP (NAM rescue), and stac3−/− showing that whereas stac3−/− embryos do not swim, NAM rescue embryos do. (B) Histograms of the speed of swimming by WT sibling + NAM (n = 55, 11, and 32 at 56, 72, and 96 hpf, respectively), stac3−/− (n = 15, 15, and 15), WT rescue (n = 8, 20, and 91), and NAM rescue (n = 18, 55, and 58) show that NAM rescue zebrafish exhibit partial rescue of swimming compared with WT rescue (ANOVA Tukey multiple comparisons, ****P < 0.0001, **P < 0.001). (C) Dose–response plots of Ca2+ release as a function of caffeine concentration indicate that stac3−/− muscles do not show increased Ca2+ release in response to caffeine compared with WT sibling muscles (0.3 mM, n = 30, 30; 1.0 mM, n = 19, 14; 10.0 mM, n = 16, 20; 30.0 mM, n = 18, 29). The data were fit with a sigmoidal with Hill slope of 1. (D) Dose–response plots of Ca2+ release as a function of caffeine concentration show that NAM rescue transgenic muscles release more Ca2+ compared with WT rescue transgenic muscles. Each point represents the average maximal caffeine response relative to the baseline immediately before caffeine application (0.3 mM, n = 171, 192; 1.0 mM, n = 24, 20; 10.0 mM, n = 16, 16; 30.0 mM, n = 22, 23) (t-test comparisons, ****P < 0.0001, **P < 0.01, *P < 0.05). (E) Histogram showing that mean peaks of Ca2+ released from internal stores induced by application of the ICE release mixture are comparable between WT sibling (n = 27) and stac3−/− (n = 35) myofibers (t test, P < 0.7). ns, not significant. (F) Histogram showing that the mean peak of Ca2+ released from NAM rescue fibers (n = 45) is higher than in WT rescue fibers (n = 30, t test, *P = 0.01). SEMs are indicated.
Fig. 6.
Fig. 6.
Model for the role of Stac3 in DHPR trafficking and maintenance of functional tetrads. In WT fibers (Left), Stac3 facilitates direct EC coupling between DHPR tetrads and RyR1, allowing normal Ca2+ release (gray arrowhead) and subsequent refilling of Ca2+ SR stores by SERCA. In stac3NAM fibers (Middle), DHPRα and Stac3NAM are unstable, causing DHPRα to enter degradation and recycling pathways and leaving triadic DHPRα reduced and in incomplete tetrads. EC coupling is less efficient, reducing Ca2+ release, but resulting in excessive SR Ca2+ buildup. In stac3−/− fibers (Right), DHPRα are unstable, reduced, and in incomplete tetrads, and EC coupling is inhibited.

Similar articles

Cited by

References

    1. Flucher BE, Franzini-Armstrong C. Formation of junctions involved in excitation-contraction coupling in skeletal and cardiac muscle. Proc Natl Acad Sci USA. 1996;93(15):8101–8106. - PMC - PubMed
    1. Dowling JJ, Lawlor MW, Dirksen RT. Triadopathies: An emerging class of skeletal muscle diseases. Neurotherapeutics. 2014;11(4):773–785. - PMC - PubMed
    1. Tanabe T, Beam KG, Powell JA, Numa S. Restoration of excitation-contraction coupling and slow calcium current in dysgenic muscle by dihydropyridine receptor complementary DNA. Nature. 1988;336(6195):134–139. - PubMed
    1. Lai FA, Erickson HP, Rousseau E, Liu QY, Meissner G. Purification and reconstitution of the calcium release channel from skeletal muscle. Nature. 1988;331(6154):315–319. - PubMed
    1. Paolini C, Fessenden JD, Pessah IN, Franzini-Armstrong C. Evidence for conformational coupling between two calcium channels. Proc Natl Acad Sci USA. 2004;101(34):12748–12752. - PMC - PubMed

Publication types

MeSH terms