. 2017 Feb 14;91(5):e01755-16.
doi: 10.1128/JVI.01755-16. Print 2017 Mar 1.

Nonstructural Protein 4 of Porcine Reproductive and Respiratory Syndrome Virus Modulates Cell Surface Swine Leukocyte Antigen Class I Expression by Downregulating β2-Microglobulin Transcription

Affiliations

Nonstructural Protein 4 of Porcine Reproductive and Respiratory Syndrome Virus Modulates Cell Surface Swine Leukocyte Antigen Class I Expression by Downregulating β2-Microglobulin Transcription

Pengfei Qi et al. J Virol. .

Abstract

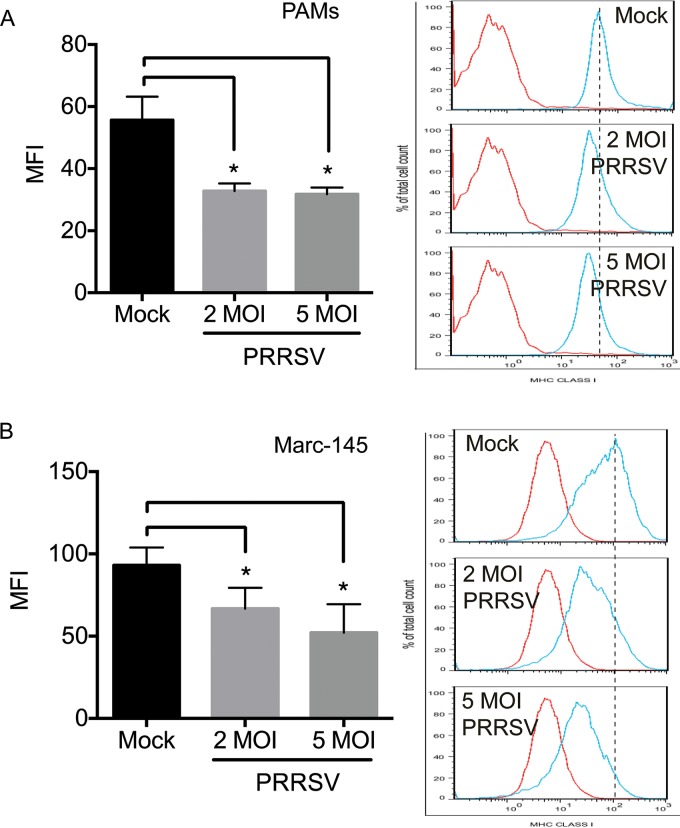
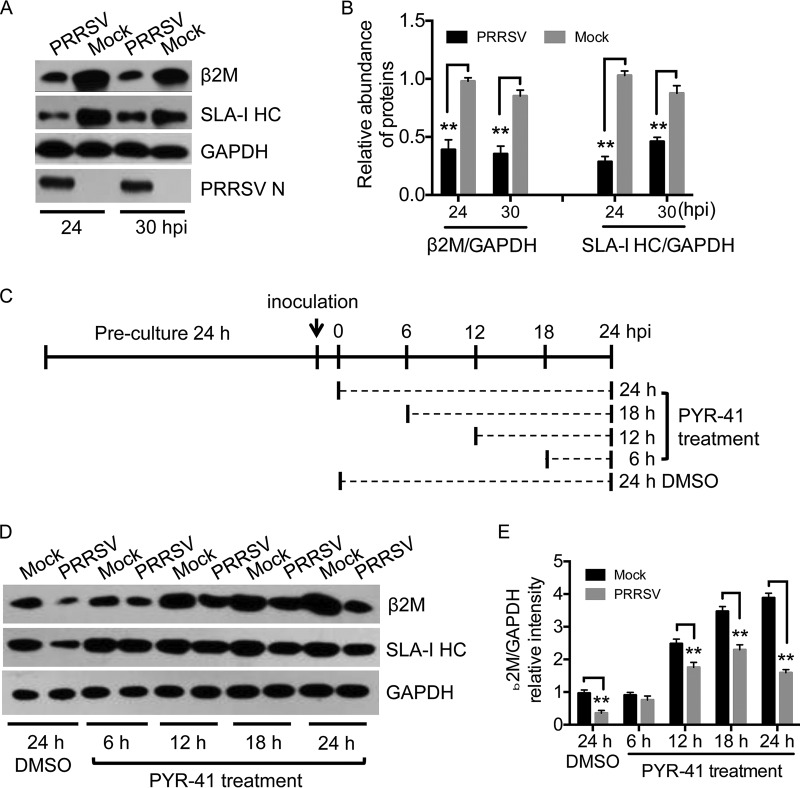
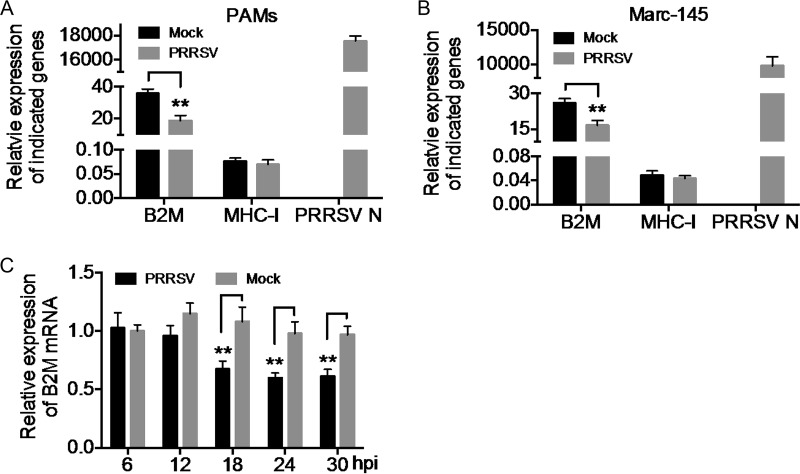
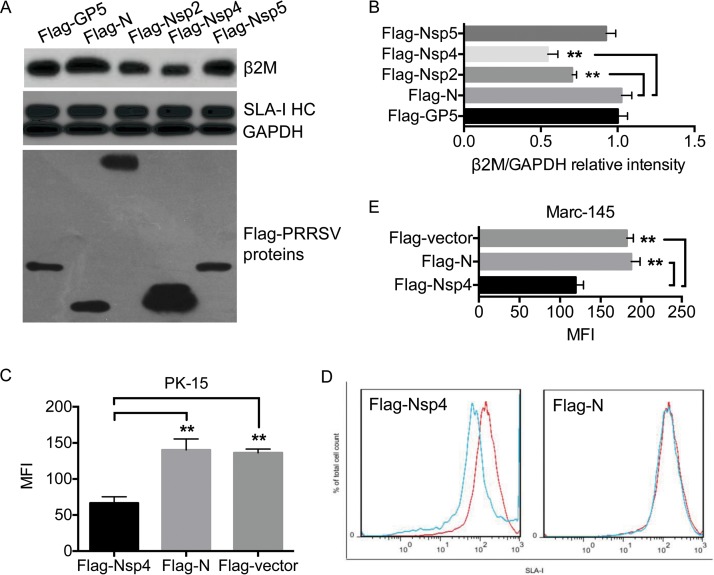
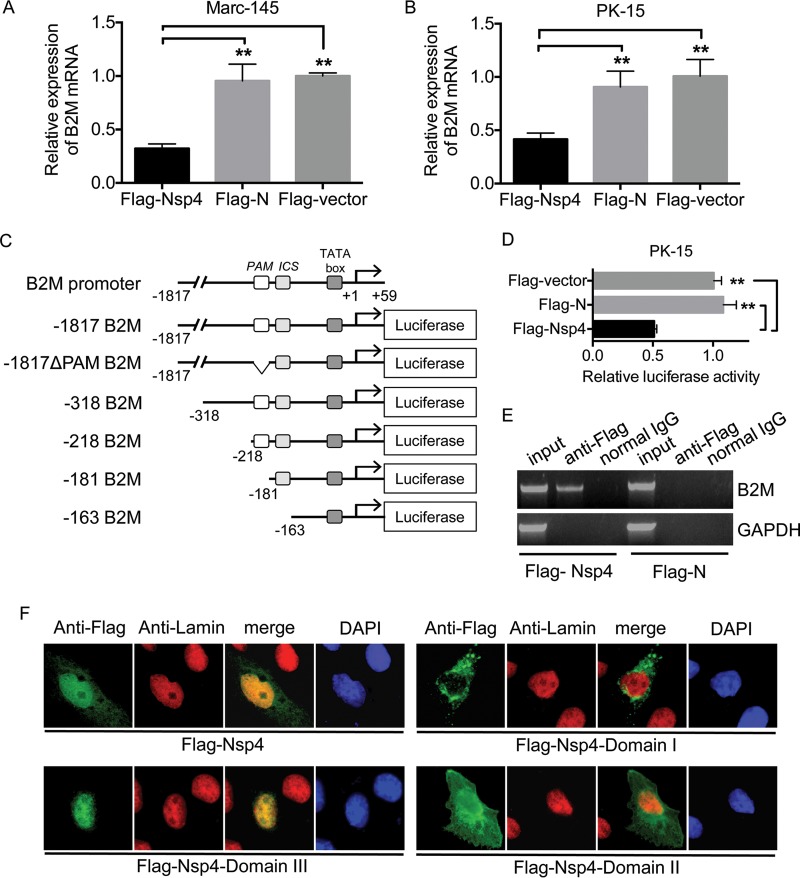
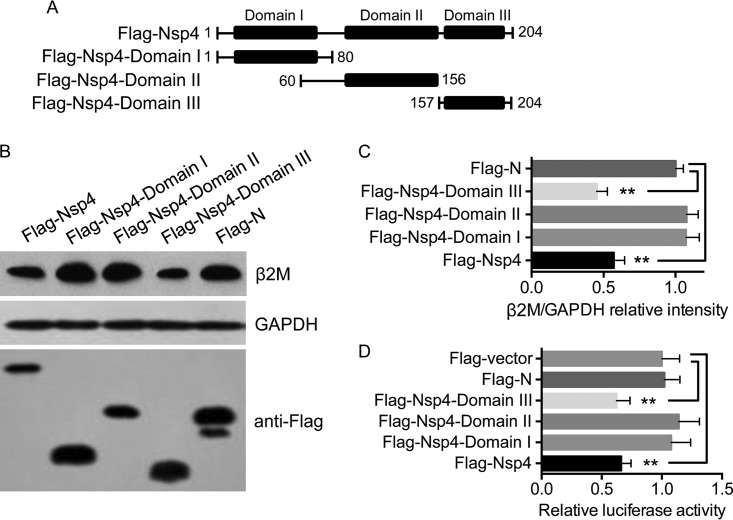
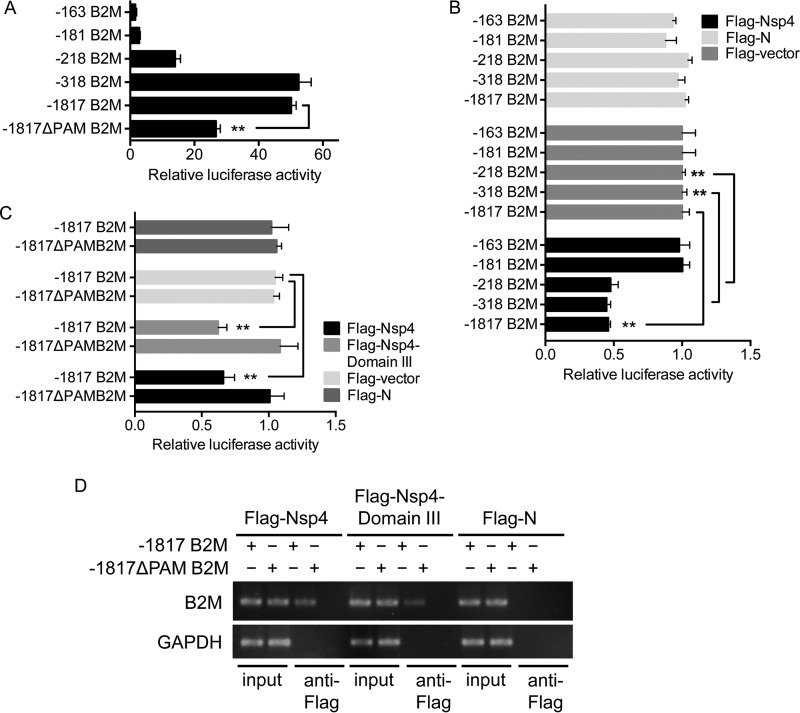
Porcine reproductive and respiratory syndrome virus (PRRSV) is the causative agent of PRRS, which has important impacts on the pig industry. PRRSV infection results in disruption of the swine leukocyte antigen class I (SLA-I) antigen presentation pathway. In this study, highly pathogenic PRRSV (HP-PRRSV) infection inhibited transcription of the β2-microglobulin (β2M) gene (B2M) and reduced cellular levels of β2M, which forms a heterotrimeric complex with the SLA-I heavy chain and a variable peptide and plays a critical role in SLA-I antigen presentation. HP-PRRSV nonstructural protein 4 (Nsp4) was involved in the downregulation of β2M expression. Exogenous expression of Nsp4 downregulated β2M expression at both the mRNA and the protein level and reduced SLA-I expression on the cell surface. Nsp4 bound to the porcine B2M promoter and inhibited its transcriptional activity. Domain III of Nsp4 and the enhancer PAM element of the porcine B2M promoter were identified as essential for the interaction between Nsp4 and B2M These findings demonstrate a novel mechanism whereby HP-PRRSV may modulate the SLA-I antigen presentation pathway and provide new insights into the functions of HP-PRRSV Nsp4. IMPORTANCE PRRSV modulates the host response by disrupting the SLA-I antigen presentation pathway. We show that HP-PRRSV downregulates SLA-I expression on the cell surface via transcriptional inhibition of B2M expression by viral Nsp4. The interaction between domain III of Nsp4 and the enhancer PAM element of the porcine B2M promoter is essential for inhibiting B2M transcription. These observations reveal a novel mechanism whereby HP-PRRSV may modulate SLA-I antigen presentation and provide new insights into the functions of viral Nsp4.

Keywords: Nsp4; PRRSV; SLA-I; porcine B2M promoter; porcine reproductive and respiratory syndrome virus; β2-microglobulin.


Figures

FIG 1
FIG 1
Downregulation of SLA-I expression on the cell surface by HP-PRRSV infection. PAMs (A) and Marc-145 cells (B) were mock infected (Mock) or infected with HP-PRRSV at MOI of 2 and 5 and incubated for 24 h. The expression levels of SLA-I on the cell surface were measured by flow cytometry with anti-SLA-I HC monoclonal antibodies and are presented as mean fluorescence intensities (MFI). Data are presented as means ± SD from three independent experiments. *, P < 0.05 between HP-PRRSV- and mock-infected cells as determined by Student's t test.
FIG 2
FIG 2
Cellular levels of β2M protein in HP-PRRSV-infected cells. Marc-145 cells were mock infected (Mock) or infected with HP-PRRSV at an MOI of 2 and incubated at 37°C for the indicated times. Cellular levels of β2M, the SLA-I HC, GAPDH, and PRRSV N were detected by Western blotting. (A) Infected Marc-145 cells were harvested at 24 and 30 h postinfection (hpi) and subjected to Western blot analysis. (B) Intensities of protein bands were determined by densitometric analysis. Relative cellular levels of β2M and the SLA-I HC were normalized to GAPDH levels and are presented relative to the level in mock-infected cells at 24 hpi (set as 1). (C) Schematic representation of PYR-41 treatment. Infected Marc-145 cells were treated with PYR-41 at 125 μM or mock treated with DMSO and incubated at 37°C for the indicated times. (D) Cellular levels of the indicated proteins in PYR-41-treated cells were determined by Western blotting. (E) Intensities of protein bands were determined by densitometric analysis. Relative cellular levels of β2M were normalized to GAPDH levels and are presented relative to the levels in mock-infected and DMSO-treated cells (set as 1). Data are presented as means ± SD from three independent experiments. **, P < 0.01 between the indicated groups analyzed by Student's t test.
FIG 3
FIG 3
Downregulation of β2M transcription by HP-PRRSV infection. PAMs (A) and Marc-145 cells (B) were mock infected (Mock) or infected with HP-PRRSV at an MOI of 2 and incubated at 37°C for 24 h. mRNA levels of B2M, SLA-I, and PRRSV N were determined by qRT-PCR. Relative mRNA levels of each gene were normalized to levels of the GAPDH housekeeping gene and plotted. (C) Marc-145 cells were mock infected (Mock) or infected with HP-PRRSV at an MOI of 2 and incubated at 37°C for the indicated times. mRNA levels of B2M were determined by qRT-PCR. Relative mRNA levels of B2M were normalized to GAPDH levels and are expressed relative to the level in mock-infected cells at 6 h postinfection (hpi) (set as 1). Data are presented as means ± SD from three independent experiments. **, P < 0.01 between the indicated groups analyzed by Student's t test.
FIG 4
FIG 4
Nsp4 reduces the cellular level of β2M protein. (A) Marc-145 cells were transfected with the indicated plasmids and incubated at 37°C for 24 h. The expression of Flag-tagged viral proteins in the transfectants was probed by Western blotting with anti-Flag antibody. Cellular levels of β2M, the SLA-I HC, and GAPDH were detected by Western blotting. (B) Intensities of protein bands were determined by densitometric analysis. Relative cellular levels of β2M in the transfectants were normalized to GAPDH levels and are presented relative to the level in cells expressing Flag-N (set as 1). PK-15 (C and D) and Marc-145 (E) cells were transfected with plasmids expressing Flag-Nsp4, Flag-N, or the Flag-vector and incubated at 37°C for 24 h. Expression levels of SLA-I on the cell surface were measured by flow cytometry with anti-SLA-I monoclonal antibodies and are presented as mean fluorescence intensities (MFI). Data are presented as means ± SD from three independent experiments. **, P < 0.01 between the indicated groups analyzed by Student's t test.
FIG 5
FIG 5
Nsp4 inhibits transcription of B2M. Marc-145 (A) and PK-15 (B) cells were transfected with plasmids expressing Flag-Nsp4, Flag-N, or the Flag-vector and incubated at 37°C for 24 h. Levels of B2M mRNA in the transfectants were determined by qRT-PCR. Relative levels of B2M mRNA were normalized to levels of the GAPDH housekeeping gene and are expressed relative to the level in cells transfected with the Flag-vector (set as 1). (C) Schematic representation of the porcine B2M promoter region and luciferase reporter plasmids. (D) PK-15 cells were cotransfected with the luciferase reporter plasmid −1817 B2M and a plasmid expressing Flag-Nsp4, Flag-N, or the Flag-vector. Luciferase activities of the transfectants were analyzed at 24 h posttransfection. Luciferase activity was normalized to Renilla luciferase activity and is presented relative to the activity in cells transfected with the Flag-vector (set as 1). (E) PK-15 cells were transfected with a plasmid expressing Flag-Nsp4 or Flag-N and incubated at 37°C for 24 h. Transfectants were harvested 24 h posttransfection and subjected to ChIP assay with anti-Flag antibody. The bound DNA fractions were detected by PCR with appropriate primers (Table 1). PCR products were analyzed by 4% agarose gel electrophoresis. (F) PK-15 cells were transfected with a plasmid expressing Flag-Nsp4 or Flag-Nsp4 domains and incubated at 37°C for 24 h. The subcellular localization of the expressed Nsp4 proteins (green) was visualized by immunofluorescence assay with anti-Flag antibody. Nuclear marker lamins (red) were probed with anti-lamin A/C antibody to indicate the nuclei. Nuclei were counterstained with 4′,6-diamidino-2-phenylindole (DAPI) (blue). Data are presented as means ± SD from three independent experiments. **, P < 0.01 between the indicated groups analyzed by Student's t test.
FIG 6
FIG 6
Domain III of Nsp4 inhibits β2M expression. (A) Schematic representation of Nsp4 domains and truncated mutant Nsp4 domains. (B) Marc-145 cells were transfected with the indicated plasmids and incubated at 37°C for 24 h. Expression levels of β2M, GAPDH, and Flag-tagged viral proteins were determined by Western blotting. (C) Intensities of protein bands were determined by densitometric analysis. Relative cellular levels of β2M in the transfectants were normalized to GAPDH levels and are presented relative to the level in cells expressing Flag-N (set as 1). (D) PK-15 cells were cotransfected with the luciferase reporter plasmid −1817 B2M and the plasmid expressing Flag-Nsp4, the Flag-Nsp4 domains, Flag-N, or the Flag-vector. Luciferase activities of the transfectants were analyzed at 24 h posttransfection. Luciferase activity was normalized to Renilla luciferase activity and is presented relative to the activity in cells transfected with the Flag-vector (set as 1). Data are presented as means ± SD from three independent experiments. **, P < 0.01 between the indicated groups analyzed by Student's t test.
FIG 7
FIG 7
The PAM element is necessary for Nsp4-domain III binding to B2M promoter. (A) PK-15 cells were transfected with the indicated luciferase reporter plasmids containing a series of truncated B2M promoters. The transcriptional activity of each truncated B2M promoter was determined at 24 h posttransfection using luciferase assay and normalized to Renilla luciferase activity. (B) PK-15 cells were cotransfected with the indicated luciferase reporter plasmids and a plasmid expressing Flag-Nsp4, Flag-N, or the Flag-vector. The transcriptional activity of each truncated B2M promoter was determined at 24 h posttransfection using a luciferase assay. The luciferase activity of each transfectant was normalized to Renilla luciferase activity and is presented relative to the activity in cells cotransfected with each truncated B2M promoter and the Flag-vector (set as 1). (C) PK-15 cells were cotransfected with a luciferase reporter plasmid containing −1817 B2M or −1817ΔPAM B2M and a plasmid expressing Flag-Nsp4, Flag-Nsp4-domain III, Flag-N, or the Flag-vector. The transcriptional activity of each truncated B2M promoter was determined at 24 h posttransfection by a luciferase assay. The luciferase activity of each transfectant was normalized to Renilla luciferase activity and is presented relative to the activity in cells cotransfected with each truncated B2M promoter and the Flag-vector (set as 1). (D) Vero cells were cotransfected with a luciferase reporter plasmid containing −1817 B2M or −1817ΔPAM B2M and a plasmid expressing Flag-Nsp4, Flag-Nsp4-domain III, or Flag-N. The transfectants were harvested 24 h posttransfection and subjected to a ChIP assay with anti-Flag antibody. The bound DNA fractions were detected by PCR with appropriate primers (Table 1). The PCR products were analyzed by 4% agarose gel electrophoresis. Data are presented as means ± SD from three independent experiments. **, P < 0.01 between the indicated groups analyzed by Student's t test.

Similar articles

Cited by

References

    1. Lunney JK, Ho CS, Wysocki M, Smith DM. 2009. Molecular genetics of the swine major histocompatibility complex, the SLA complex. Dev Comp Immunol 33:362–374. doi:10.1016/j.dci.2008.07.002. - DOI - PubMed
    1. van de Weijer ML, Luteijn RD, Wiertz EJ. 2015. Viral immune evasion: lessons in MHC class I antigen presentation. Semin Immunol 27:125–137. doi:10.1016/j.smim.2015.03.010. - DOI - PubMed
    1. Raghavan M, Del Cid N, Rizvi SM, Peters LR. 2008. MHC class I assembly: out and about. Trends Immunol 29:436–443. doi:10.1016/j.it.2008.06.004. - DOI - PMC - PubMed
    1. Zijlstra M, Bix M, Simister NE, Loring JM, Raulet DH, Jaenisch R. 1990. Beta 2-microglobulin deficient mice lack CD4−8+ cytolytic T cells. Nature 344:742–746. doi:10.1038/344742a0. - DOI - PubMed
    1. Browne H, Smith G, Beck S, Minson T. 1990. A complex between the MHC class I homologue encoded by human cytomegalovirus and beta 2 microglobulin. Nature 347:770–772. doi:10.1038/347770a0. - DOI - PubMed

MeSH terms

Substances