

Prognostic utility of admission cell-free DNA levels in patients with chronic obstructive pulmonary disease exacerbations
- PMID: 28003743
- PMCID: PMC5158140
- DOI: 10.2147/COPD.S113256
Prognostic utility of admission cell-free DNA levels in patients with chronic obstructive pulmonary disease exacerbations
Abstract
Background: Chronic obstructive pulmonary disease exacerbations (COPDEs) are associated with increased morbidity and mortality. Cell-free DNA (cfDNA) is a novel biomarker associated with clinical outcomes in several disease states but has not been studied in COPD. The objectives of this study were to assess cfDNA levels during a COPDE, to evaluate the association of cfDNA with clinical parameters and to explore the prognostic implications of cfDNA levels on long-term survival.
Methods: This was an observational study that assessed cfDNA levels in patients admitted to hospital for a COPDE. Plasma cfDNA levels of COPDE patients were compared to those of matched stable COPD patients and healthy controls. Multivariable and Cox regression analyses were used to assess the association of cfDNA levels with blood gas parameters and long-term survival.
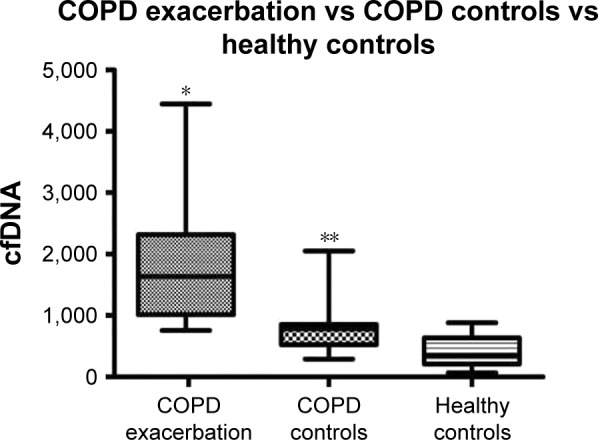
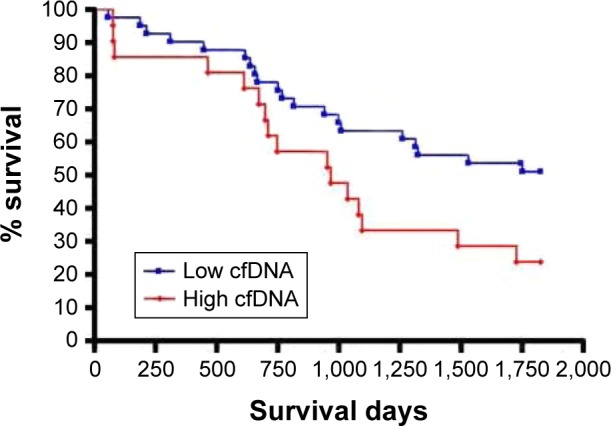
Results: A total of 62 patients (46 males, forced expiratory volume in 1 second [FEV1] 38%±13%) were included. The median cfDNA levels on admission for COPDE patients was 1,634 ng/mL (interquartile range [IQR] 1,016-2,319) compared to 781 ng/mL (IQR 523-855) for stable COPD patients, matched for age and disease severity, and 352 ng/mL (IQR 209-636) for healthy controls (P<0.0001, for both comparisons). cfDNA was correlated with partial arterial pressure of carbon dioxide (PaCO2, r=0.35) and pH (r=-0.35), P=0.01 for both comparisons. In a multivariable analysis, PaCO2 was the only independent predictor of cfDNA. Using a cfDNA level of 1,924 ng/mL (threshold for abnormal PaCO2), those with high levels had a trend for increased 5-year mortality risk adjusted for age, sex and FEV1% (hazard ratio 1.92, 95% confidence interval 0.93-3.95, P=0.08).
Conclusion: Plasma cfDNA might offer a novel technique to identify COPD patients at increased risk of poor outcomes, but the prognostic utility of this measurement requires further study.
Keywords: biomarker; cell-free DNA; chronic obstructive pulmonary disease; exacerbation; prognosis.
Conflict of interest statement
Amos Douvdevani submitted a US Patent Application No 13/659,439 “Assay for Detecting Circulating Free Nucleic Acids.” Dmitry Rozenberg received salary support from the University of Toronto, Clinician Scientist Training program and Vanier Graduate Scholarship. The other authors report no conflicts of interest in this work.
Figures

Similar articles
-
Prognostic role of D-dimer for in-hospital and 1-year mortality in exacerbations of COPD.Int J Chron Obstruct Pulmon Dis. 2016 Oct 31;11:2729-2736. doi: 10.2147/COPD.S112882. eCollection 2016. Int J Chron Obstruct Pulmon Dis. 2016. PMID: 27843309 Free PMC article.
-
The chronic obstructive pulmonary disease assessment test improves the predictive value of previous exacerbations for poor outcomes in COPD.Int J Chron Obstruct Pulmon Dis. 2015 Nov 30;10:2571-9. doi: 10.2147/COPD.S91163. eCollection 2015. Int J Chron Obstruct Pulmon Dis. 2015. PMID: 26664105 Free PMC article.
-
Elevated circulating PAI-1 levels are related to lung function decline, systemic inflammation, and small airway obstruction in chronic obstructive pulmonary disease.Int J Chron Obstruct Pulmon Dis. 2016 Sep 26;11:2369-2376. doi: 10.2147/COPD.S107409. eCollection 2016. Int J Chron Obstruct Pulmon Dis. 2016. PMID: 27713627 Free PMC article.
-
Defining the role of neutrophil-to-lymphocyte ratio in COPD: a systematic literature review.Int J Chron Obstruct Pulmon Dis. 2018 Nov 5;13:3651-3662. doi: 10.2147/COPD.S178068. eCollection 2018. Int J Chron Obstruct Pulmon Dis. 2018. PMID: 30464448 Free PMC article.
-
The clinical value of suPAR in diagnosis and prediction for patients with chronic obstructive pulmonary disease: a systematic review and meta-analysis.Ther Adv Respir Dis. 2020 Jan-Dec;14:1753466620938546. doi: 10.1177/1753466620938546. Ther Adv Respir Dis. 2020. PMID: 32643535 Free PMC article.
Cited by
-
Circulating cell-free DNA as a potential marker in smoke inhalation injury.Medicine (Baltimore). 2019 Mar;98(12):e14863. doi: 10.1097/MD.0000000000014863. Medicine (Baltimore). 2019. PMID: 30896631 Free PMC article.
-
Cell-Free DNA: Potential Application in COVID-19 Diagnostics and Management.Viruses. 2022 Feb 4;14(2):321. doi: 10.3390/v14020321. Viruses. 2022. PMID: 35215914 Free PMC article. Review.
-
Extracellular Release of Mitochondrial DNA: Triggered by Cigarette Smoke and Detected in COPD.Cells. 2022 Jan 22;11(3):369. doi: 10.3390/cells11030369. Cells. 2022. PMID: 35159179 Free PMC article.
-
An automated, high-throughput methodology optimized for quantitative cell-free mitochondrial and nuclear DNA isolation from plasma.J Biol Chem. 2020 Nov 13;295(46):15677-15691. doi: 10.1074/jbc.RA120.015237. Epub 2020 Sep 8. J Biol Chem. 2020. PMID: 32900851 Free PMC article.
-
Epigenetic underpinnings of inflammation: Connecting the dots between pulmonary diseases, lung cancer and COVID-19.Semin Cancer Biol. 2022 Aug;83:384-398. doi: 10.1016/j.semcancer.2021.01.003. Epub 2021 Jan 20. Semin Cancer Biol. 2022. PMID: 33484868 Free PMC article. Review.
References
-
- Lange P, Marott JL, Vestbo J, et al. Prediction of the clinical course of chronic obstructive pulmonary disease, using the new GOLD classification: a study of the general population. Am J Respir Crit Care Med. 2012;186(10):975–981. - PubMed
-
- McGhan R, Radcliff T, Fish R, Sutherland ER, Welsh C, Make B. Predictors of rehospitalization and death after a severe exacerbation of COPD. Chest. 2007;132(6):1748–1755. - PubMed
-
- Groenewegen KH, Schols AM, Wouters EF. Mortality and mortality-related factors after hospitalization for acute exacerbation of COPD. Chest. 2003;124(2):459–467. - PubMed
Publication types
MeSH terms
Substances
LinkOut - more resources
Full Text Sources
Other Literature Sources
Medical
