Reduced γ-Aminobutyric Acid and Glutamate+Glutamine Levels in Drug-Naïve Patients with First-Episode Schizophrenia but Not in Those at Ultrahigh Risk
- PMID: 28003912
- PMCID: PMC5149697
- DOI: 10.1155/2016/3915703
Reduced γ-Aminobutyric Acid and Glutamate+Glutamine Levels in Drug-Naïve Patients with First-Episode Schizophrenia but Not in Those at Ultrahigh Risk
Abstract
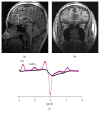
Altered γ-aminobutyric acid (GABA), glutamate (Glu) levels, and an imbalance between GABAergic and glutamatergic neurotransmissions have been involved in the pathophysiology of schizophrenia. However, it remains unclear how these abnormalities impact the onset and course of psychosis. In the present study, 21 drug-naïve subjects at ultrahigh risk for psychosis (UHR), 16 drug-naïve patients with first-episode schizophrenia (FES), and 23 healthy controls (HC) were enrolled. In vivo GABA and glutamate+glutamine (Glx) levels in the medial prefrontal cortex were measured using proton magnetic resonance spectroscopy. Medial prefrontal GABA and Glx levels in FES patients were significantly lower than those in HC and UHR, respectively. GABA and Glx levels in UHR were comparable with those in HC. In each group, there was a positive correlation between GABA and Glx levels. Reduced medial prefrontal GABA and Glx levels thus may play an important role in the early stages of schizophrenia.
Conflict of interest statement
The authors report no competing interests related to this manuscript.
Figures


Similar articles
-
In vivo gamma-aminobutyric acid and glutamate levels in people with first-episode schizophrenia: A proton magnetic resonance spectroscopy study.Schizophr Res. 2018 Mar;193:295-303. doi: 10.1016/j.schres.2017.07.021. Epub 2017 Jul 25. Schizophr Res. 2018. PMID: 28751130
-
Cortico-Striatal GABAergic and Glutamatergic Dysregulations in Subjects at Ultra-High Risk for Psychosis Investigated with Proton Magnetic Resonance Spectroscopy.Int J Neuropsychopharmacol. 2015 Sep 12;19(3):pyv105. doi: 10.1093/ijnp/pyv105. Int J Neuropsychopharmacol. 2015. PMID: 26364273 Free PMC article.
-
Elevated prefrontal cortex γ-aminobutyric acid and glutamate-glutamine levels in schizophrenia measured in vivo with proton magnetic resonance spectroscopy.Arch Gen Psychiatry. 2012 May;69(5):449-59. doi: 10.1001/archgenpsychiatry.2011.1519. Epub 2012 Jan 2. Arch Gen Psychiatry. 2012. PMID: 22213769
-
Glutamatergic and GABAergic metabolite levels in schizophrenia-spectrum disorders: a meta-analysis of 1H-magnetic resonance spectroscopy studies.Mol Psychiatry. 2022 Jan;27(1):744-757. doi: 10.1038/s41380-021-01297-6. Epub 2021 Sep 28. Mol Psychiatry. 2022. PMID: 34584230 Review.
-
Differences in excitatory and inhibitory neurotransmitter levels between depressed patients and healthy controls: A systematic review and meta-analysis.J Psychiatr Res. 2018 Oct;105:33-44. doi: 10.1016/j.jpsychires.2018.08.015. Epub 2018 Aug 11. J Psychiatr Res. 2018. PMID: 30144668
Cited by
-
Glutamate Levels and Resting Cerebral Blood Flow in Anterior Cingulate Cortex Are Associated at Rest and Immediately Following Infusion of S-Ketamine in Healthy Volunteers.Front Psychiatry. 2018 Feb 6;9:22. doi: 10.3389/fpsyt.2018.00022. eCollection 2018. Front Psychiatry. 2018. PMID: 29467681 Free PMC article.
-
7T Proton Magnetic Resonance Spectroscopy of the Anterior Cingulate Cortex in First-Episode Schizophrenia.Schizophr Bull. 2019 Jan 1;45(1):180-189. doi: 10.1093/schbul/sbx190. Schizophr Bull. 2019. PMID: 29385594 Free PMC article.
-
Abnormal neurobiochemical metabolites in the first- episode schizophrenia and clinical high-risk population.Zhong Nan Da Xue Xue Bao Yi Xue Ban. 2021 Oct 28;46(10):1090-1095. doi: 10.11817/j.issn.1672-7347.2021.200240. Zhong Nan Da Xue Xue Bao Yi Xue Ban. 2021. PMID: 34911838 Free PMC article. Chinese, English.
-
Anterior Cingulate Cortex Glutamate Levels Are Related to Response to Initial Antipsychotic Treatment in Drug-Naive First-Episode Schizophrenia Patients.Front Psychiatry. 2020 Oct 23;11:553269. doi: 10.3389/fpsyt.2020.553269. eCollection 2020. Front Psychiatry. 2020. PMID: 33192666 Free PMC article.
-
GABA levels and TSPO expression in people at clinical high risk for psychosis and healthy volunteers: a PET-MRS study.J Psychiatry Neurosci. 2019 Mar 1;44(2):111-119. doi: 10.1503/jpn.170201. J Psychiatry Neurosci. 2019. PMID: 30255837 Free PMC article.
References
Publication types
MeSH terms
Substances
LinkOut - more resources
Full Text Sources
Other Literature Sources
Medical
Miscellaneous

