

Use of T1-weighted/T2-weighted magnetic resonance ratio to elucidate changes due to amyloid β accumulation in cognitively normal subjects
- PMID: 28003959
- PMCID: PMC5157788
- DOI: 10.1016/j.nicl.2016.11.029
Use of T1-weighted/T2-weighted magnetic resonance ratio to elucidate changes due to amyloid β accumulation in cognitively normal subjects
Abstract
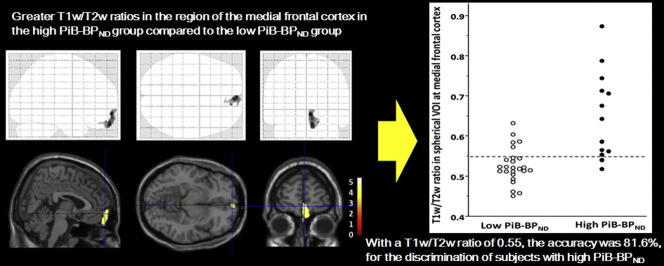
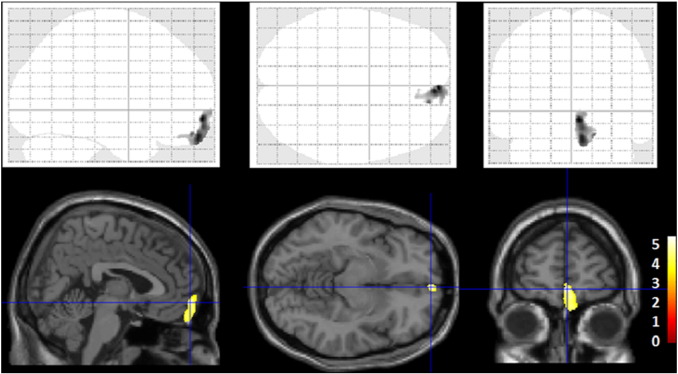
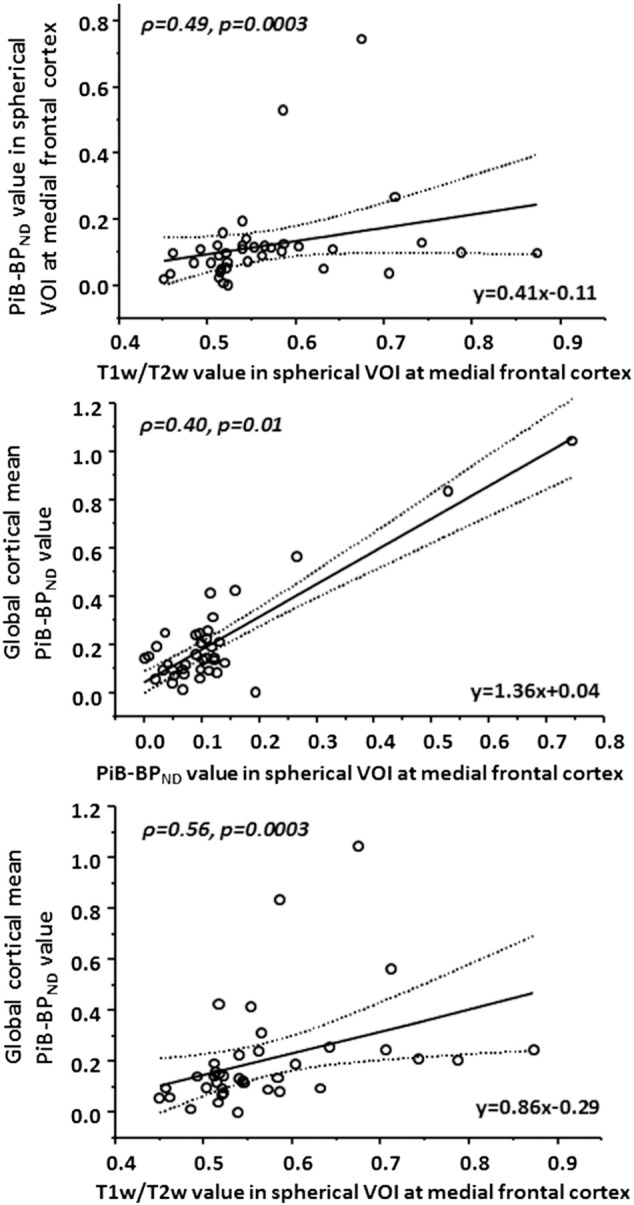
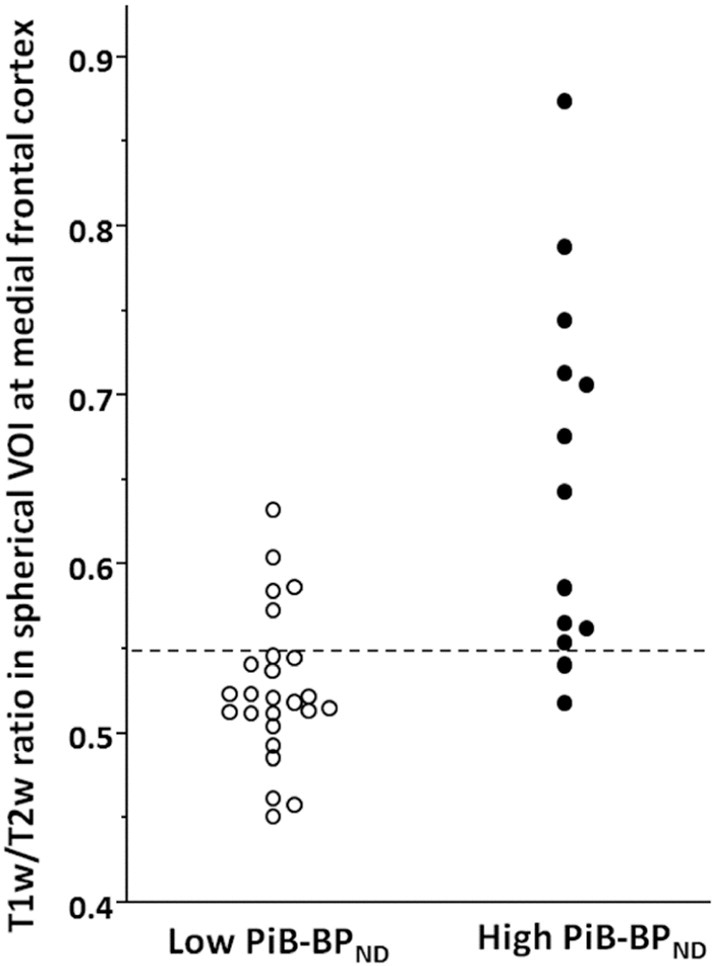
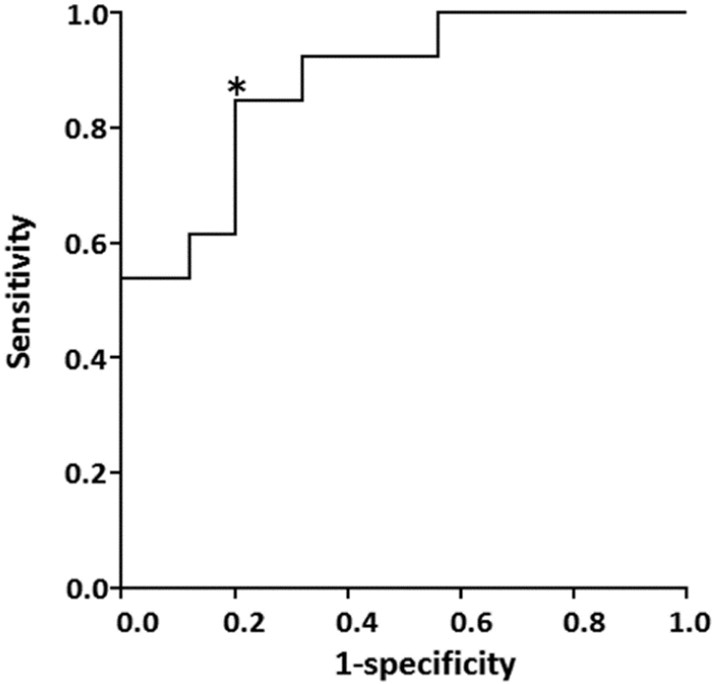
The ratio of signal intensity in T1-weighted (T1w) and T2-weighted (T2w) magnetic resonance imaging (MRI) was recently proposed to enhance the sensitivity of detecting changes in disease-related signal intensity. The objective of this study was to test the effectiveness of T1w/T2w image ratios as an easily accessible biomarker for amyloid beta (Aβ) accumulation. We performed the T1w/T2w analysis in cognitively normal elderly individuals. We applied [11C] Pittsburgh Compound B (PiB)-PET to the same individuals, and Aβ deposition was quantified by its binding potential (PiB-BPND). The subjects were divided into low and high PiB-BPND groups, and group differences in regional T1w/T2w values were evaluated. In the regions where we found a significant group difference, we conducted a correlation analysis between regional T1w/T2w values and PiB-BPND. Subjects with high global cortical PiB-BPND showed a significantly higher regional T1w/T2w ratio in the frontal cortex and anterior cingulate cortex. We found a significant positive relationship between the regional T1w/T2w ratio and Aβ accumulation. Moreover, with a T1w/T2w ratio of 0.55 in the medial frontal regions, we correctly discriminated subjects with high PiB-BPND from the entire subject population with a sensitivity of 84.6% and specificity of 80.0%. Our results indicate that early Aβ-induced pathological changes can be detected using the T1w/T2w ratio on MRI. We believe that the T1w/T2w ratio is a prospective stable biological marker of early Aβ accumulation in cognitively normal individuals. The availability of such an accessible marker would improve the efficiency of clinical trials focusing on the initial disease stages by reducing the number of subjects who require screening by Aβ-PET scan or lumbar puncture.
Keywords: 11C–labeled Pittsburgh Compound B ([11C]PiB); AD, Alzheimer's disease; Alzheimer's disease (AD); Amyloid-β (Aβ); Aβ, amyloid beta; BP, binding potential; CSF, cerebrospinal fluid; FWHM, full-width at half maximum; MRI, magnetic resonance imaging; PET, positron emission tomography; PiB, Pittsburgh Compound B; PiB-BPND, PiB-BP estimates relative to non-displaceable (ND) binding; Positron emission tomography (PET); ROC, receiver operating characteristic; T1-weighted/T2-weighted magnetic resonance ratio images; T1w, T1-weighted; T2w, T2-weighted; VOI, volumes of interest.
Figures
Similar articles
-
High amyloid-β deposition related to depressive symptoms in older individuals with normal cognition: a pilot study.Int J Geriatr Psychiatry. 2016 Aug;31(8):920-8. doi: 10.1002/gps.4409. Epub 2016 Jan 14. Int J Geriatr Psychiatry. 2016. PMID: 26766490
-
Basal forebrain atrophy correlates with amyloid β burden in Alzheimer's disease.Neuroimage Clin. 2014 Nov 27;7:105-13. doi: 10.1016/j.nicl.2014.11.015. eCollection 2015. Neuroimage Clin. 2014. PMID: 25610772 Free PMC article.
-
Mutual effect of cerebral amyloid β and peripheral lymphocytes in cognitively normal older individuals.Int J Geriatr Psychiatry. 2017 Dec;32(12):e93-e99. doi: 10.1002/gps.4660. Epub 2017 Jan 23. Int J Geriatr Psychiatry. 2017. PMID: 28111810
-
Positron emission tomography radiopharmaceuticals for imaging brain Beta-amyloid.Semin Nucl Med. 2011 Jul;41(4):283-99. doi: 10.1053/j.semnuclmed.2011.02.005. Semin Nucl Med. 2011. PMID: 21624562 Review.
-
[Amyloid PET in Alzheimer research].Brain Nerve. 2010 Jul;62(7):757-67. Brain Nerve. 2010. PMID: 20675880 Review. Japanese.
Cited by
-
MRAβ: A multimodal MRI-derived amyloid-β biomarker for Alzheimer's disease.Hum Brain Mapp. 2023 Oct 15;44(15):5139-5152. doi: 10.1002/hbm.26452. Epub 2023 Aug 14. Hum Brain Mapp. 2023. PMID: 37578386 Free PMC article.
-
Cortical amyloid-beta burden is associated with changes in intracortical myelin in cognitively normal older adults.Transl Psychiatry. 2023 Apr 6;13(1):115. doi: 10.1038/s41398-023-02420-7. Transl Psychiatry. 2023. PMID: 37024484 Free PMC article.
-
Comparative Sensitivity of MRI Indices for Myelin Assessment in Spinal Cord Regions.Tomography. 2025 Jan 14;11(1):8. doi: 10.3390/tomography11010008. Tomography. 2025. PMID: 39852688 Free PMC article.
-
Intensity scaling of conventional brain magnetic resonance images avoiding cerebral reference regions: A systematic review.PLoS One. 2024 Mar 14;19(3):e0298642. doi: 10.1371/journal.pone.0298642. eCollection 2024. PLoS One. 2024. PMID: 38483873 Free PMC article.
-
Cortical myelin profile variations in healthy aging brain: A T1w/T2w ratio study.Neuroimage. 2022 Dec 1;264:119743. doi: 10.1016/j.neuroimage.2022.119743. Epub 2022 Nov 8. Neuroimage. 2022. PMID: 36368498 Free PMC article.
References
-
- Bateman R.J., Xiong C., Benzinger T.L., Fagan A.M., Goate A., Fox N.C., Marcus D.S., Cairns N.J., Xie X., Blazey T.M., Holtzman D.M., Santacruz A., Buckles V., Oliver A., Moulder K., Aisen P.S., Ghetti B., Klunk W.E., McDade E., Martins R.N., Masters C.L., Mayeux R., Ringman J.M., Rossor M.N., Schofield P.R., Sperling R.A., Salloway S., Morris J.C. Clinical and biomarker changes in dominantly inherited Alzheimer's disease. N. Engl. J. Med. 2012;367:795–804. - PMC - PubMed
-
- Fukunaga M., Li T.Q., van Gelderen P., de Zwart J.A., Shmueli K., Yao B., Lee J., Maric D., Aronova M.A., Zhang G., Leapman R.D., Schenck J.F., Merkle H., Duyn J.H. Layer-specific variation of iron content in cerebral cortex as a source of MRI contrast. Proc. Natl. Acad. Sci. U. S. A. 2010;107:3834–3839. - PMC - PubMed
MeSH terms
Substances
LinkOut - more resources
Full Text Sources
Other Literature Sources
Medical
