

Development of cortical thickness and surface area in autism spectrum disorder
- PMID: 28003960
- PMCID: PMC5157792
- DOI: 10.1016/j.nicl.2016.12.003
Development of cortical thickness and surface area in autism spectrum disorder
Abstract
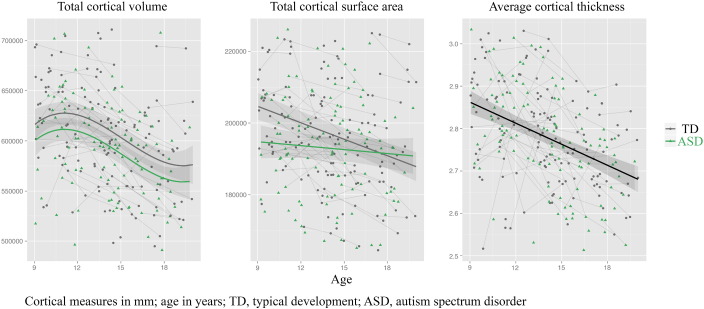
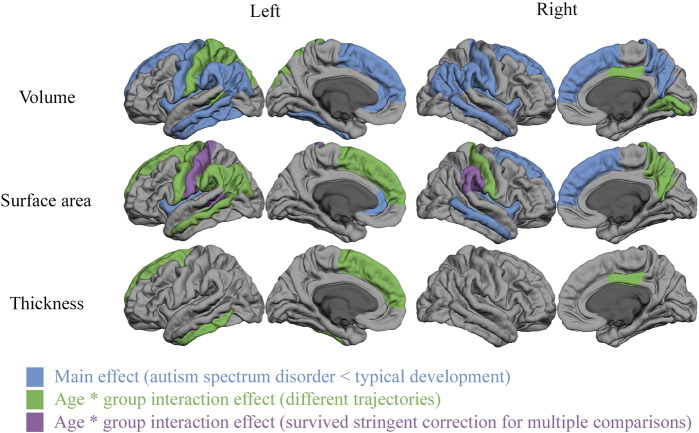
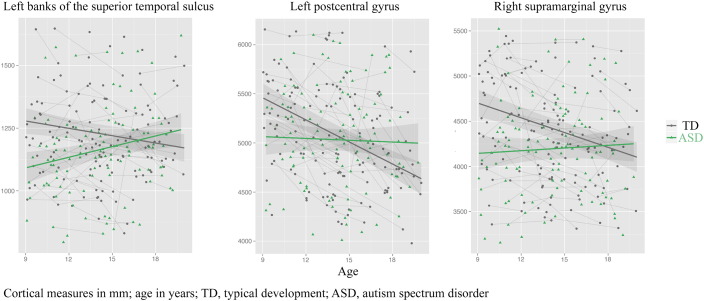
Autism spectrum disorder (ASD) is a neurodevelopmental disorder often associated with changes in cortical volume. The constituents of cortical volume - cortical thickness and surface area - have separable developmental trajectories and are related to different neurobiological processes. However, little is known about the developmental trajectories of cortical thickness and surface area in ASD. In this magnetic resonance imaging (MRI) study, we used an accelerated longitudinal design to investigate the cortical development in 90 individuals with ASD and 90 typically developing controls, aged 9 to 20 years. We quantified cortical measures using the FreeSurfer software package, and then used linear mixed model analyses to estimate the developmental trajectories for each cortical measure. Our primary finding was that the development of surface area follows a linear trajectory in ASD that differs from typically developing controls. In typical development, we found a decline in cortical surface area between the ages of 9 and 20 that was absent in ASD. We found this pattern in all regions where developmental trajectories for surface area differed between groups. When we applied a more stringent correction that takes the interdependency of measures into account, this effect on cortical surface area retained significance for left banks of superior temporal sulcus, postcentral area, and right supramarginal area. These areas have previously been implicated in ASD and are involved in the interpretation and processing of audiovisual social stimuli and distinction between self and others. Although some differences in cortical volume and thickness were found, none survived the more stringent correction for multiple testing. This study underscores the importance of distinguishing between cortical surface area and thickness in investigating cortical development, and suggests the development of cortical surface area is of importance to ASD.
Keywords: Autism spectrum disorder; Cortex; Cortical thickness; Development; MRI; Surface area.
Figures
References
-
- Amaral D.G., Schumann C.M., Nordahl C.W. Neuroanatomy of autism. Trends Neurosci. 2008;31:137–145. - PubMed
-
- American Psychiatric Association . 2000. Diagnostic and Statistical Manual of Mental Disorders Revised Fourth Edition (DSM-IV-TR). Washington, DC.
-
- American Psychiatric Association . 5th ed. Washington; DC: 2013. Diagnostic and Statistical Manual of Mental Disorders.
-
- Bates D., Maechler M., Bolker B. 2012. lme4: Linear Mixed-Effects Models Using S4 Classes.
Publication types
MeSH terms
LinkOut - more resources
Full Text Sources
Other Literature Sources
Medical
