

Optic neuropathy and increased retinal glial fibrillary acidic protein due to microbead-induced ocular hypertension in the rabbit
- PMID: 28003971
- PMCID: PMC5154984
- DOI: 10.18240/ijo.2016.12.05
Optic neuropathy and increased retinal glial fibrillary acidic protein due to microbead-induced ocular hypertension in the rabbit
Abstract
Aim: To characterize whether a glaucoma model with chronic elevation of the intraocular pressure (IOP) was able to be induced by anterior chamber injection of microbeads in rabbits.
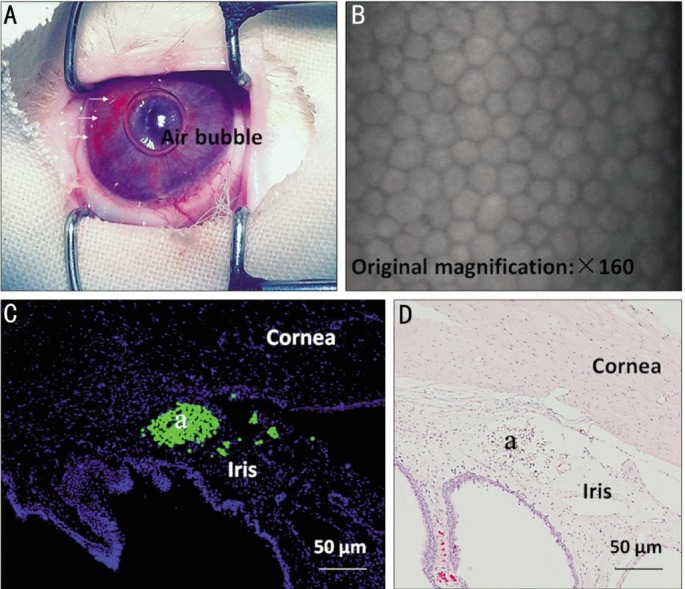
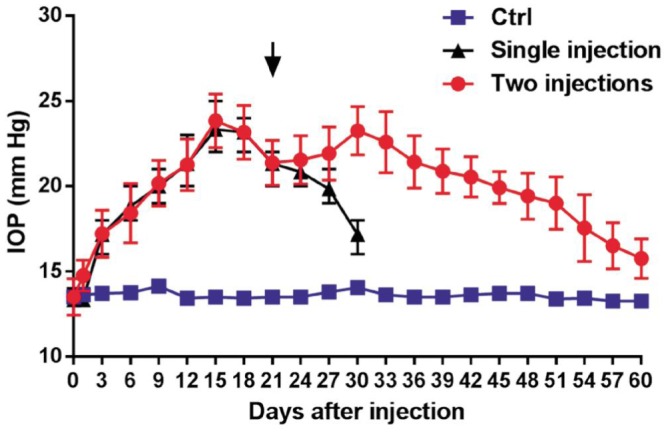
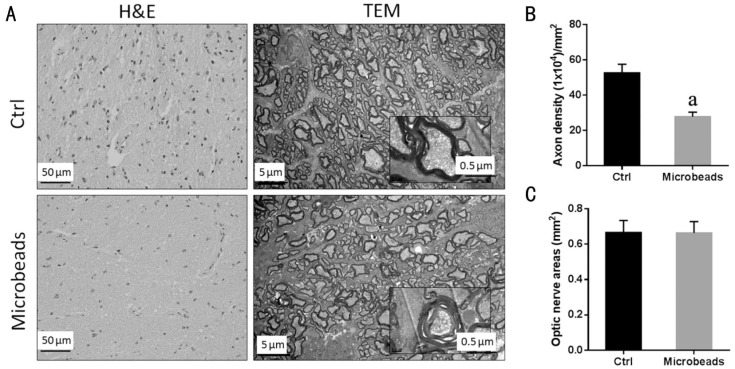
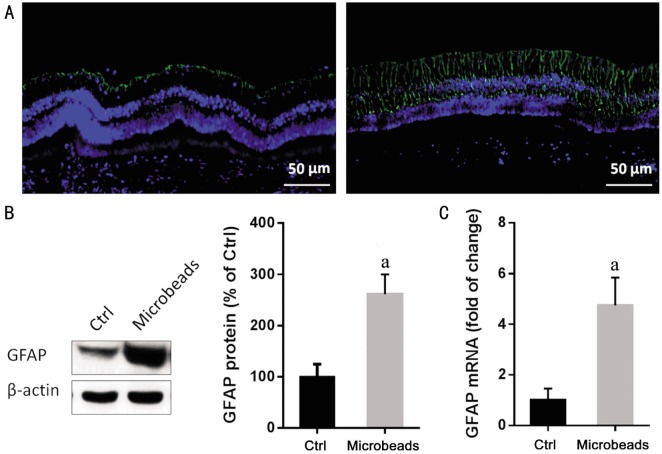
Methods: In order to screen the optimal dose of microbead injection, IOP was measured every 3d for 4wk using handheld applanation tonometer after a single intracameral injection of 10 µL, 25 µL, 50 µL or 100 µL microbeads (5×10⁶ beads/mL; n=6/group) in New Zealand White rabbits. To prolong IOP elevation, two intracameral injections of 50 µL microbeads or phosphate buffer saline (PBS) were made respectively at days 0 and 21 (n=24/group). The fellow eye was not treated. At 5wk after the second injection of microbeads or PBS, bright-field microscopy and transmission electron microscopy (TEM) were used to assess the changes in the retina. The expression of glial fibrillary acidic protein (GFAP) in the retina was evaluated by immunofluorescence, quantitative real-time polymerase chain reaction and Western blot at 5wk after the second injection of microbeads.
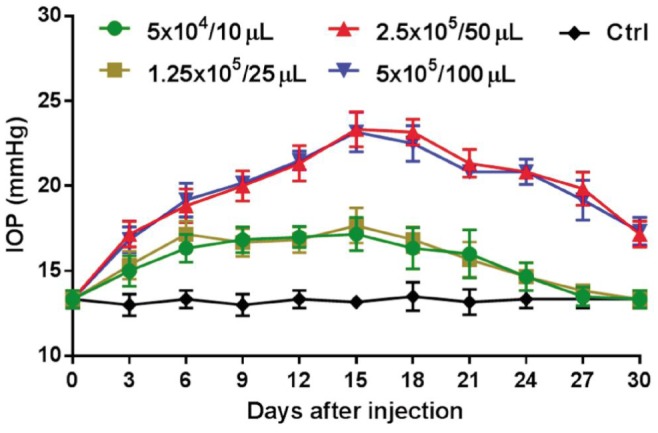
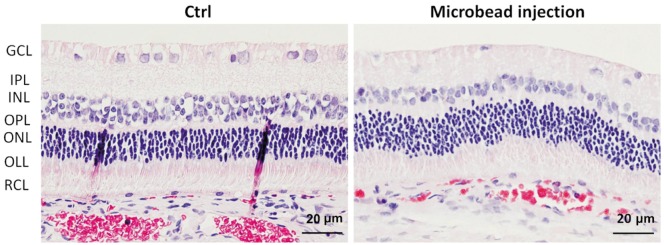
Results: Following a single intracameral injection of 10 µL, 25 µL, 50 µL or 100 µL microbead, IOP levels showed a gradual increase and a later decrease over a 4wk period after a single injection of microbead into the anterior chamber of rabbits. A peak IOP was observed at day 15 after injection. No significant difference in peak value of IOP was found between 10 µL and 25 µL groups (17.13±1.25 mm Hg vs 17.63±0.74 mm Hg; P=0.346). The peak value of IOP from 50 µL group (23.25±1.16 mm Hg) was significantly higher than 10 µL and 25 µL groups (all P<0.05). Administration of 100 µL microbead solution (23.00±0.93 mm Hg) did not lead to a significant increase in IOP compared to the 50 µL group (P=0.64). A prolonged elevated IOP duration up to 8wk was achieved by administering two injections of 50 µL microbeads (20.48±1.21 mm Hg vs 13.60±0.90 mm Hg in PBS-injected group; P<0.05). The bright-field and TEM were used to assess the changes of retinal ganglion cells (RGCs). Compared with PBS-injected group, the extended IOP elevation was associated with the degeneration of optic nerve, the reduction of RGC axons (47.16%, P<0.05) and the increased GFAP expression in the retina (4.74±1.10 vs 1.00±0.46, P<0.05).
Conclusion: Two injections of microbeads into the ocular anterior chamber of rabbits lead to a prolonged IOP elevation which results in structural abnormality as well as loss in RGCs and their axons without observable ocular structural damage or inflammatory response. We have therefore established a novel and practical model of experimental glaucoma in rabbits.
Keywords: glial fibrillary acidic protein; microbead; ocular hypertension; optic neuropathy; rabbit.
Figures
Similar articles
-
Establishment of an experimental glaucoma animal model: A comparison of microbead injection with or without hydroxypropyl methylcellulose.Exp Ther Med. 2017 Sep;14(3):1953-1960. doi: 10.3892/etm.2017.4728. Epub 2017 Jul 9. Exp Ther Med. 2017. PMID: 28962109 Free PMC article.
-
Optic neuropathy due to microbead-induced elevated intraocular pressure in the mouse.Invest Ophthalmol Vis Sci. 2011 Jan 5;52(1):36-44. doi: 10.1167/iovs.09-5115. Invest Ophthalmol Vis Sci. 2011. PMID: 20702815 Free PMC article.
-
Rat chronic glaucoma model induced by intracameral injection of microbeads suspended in sodium sulfate-sodium hyaluronate.Jpn J Ophthalmol. 2014 May;58(3):290-7. doi: 10.1007/s10384-014-0311-y. Epub 2014 Mar 11. Jpn J Ophthalmol. 2014. PMID: 24610540
-
Chronic ocular hypertensive rat model using microbead injection: comparison of polyurethane, polymethylmethacrylate, silica and polystyene microbeads.Curr Eye Res. 2014 Sep;39(9):917-27. doi: 10.3109/02713683.2014.884597. Epub 2014 Mar 3. Curr Eye Res. 2014. PMID: 24588104
-
[A challenge to primary open-angle glaucoma including normal-pressure. Clinical problems and their scientific solution].Nippon Ganka Gakkai Zasshi. 2012 Mar;116(3):233-67; discussion 268. Nippon Ganka Gakkai Zasshi. 2012. PMID: 22568103 Review. Japanese.
Cited by
-
Glaucoma animal models in rabbits: State of the art and perspectives-A review.Animal Model Exp Med. 2025 Mar;8(3):429-440. doi: 10.1002/ame2.12565. Epub 2025 Feb 6. Animal Model Exp Med. 2025. PMID: 39913189 Free PMC article. Review.
-
Comment on: Optic neuropathy and increased retinal glial fibrillary acidic protein due to microbead-induced ocular hypertension in the rabbit.Int J Ophthalmol. 2023 Jun 18;16(6):992-994. doi: 10.18240/ijo.2023.06.25. eCollection 2023. Int J Ophthalmol. 2023. PMID: 37332554 Free PMC article. No abstract available.
-
Ultrasound Targeted Microbubble Destruction Promotes the Therapeutic Effect of HUMSC Transplantation on Glaucoma-Caused Optic Nerve Injury in Rabbits.Transl Vis Sci Technol. 2022 May 2;11(5):12. doi: 10.1167/tvst.11.5.12. Transl Vis Sci Technol. 2022. PMID: 35575776 Free PMC article.
-
Testing Visual Function by Assessment of the Optomotor Reflex in Glaucoma.Methods Mol Biol. 2025;2858:219-227. doi: 10.1007/978-1-0716-4140-8_18. Methods Mol Biol. 2025. PMID: 39433679
-
Activation of the ROCK/MYLK Pathway Affects Complex Molecular and Morphological Changes of the Trabecular Meshwork Associated With Ocular Hypertension.Invest Ophthalmol Vis Sci. 2024 Aug 1;65(10):17. doi: 10.1167/iovs.65.10.17. Invest Ophthalmol Vis Sci. 2024. PMID: 39115865 Free PMC article.
References
-
- Kim KE, Jeoung JW, Kim DM, Ahn SJ, Park KH, Kim SH. Long-term follow-up in preperimetric open-angle glaucoma: progression rates and associated factors. Am J Ophthalmol. 2015;159(1):160–168.e1-2. - PubMed
-
- Singh K, Shrivastava A. Intraocular pressure fluctuations: how much do they matter? Curr Opin Ophthalmol. 2009;20(2):84–87. - PubMed
-
- Coleman AL, Miglior S. Risk factors for glaucoma onset and progression. Surv Ophthalmol. 2008;53 Suppl1:S3–10. - PubMed
-
- Carter-Dawson L, Crawford ML, Harwerth RS, Smith EL, Feldman R, Shen FF, Mitchell CK, Whitetree A. Vitreal glutamate concentration in monkeys with experimental glaucoma. Invest Ophthalmol Vis Sci. 2002;43(8):2633–2637. - PubMed
LinkOut - more resources
Full Text Sources
Other Literature Sources
Miscellaneous