. 2017 Apr;18(2):247-261.
doi: 10.1007/s10162-016-0607-3. Epub 2016 Dec 21.

Quantitative Analysis of Aquaporin Expression Levels during the Development and Maturation of the Inner Ear

Affiliations

Quantitative Analysis of Aquaporin Expression Levels during the Development and Maturation of the Inner Ear

Takushi Miyoshi et al. J Assoc Res Otolaryngol. 2017 Apr.

Abstract

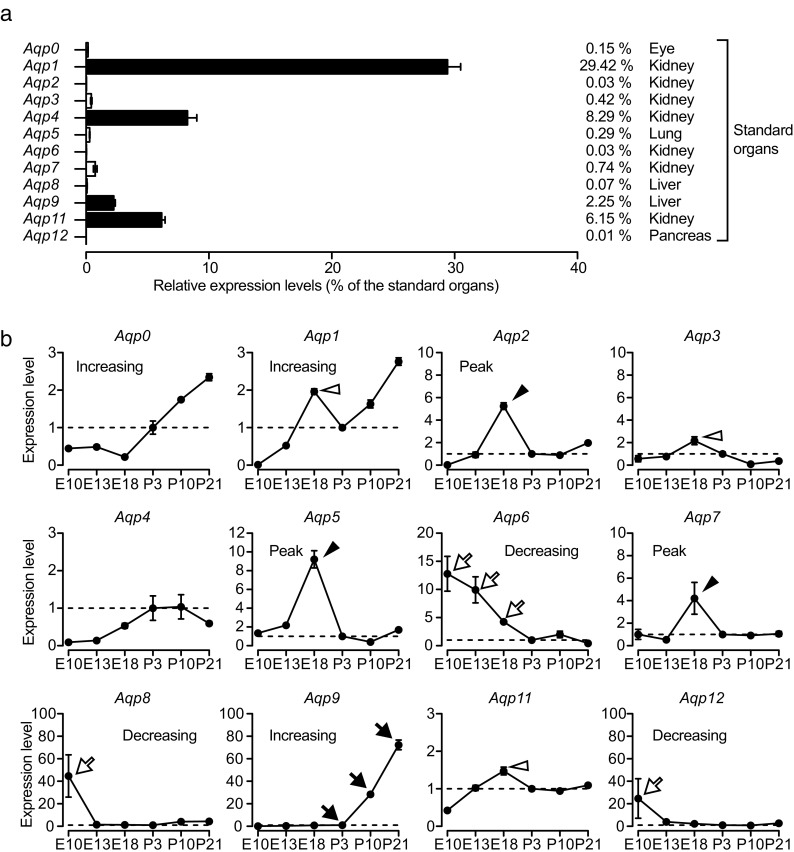
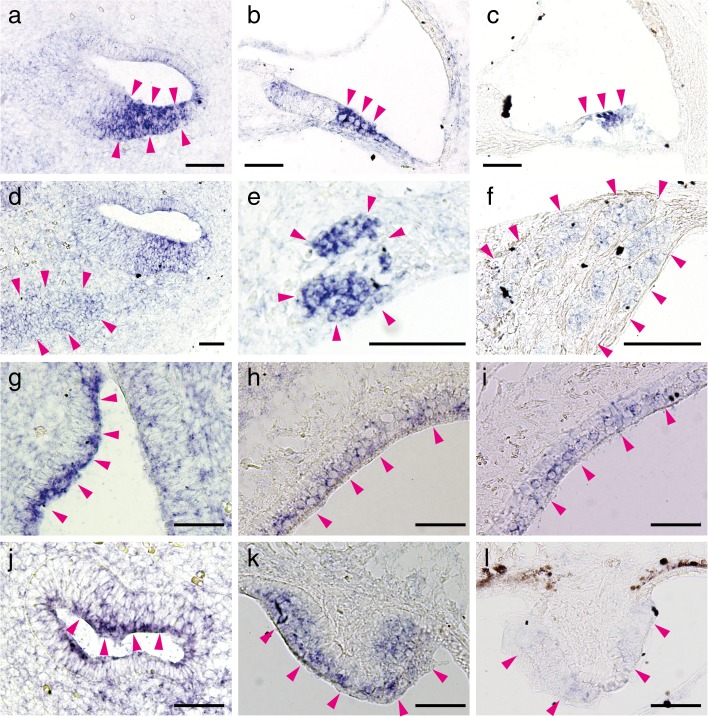
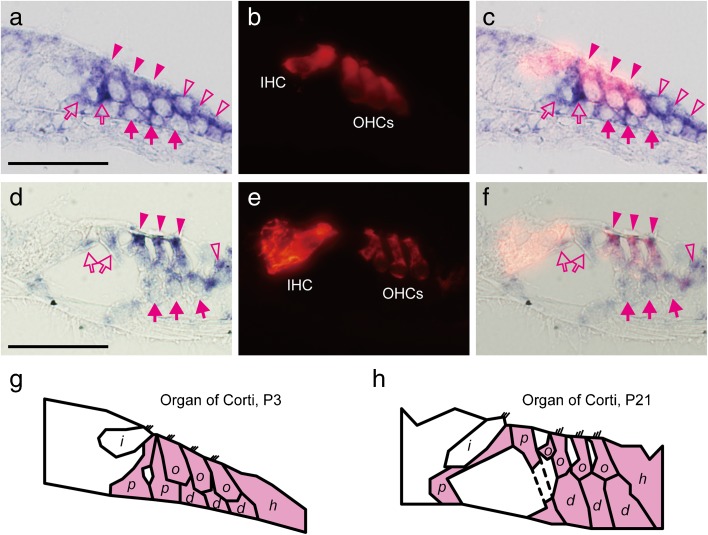
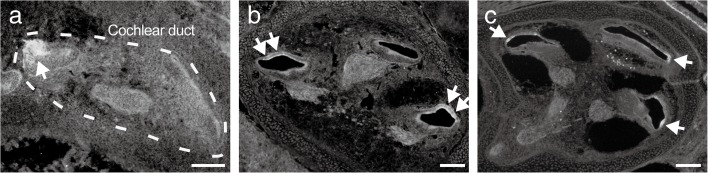
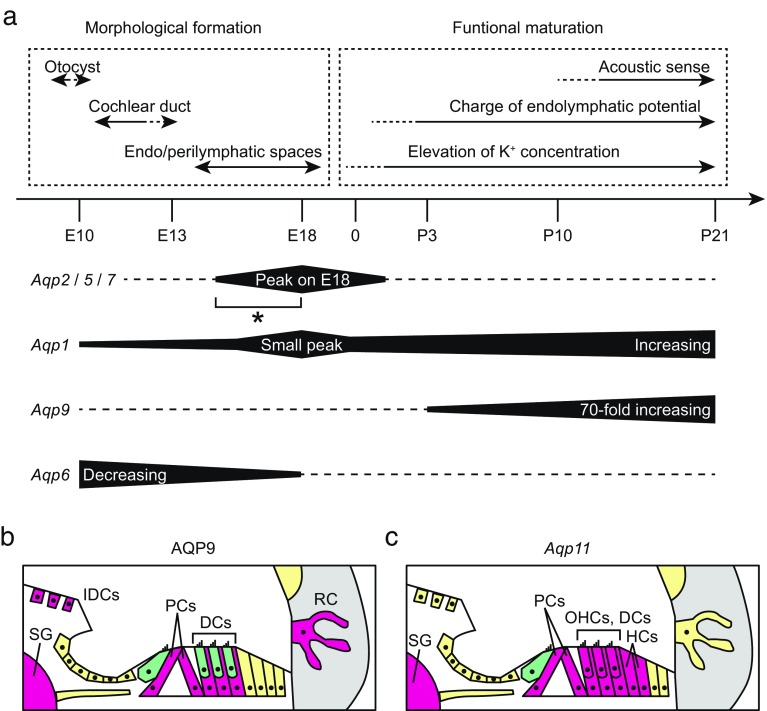
Aquaporins (AQPs) are a family of small membrane proteins that transport water molecules across the plasma membrane along the osmotic gradient. Mammals express 13 subtypes of AQPs, including the recently reported "subcellular AQPs", AQP11 and 12. Each organ expresses specific subsets of AQP subtypes, and in the inner ear, AQPs are essential for the establishment and maintenance of two distinct fluids, endolymph and perilymph. To evaluate the contribution of AQPs during the establishment of inner ear function, we used quantitative reverse transcription polymerase chain reaction to quantify the expression levels of all known AQPs during the entire development and maturation of the inner ear. Using systematic and longitudinal quantification, we found that AQP11 was majorly and constantly expressed in the inner ear, and that the expression levels of several AQPs follow characteristic longitudinal patterns: increasing (Aqp0, 1, and 9), decreasing (Aqp6, 8, and 12), and peak of expression on E18 (Aqp2, 5, and 7). In particular, the expression level of Aqp9 increased by 70-fold during P3-P21. We also performed in situ hybridization of Aqp11, and determined the unique localization of Aqp11 in the outer hair cells. Immunohistochemistry of AQP9 revealed its localization in the supporting cells inside the organ of Corti, and in the root cells. The emergence of AQP9 expression in these cells was during P3-P21, which was coincident with the marked increase of its expression level. Combining these quantification and localization data, we discuss the possible contributions of these AQPs to inner ear function.

Keywords: aquaporin; development; inner ear; qRT-PCR.


Conflict of interest statement

The authors declare no conflict of interest associated with this manuscript.

Figures

FIG. 1
FIG. 1
Quantitative analysis of AQP expression levels in the inner ear using qRT-PCR. (a) The approximate expression levels in mature inner ears (on P21) were evaluated by calculating the ratios of expression levels to the standard organs. The expression levels of Aqp1, 4, 9, and 11 were greater than 1 % of those in the standard organs (filled bars), followed by Aqp0, 3, 5, and 7 (0.1–1 %), and Aqp2, 6, 8, and 12 (less than 0.1 %). Sample numbers were 4 for all AQPs, and error bars indicate standard errors. (b) The expression levels were tracked longitudinally for all AQP subtypes during E10–P21. For each subtype, the average expression level on P3 was used as the standard (set to 1.0), and the relative expression level was plotted on the y-axis for each time point. Several AQP subtypes showed a characteristic pattern in their expression change: increasing (Aqp0, 1, and 9), decreasing (Aqp6, 8, and 12), and peak formation (Aqp2, 5, and 7). In particular, Aqp9 showed a 70-fold increase during P3–P21 (arrows), and Aqp6 expression gradually decreased during E10–E18 (open arrows). The expression levels of Aqp2, 5, and 7 peaked on E18 (arrowheads; 5-, 9-, and 4-fold increase compared to P3, respectively). Small expression peaks were also observed for Aqp1, 3, and 11 (open arrowheads). Sample numbers were 2 for E10, 3 for E13, and 4 for E18–P21. Error bars indicate the standard errors.
FIG. 2
FIG. 2
In situ hybridization for Aqp11 mRNA on E13 (a, d, g, and j), P3 (b, e, h, and k), and P21 (c, f, i, and l). The localizations of Aqp11 mRNA in the cochleae (a–f) and vestibules (g–l) are shown. Signals of P21 samples (c, f, i, and l) were weaker than those on P3 (b, e, h, and k) since P21 tissues required 3 days of decalcification before preparing frozen sections. In the cochleae on P3 and P21, the organs of Corti (b and c, arrowheads), and spiral ganglia (e and f, arrowheads) expressed Aqp11. In the vestibules on P3 and P21, Aqp11 was expressed in the sensory epithelia of the otolithic organs (h and i, arrowheads, saccules are shown) and semicircular canals (k and l., arrowheads). Similar localization was observed on E13 (a, d, g, and j). In the E13 cochlear duct, intense expression was observed in the future organ of Corti (a, arrowheads), and primitive spiral ganglion area (d, arrowheads). In the vestibular duct on E13, intense expression was observed in the future sensory epithelia of the otolithic organ (g, arrowheads) and the crista ampullaris of the semicircular canal (j, arrowheads). Bars indicate 50 μm.
FIG. 3
FIG. 3
Detailed distribution of Aqp11 mRNA in the organs of Corti on P3 (a–c) and P21 (d–f). In situ hybridization for Aqp11 (a and d), immunohistochemistry for Myo7a (b and e), and merged images (c and f) are shown. Schematic illustrations indicate cells expressing Aqp11 on P3 (g) and P21 (h). On P3 (a–c) and P21 (d–f), Aqp11 mRNA was detected in the OHCs (magenta arrowheads), pillar cells (magenta open arrows), Deiter’s cells (magenta arrows), and Hensen’s cells (magenta open arrowheads), as schematically illustrated (g and h). Abbreviations: i, IHC; o, OHC; p, pillar cell; d, Deiter’s cell; h, Hensen’s cells. Bars indicate 50 μm.
FIG. 4
FIG. 4
Auditory brainstem response (ABR) measurement of Aqp11 −/− and wild-type mice at 3–4 weeks. ABR thresholds were determined using click stimulations, and compared between Aqp11 −/− (KO, filled circles) and wild-type (WT, open circles). The average ABR thresholds were 42.1 and 55 dB, which were similar between KO and WT without any statistically significant difference (by Welch’s test, p = 0.15). Bars indicate standard errors.
FIG. 5
FIG. 5
Representative waveform data of auditory brainstem response (ABR) measurement for Aqp11 −/− (KO) and wild-type (WT) used in Fig. 4. Waves I–V were identified and indexed by the characters I–V. The thresholds were determined using wave I, and were 40 dB for both KO and WT. Vertical bars indicate 2 μV.
FIG. 6
FIG. 6
Localization change of AQP9 expression in the cochleae during P3–P21. Fluorescent images of anti-AQP9 immunohistochemistry on P3 (a), P10 (b), and P21 (c) are shown. Initially on P3 (a), AQP9 was expressed in the organ of Corti (asterisk) and root cells (double asterisk). On P10 (b), intense expression emerged in the interdental cells (arrows) and spiral ganglion (arrowheads), which continued on P21 (c, arrows and arrowheads). Bars indicate 50 μm.
FIG. 7
FIG. 7
Detailed localization change of AQP9 expression in the organs of Corti during P3–P21. Z-stack images of confocal microscopy are shown. AQP9 localization was compared to β-III tubulin (Tuj-1) on P3 (a–c), P10 (d–f), and P21 (g–i). Positions of the IHCs and OHCs are indicated by the characters, i and o, respectively. On P3 (a–c), AQP9 was expressed in the afferent neurons beneath the IHCs and OHCs (a and b, open and filled yellow arrowheads, respectively). On P10 (d–f), expression of AQP9 in these afferent neurons was sustained but became weaker (d and e, open and filled yellow arrowheads). Instead, outer pillar cells started with intense AQP9 expression (d, open yellow arrows). On P21 (g–i), intense expression emerged in the inner pillar cells (g, filled yellow arrow) in addition to the outer pillar cells (g, open yellow arrows). Expression in the afferent neurons was not observed, and instead, AQP9 was detected in the Deiter’s cells without co-localization with afferent neurons (h, open and filled yellow arrowheads). The cups (g, filled magenta arrowheads) and phalangeal processes (g, open magenta arrowheads) of Deiter’s cells are indicated. Bars indicate 20 μm.
FIG. 8
FIG. 8
Comparison of AQP9 localization to phalloidin (Ph) and myosin 7a (Myo7a) localization in the P21 organ of Corti. The localization of AQP9 in the inner and outer pillar cells were co-localized with phalloidin staining of these cells (a and b, arrows and open arrows, respectively). AQP9 was detected in the Deiter’s cups (a and b, filled arrowheads) beneath the OHCs and in the phalangeal processes (a, open arrowheads) between the OHCs. Bars indicate 20 μm.
FIG. 9
FIG. 9
Expansion of AQP5 expressing cells along the cochlear duct during E13–E18. Fluorescent images of anti-AQP5 immunohistochemistry on E13 (a), E15 (b), and E18 (c) are shown. On E13 (a), AQP5 expression was limited to the lateral wall of the basal turn (arrow). AQP5 expressing cells expanded toward the apical turn on E15 (b, arrows), and reached the apical turn on E18 (c, arrows). Bars indicate 50 μm.
FIG. 10
FIG. 10
(a) The time course of the inner ear development and longitudinal AQP expression levels are summarized. The expression levels of Aqp2, 5, and 7 peaked on E18 (asterisk), which was coincident with the emergence of the endolymphatic and perilymphatic space. The expression level of Aqp1 increased during the entire development with a small expression peak on E18. The 70-fold increase of Aqp9 occurred over a shorter time frame, P3–P21, which was coincident with elevation of K+ and charge of endolymphatic potential. Gradual decrease of Aqp6 occurred in the early stages of development. (b) Immunohistochemistry of AQP9 in the mature cochlea (P21) is illustrated. Cells expressing AQP9 are filled with magenta. AQP9 were expressed in the interdental cells (IDCs), pillar cells (PCs), Deiter’s cells (DCs), root cells (RCs), and spiral ganglion (SG). (c) ISH of Aqp11 mRNA in the mature cochlea (P21) is shown. Cells expressing Aqp11 are filled with magenta. Aqp11 was expressed in the OHCs, PCs, DCs, Hensen’s cells (HCs), and SG, but not in the IHCs.

Similar articles

Cited by

References

    1. Ashmore J, Gale J. The cochlear amplifier. Current biology: CB. 2004;14:R403–R404. doi: 10.1016/j.cub.2004.05.025. - DOI - PubMed
    1. Ashmore JF. A fast motile response in Guinea-pig outer hair cells: the cellular basis of the cochlear amplifier. J Physiol. 1987;388:323–347. doi: 10.1113/jphysiol.1987.sp016617. - DOI - PMC - PubMed
    1. Badaut J, Regli L. Distribution and possible roles of aquaporin 9 in the brain. Neuroscience. 2004;129:971–981. doi: 10.1016/j.neuroscience.2004.06.035. - DOI - PubMed
    1. Badaut J, Petit JM, Brunet JF, Magistretti PJ, Charriaut-Marlangue C, Regli L. Distribution of aquaporin 9 in the adult rat brain: preferential expression in catecholaminergic neurons and in glial cells. Neuroscience. 2004;128:27–38. doi: 10.1016/j.neuroscience.2004.05.042. - DOI - PubMed
    1. Calamita G, Ferri D, Gena P, Liquori GE, Cavalier A, Thomas D, Svelto M. The inner mitochondrial membrane has aquaporin-8 water channels and is highly permeable to water. J Biol Chem. 2005;280:17149–17153. doi: 10.1074/jbc.C400595200. - DOI - PubMed

LinkOut - more resources