. 2016 Dec 22:7:13817.
doi: 10.1038/ncomms13817.

Hepcidin inhibits Smad3 phosphorylation in hepatic stellate cells by impeding ferroportin-mediated regulation of Akt

Affiliations

Hepcidin inhibits Smad3 phosphorylation in hepatic stellate cells by impeding ferroportin-mediated regulation of Akt

Chang Yeob Han et al. Nat Commun. .

Abstract

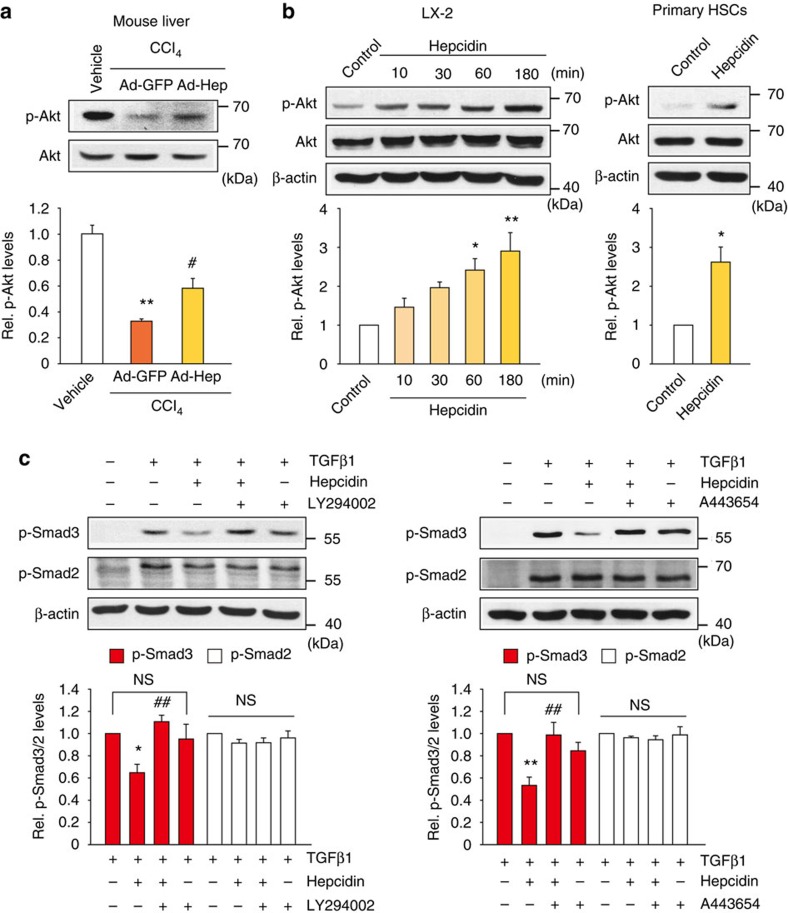
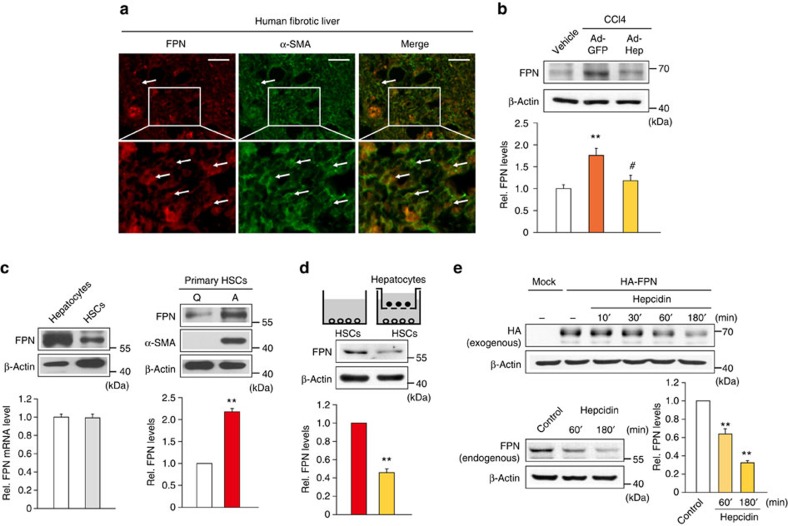
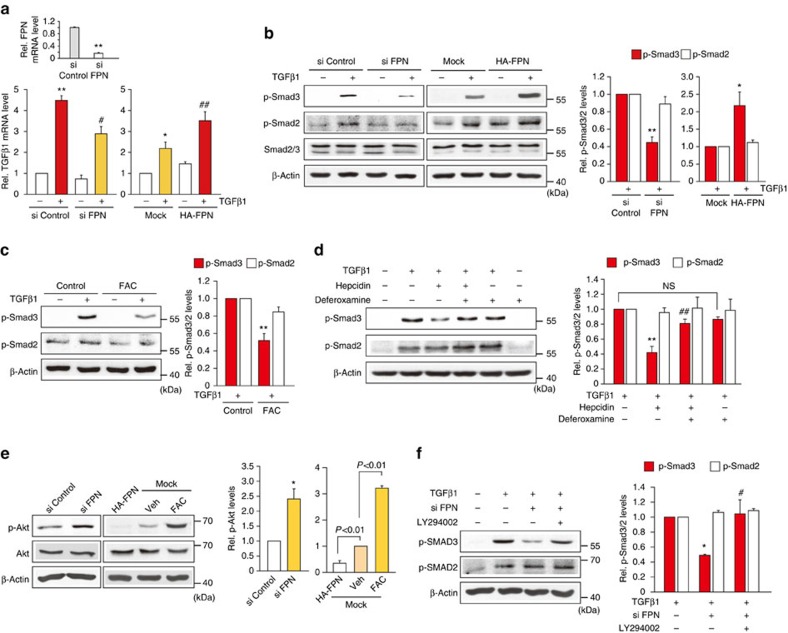
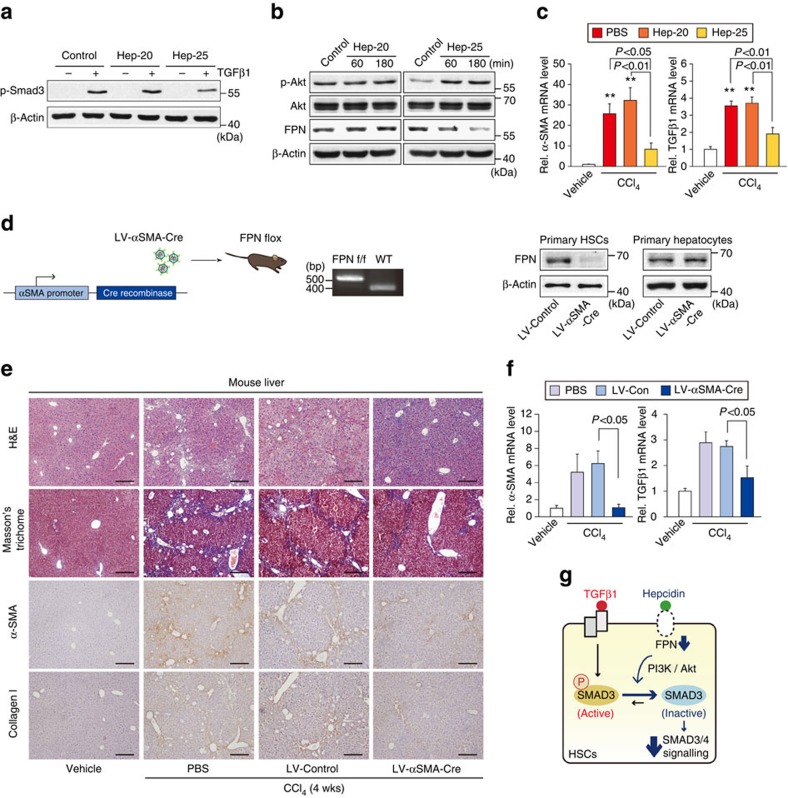
Hepatic stellate cell (HSC) activation on liver injury facilitates fibrosis. Hepatokines affecting HSCs are largely unknown. Here we show that hepcidin inhibits HSC activation and ameliorates liver fibrosis. We observe that hepcidin levels are inversely correlated with exacerbation of fibrosis in patients, and also confirm the relationship in animal models. Adenoviral delivery of hepcidin to mice attenuates liver fibrosis induced by CCl4 treatment or bile duct ligation. In cell-based assays, either hepcidin from hepatocytes or exogenous hepcidin suppresses HSC activation by inhibiting TGFβ1-mediated Smad3 phosphorylation via Akt. In activated HSCs, ferroportin is upregulated, which can be prevented by hepcidin treatment. Similarly, ferroportin knockdown in HSCs prohibits TGFβ1-inducible Smad3 phosphorylation and increases Akt phosphorylation, whereas ferroportin over-expression has the opposite effect. HSC-specific ferroportin deletion also ameliorates liver fibrosis. In summary, hepcidin suppresses liver fibrosis by impeding TGFβ1-induced Smad3 phosphorylation in HSCs, which depends on Akt activated by a deficiency of ferroportin.


Conflict of interest statement

S.R. is a consultant for Isis, Bayer A.G., Merganser Biotech and Novartis Pharmaceuticals. He also holds an equity/ownership interest in Merganser Biotech and is a co-inventor for patents US8058061 B2 C12N 20111115 and US7541179 B2 C12N 20090602 about the generation of lentiviral vectors for the cure of hemoglobinopathies. The remaining authors declare no competing interests.

Figures

Figure 1
Figure 1. Inverse correlation between hepcidin expression and the severity of liver fibrosis.
(a,b) Immunohistochemistry (IHC) and qRT–PCR assays for hepcidin in fibrosis patients. IHC for human hepcidin, hematoxylin–eosin (H&E) and Masson's trichrome stainings on the liver sections from representative patients with mild or severe fibrosis. Asterisks indicate ballooning degeneration of hepatocytes, whereas arrowheads do inflammatory cell infiltration. Thin arrows represent eosinophilic necrosis of hepatocyte, whereas arrows do fibrosis in portal area (scale bar, 100 μm). Ishak fibrosis scores, Knodell's histological activity index and collagen area had been previously determined for the samples. Statistical significance of the differences between mild and severe fibrosis (or hepcidin median low and high groups) was analysed using unpaired two-sample Student's t-test (N=20 each). (c) Transcript levels of hepcidin, α-SMA and TGFβ1 in healthy individuals or cirrhosis patients (GSE25097), and the inverse correlation of hepcidin mRNA with either α-SMA or TGFβ1 mRNA. Data were shown as box and whisker plot. Box, interquartile range; whiskers, 5–95 percentiles; horizontal line within box, median. Statistical significance of the differences between healthy individuals and cirrhosis patients was determined by unpaired two-sample Student's t-test (N=6 or 40 each). (d) IHC for hepcidin using anti-mouse hepcidin antibody and H&E staining on the liver sections from representative mice treated with vehicle or CCl4 (0.6 ml kg−1 body weight, i.p., twice a week, for 6 weeks). Asterisks indicate widespread swelling of hepatocytes, whereas an arrow does hepatic necrosis and an arrowhead represents inflammatory cell infiltration (scale bar, 100 μm). (e) Hepcidin and α-SMA transcript levels in the mice treated as above. Data represent the mean±s.e.m. (N=3 or 4). Statistical significance of the differences between each treatment and vehicle group (**P<0.01) was determined by unpaired two-sample Student's t-test.
Figure 2
Figure 2. Inhibition of CCl4-induced liver fibrosis by hepcidin.
(a) Hepatic hepcidin transcript levels in mice treated with vehicle or CCl4 (0.6 ml kg−1 body weight, i.p., twice a week, for 6 weeks) in combination with tail vein injection of PBS, Ad-GFP or Ad-Hep (N=5 or 6). Details for treatment schedule are provided in the Methods section. (b) H&E, Masson's trichrome stainings and IHC for α-SMA or collagen type 1 were done on the liver tissues of mice treated as above (scale bar, 100 μm). Representative images derived from replicate experiments (N=3 each) were shown. (c) qRT–PCR assays for α-SMA in the liver of mice as in a. (d) Collagen content was measured by biochemical determination of hydroxyproline (per mg of liver) in the liver of mice as in a. (e) qRT–PCR assays for TGFβ1 in the liver of mice as in a. (f) Liver function was assessed by ALT, AST and LDH activities in serum of mice as in a. For a and cf, data represent the mean±s.e.m. Statistical significance of the differences between each treatment group and vehicle (*P<0.05, **P<0.01) was determined by analysis of variance (Bonferroni's or LSD method).
Figure 3
Figure 3. Inhibition of BDL-induced liver fibrosis by hepcidin.
(a) H&E, Masson's trichrome stainings and IHC for α-SMA or collagen type 1 were done on the liver tissues of mice operated with sham or BDL (for 2 weeks) in combination with tail vein injection of Ad-GFP or Ad-Hep (N=5 or 6; scale bar, 100 μm). Details for treatment schedule are provided in the Methods section. Representative images derived from replicate experiments (N=3 each) were shown. (b) qRT–PCR assays for α-SMA in the liver of mice as in a. (c) Determination of hydroxyproline content in the liver of mice as in a. (d) qRT–PCR assays for TGFβ1 in the liver of mice as in a. For bd, data represent the mean±s.e.m. (N=5 or 6). Statistical significance of the differences between each treatment group and sham (*P<0.05, **P<0.01), or BDL+Ad-GFP (#P<0.05, ##P<0.01) was determined by analysis of variance (Bonferroni's method).
Figure 4
Figure 4. Inhibition of HSC activation and TGFβ1 effect by hepcidin.
(a) Hepcidin and plasminogen activator inhibitor 1 (PAI-1) mRNA levels in rat primary hepatocytes or rat primary HSCs. (b) Immunoblotting for α-SMA. HSCs freshly isolated from the rat were maintained in monoculture (lane 1), co-culture with hepatocytes in the presence of control IgG (lane 2) or anti-hepcidin polyclonal antibody (2 μg ml−1; lane 3) for 5 days. Data represent the mean±s.e.m. of three separate experiments. Statistical significance of the differences between each groups and HSCs alone (**P<0.01), or HSCs+Hepatocyte co-culture+Control IgG (#P<0.05) was determined by analysis of variance (ANOVA; Bonferroni's method). (c) Immunoblotting for α-SMA. Rat primary HSCs were cultured for 2 days, and then were daily treated with vehicle or 100 nM recombinant murine hepcidin for 3 days. Data represent the mean±s.e.m. of three separate experiments. Statistical significance of the differences between each treatment and vehicle group (**P<0.01) was determined by unpaired two-sample Student's t-test. (d) qRT–PCR assays for TGFβ1. LX-2 cells were exposed to recombinant human hepcidin for 3 h, and then continuously treated with 5 ng ml−1 TGFβ1 for additional 12 h. (e) qRT–PCR assays for Col-1A1, matrix metalloproteinase (MMP)-2, and MMP9. The cells were similarly treated as in d (hepcidin, 100 nM). (f) The effect of conditioned media (CM) collected from HepG2 cells deficient of hepcidin (siRNA). qRT–PCR assays were done on HepG2 cells transfected with control siRNA or hepcidin siRNA for 48 h (left) or LX-2 cells incubated with the respective medium collected from the HepG2 cells with or without TGFβ1 for 12 h (right). (g) qRT–PCR assays. The cells were similarly treated as in f except for 20 μM BMP6 treatment for 12 h (left). For a and dg, data represent the mean±s.e.m. of at least three separate experiments. Statistical significance of the differences between hepatocytes and HSCs (**P<0.01; unpaired two-sample Student's t-test), or between each treatment and control group (*P<0.05, **P<0.01) or TGFβ1 (##P<0.01) was determined by ANOVA (Bonferroni's or LSD method).
Figure 5
Figure 5. Inhibition of Smad3 phosphorylation in HSCs by hepcidin.
(a) Immunoblottings for p-Smad2/3 in the liver. Mice were treated with vehicle or CCl4 (0.6 ml kg−1 body weight, i.p., 24 h) 6 days after a tail vein injection of Ad-GFP or Ad-Hep. Details for treatment schedule are provided in the Methods section. Relative protein levels were assessed by scanning densitometry of the immunoblots. Data represent the mean±s.e.m. of at least three animals. Statistical significance of the differences between each treatment group and vehicle (*P<0.05), or CCl4+Ad-GFP (##P<0.01) was determined by analysis of variance (ANOVA ; Bonferroni's method; NS, not significant). (b) Immunoblottings for p-Smad2/3. LX-2 cells were exposed to 100 nM hepcidin for 3 h and continuously treated with 5 ng ml−1 TGFβ1 for 20 min. Data represent the mean±s.e.m. of three separate experiments. Statistical significance of the differences between each treatment and TGFβ1 group (**P<0.01) was determined by unpaired two-sample Student's t-test. (c) Immunoblottings for p-Smad3. Rat primary HSCs were treated as described in b. (d) Immunoprecipitation and immunoblotting assay. Smad4 was immunoblotted on p-Smad3 immunoprecipitates of LX-2 cells treated as in b (TGFβ1 treatment for 1 h). (e) Immunoblottings for nuclear Smad2/3. Nuclear and cytoplasmic fractions were prepared from LX-2 cells treated as in d. Immunoblotting for Lamin A/C confirms the purity of nuclear fractions and equal protein loading. For ce, data represent the mean±s.e.m. of three separate experiments. Statistical significance of the differences between each treatment and control group (*P<0.05) or TGFβ1 (#P<0.05) was determined by ANOVA (Bonferroni's method; NS, not significant).
Figure 6
Figure 6. The effect of hepcidin on Akt and its role in Smad3 inhibition.
(a) Immunoblotting for p-Akt. Akt phosphorylated at Thr308 and total Akt were immunoblotted on the liver homogenates of mice treated as described in Fig. 5a. Data represent the mean±s.e.m. of at least three animals. Statistical significance of the differences between each treatment group and vehicle (**P<0.01), or CCl4+Ad-GFP (#P<0.05) was determined by analysis of variance (ANOVA; LSD method). (b) Immunoblotting for p-Akt. LX-2 cells were treated with 100 nM hepcidin for the indicated times (left) or in rat primary HSCs incubated with hepcidin for 1 h (right). (c) Immunoblottings for p-Smad3 and p-Smad2. The cells were treated with hepcidin for 3 h and continuously incubated with 10 μM LY294002 or 1 μM A443654 for 10 min, followed by TGFβ1 treatment for 20 min. For b and c, data represent the mean±s.e.m. of three separate experiments. Statistical significance of the differences between each treatment groups (*P<0.05, **P<0.01) or TGFβ1+hepcidin (##P<0.01) was determined by ANOVA (Bonferroni's or LSD method; NS, not significant).
Figure 7
Figure 7. Hepcidin regulation of FPN in HSCs.
(a) Double immunofluorescence staining of FPN and α-SMA in a fibrotic liver section from patients as described in Fig. 1a. The proteins were stained with Cy3- and Alexa488-conjugated secondary antibodies, respectively. Arrows indicate co-localization of FPN and α-SMA in morphologically activated HSCs (scale bar, 50 μm). (b) FPN expression in the liver of mice treated as described in Fig. 5a. Data represent the mean±s.e.m. of at least three animals. Statistical significance of the differences between each treatment group and vehicle (**P<0.01), or CCl4+Ad-GFP (#P<0.05) was determined by analysis of variance (ANOVA; LSD method). (c) FPN expression in rat primary hepatocytes and rat primary HSCs (left), or in quiescent (freshly isolated, day 0) and activated (day 6 after culture) HSCs (right). (d) FPN expression in rat primary HSCs cultured alone or co-cultured with hepatocytes for 5 days. For c and d, data represent the mean±s.e.m. of three separate experiments. Statistical significance of the differences between quiescent (Q) and activated (A) HSCs in c (**P<0.01), and between HSCs alone and co-culture with hepatocytes in d (**P<0.01) was determined by unpaired two-sample Student's t-test. (e) Immunoblottings for HA-tagged or endogenous FPN. FPN was measured on the lysates of LX-2 cells transfected with Mock or HA-FPN, and treated with 100 nM hepcidin (upper), or of those treated with hepcidin for the indicated times (lower). Data represent the mean±s.e.m. of three separate experiments. Statistical significance of the differences between each treatment and control group (**P<0.01) was determined by ANOVA (Bonferroni's method).
Figure 8
Figure 8. The effects of FPN modulations on TGFβ1 signalling pathway.
(a) qRT–PCR assays for TGFβ1 after FPN modulations. LX-2 cells were transfected with control siRNA or FPN siRNA for 48 h (left), or with Mock or HA-FPN for 24 h (right), followed by TGFβ1 treatment for 12 h. Inset shows FPN knockdown. Data represent the mean±s.e.m. of at least three separate experiments. Statistical significance of the differences between each treatment and control group (*P<0.05, **P<0.01) or TGFβ1 (#P<0.05, ##P<0.01) was determined by analysis of variance (ANOVA; Bonferroni's or LSD method). (b) Immunoblottings for p-Smad2 and p-Smad3 in LX-2 cells transfected as in a (TGFβ1 treatment for 20 min). (c,d) Immunoblottings for p-Smad2 and p-Smad3. For c, LX-2 cells were exposed to ferric ammonium citrate (FAC, 10 μM) for 30 min and continuously treated with 5 ng ml−1 TGFβ1 for 20 min. For d, the cells were exposed to hepcidin for 3 h after deferoxamine treatment (100 μM for 3 h), and were treated with TGFβ1 as above. (e) Immunoblottings for p-Akt in LX-2 cells transfected as in a (left) or in the cells transfected with HA-FPN or Mock for 24 h. Mock-transfected cells were treated with vehicle or FAC for 30 min (right). Data represent the mean±s.e.m. of three separate experiments. Statistical significance of the differences between each treatment and control group (*P<0.05) was determined by unpaired two-sample Student's t-test. (f) Immunoblottings for p-Smad2/3. The cells were transfected with control siRNA or FPN siRNA and continuously exposed to LY294002 followed by TGFβ1 treatment for 20 min. For b and c, data represent the mean±s.e.m. of three separate experiments. Statistical significance of the differences between each treatment and TGFβ1 group (*P<0.05, **P<0.01) was determined by unpaired two-sample Student's t-test. For d and f, data represent the mean±s.e.m. of three separate experiments. Statistical significance of the differences between each treatment and TGFβ1 group (*P<0.05, **P<0.01) or TGFβ1+hepcidin (#P<0.05, ##P<0.01) was determined by ANOVA (Bonferroni's method).
Figure 9
Figure 9. Inhibition of liver fibrosis by HSC-specific deletion of FPN.
(a) Immunoblottings for p-Smad3. LX-2 cells were treated with 100 nM Hep-20 or Hep-25 for 3 h, and continuously treated with 5 ng ml−1 TGFβ1 for 20 min. (b) Immunoblottings for p-Akt and FPN in LX-2 cells treated with Hep-20 or Hep-25. (c) qRT–PCR assays for α-SMA and TGFβ1. Mice were treated with vehicle or CCl4 (0.6 ml kg−1 body weight, i.p., 24 h) 3 h after an intraperitoneal injection of 50 μg Hep-20 or Hep-25 (N=4 or 6 each). Details for treatment schedule are provided in the Methods section. (d) HSC-specific FPN knockout mouse model. FPN-floxed mice were treated with vehicle or CCl4 (0.6 ml kg−1 body weight, i.p., twice a week, for 4 weeks) after a tail vein injection of PBS, LV-Control or LV-αSMA-Cre (N=4 or 6 each). Details for treatment schedule are provided in the Methods section. Immunoblottings for FPN confirmed HSC-specific silencing of FPN. (e) H&E, Masson's trichrome stainings and IHC for α-SMA or collagen type 1 on the liver tissues of mice treated as in d (scale bar, 100 μm). (f) qRT–PCR assays for α-SMA and TGFβ1 in the liver of mice as in d. For c and f, data represent the mean±s.e.m (N=4 or 6). Statistical significance of the differences between each treatment group and vehicle (**P<0.01) was determined by analysis of variance (Bonferroni's or LSD method). (g) A proposed scheme illustrating the effect of hepcidin on FPN-mediated Smad3 activation in HSCs. Hepcidin inhibits TGFβ1-mediated Smad3 phosphorylation by degrading FPN in HSCs, which relies on Akt signalling. The inhibition of HSC response to TGFβ1 may contribute to anti-fibrotic effect of hepcidin.

References

    1. Mabuchi A. et al.. Role of hepatic stellate cell/hepatocyte interaction and activation of hepatic stellate cells in the early phase of liver regeneration in the rat. J. Hepatol. 40, 910–916 (2004). - PubMed
    1. Sawitza I., Kordes C., Reister S. & Haussinger D. The niche of stellate cells within rat liver. Hepatology 50, 1617–1624 (2009). - PubMed
    1. Coulouarn C. et al.. Hepatocyte-stellate cell cross-talk in the liver engenders a permissive inflammatory microenvironment that drives progression in hepatocellular carcinoma. Cancer Res. 72, 2533–2542 (2012). - PMC - PubMed
    1. Chen Y. et al.. Hedgehog controls hepatic stellate cell fate by regulating metabolism. Gastroenterology 143, 1319–1329.e11 (2012). - PMC - PubMed
    1. Hernandez-Gea V. & Friedman S. L. Pathogenesis of liver fibrosis. Annu. Rev. Pathol. 6, 425–456 (2011). - PubMed

Publication types

MeSH terms

LinkOut - more resources