. 2016 Dec 22:7:13864.
doi: 10.1038/ncomms13864.

Coupled ATPase-adenylate kinase activity in ABC transporters

Affiliations

Coupled ATPase-adenylate kinase activity in ABC transporters

Hundeep Kaur et al. Nat Commun. .

Abstract

ATP-binding cassette (ABC) transporters, a superfamily of integral membrane proteins, catalyse the translocation of substrates across the cellular membrane by ATP hydrolysis. Here we demonstrate by nucleotide turnover and binding studies based on 31P solid-state NMR spectroscopy that the ABC exporter and lipid A flippase MsbA can couple ATP hydrolysis to an adenylate kinase activity, where ADP is converted into AMP and ATP. Single-point mutations reveal that both ATPase and adenylate kinase mechanisms are associated with the same conserved motifs of the nucleotide-binding domain. Based on these results, we propose a model for the coupled ATPase-adenylate kinase mechanism, involving the canonical and an additional nucleotide-binding site. We extend these findings to other prokaryotic ABC exporters, namely LmrA and TmrAB, suggesting that the coupled activities are a general feature of ABC exporters.


Figures

Figure 1
Figure 1. Probing the catalytic activity of MsbA by real-time 31P-MAS NMR.
(a) Schematic experimental setup. MsbA is transferred quickly within the MAS rotor to the NMR magnet after addition of MgATP. The catalytic activity is followed by direct polarization 31P NMR. (b) Time-resolved spectra show the reduction of the ATP peak intensities (αP, βP and γP at −10.89, −20.48 and −6.22 p.p.m., respectively) and the increase of Pi (1.05 p.p.m.) and AMP (2.52 p.p.m.). The ADP resonance intensities (αP and βP at −10.68 and −7.4 p.p.m.) follow a biphasic time course with initial increase and subsequent decay (inset). (c) Addition of MgADP to MsbA proteoliposomes results in a reduction of the ADP resonances. The ratio of integral peak intensities of Pi/AMP approaches 2:1 in b and 1:1 in c.
Figure 2
Figure 2. Evidence for ATP synthesis by MsbA.
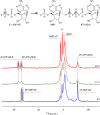
ADP-βS is converted into AMP and ATP-βSγS, a non-hydrolysable ATP analogue. The αP and βP chemical shifts of ADP-βS are observed at −11.5 and 33.7 p.p.m., respectively. With time, the ADP-βS signals decay and the formation of ATP-βSγS is observed with signals at −11.5, 34.22 and 36.25 p.p.m. corresponding to αP, βP and γP, respectively.
Figure 3
Figure 3. Proposed model for a coupled ATPase-AK reaction.
(a) Hydrolysis turns ATP into ADP and Pi, followed by conversion of both ADP into AMP and ATP. (b) This coupled catalytic activity results in 31P progress curves for each nucleotide species obtained by deconvoluting the data set in Fig. 1b. The observed integral peak intensities correspond to a stoichiometry of ATP at the beginning of the reaction AMP and Pi at the end of 1:1:2. (c) The progress curve for the consumption of ATP decays slower if ADP is added in excess in addition to ATP. (d) The ATPase activity of MsbA results in an initial positive slope of the ADP progress curve, whereas its kinase activity causes a decrease. The addition of excess AMP in addition to ATP has a small effect on the initial increase but significantly slows down ADP consumption. Full data sets for (c,d) are provided in Supplementary Fig. 11.
Figure 4
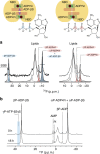
Figure 4. ADP.Vi-trapped MsbA with bound ADP-βS.
(a) Cross-polarized (CP) 31P-MAS NMR allows to observe bound ADP.Vi at −6.2 and −10.9 p.p.m. (right). Upon addition of excess of ADP-βS, an additional resonance at 34.5 p.p.m. corresponding to βP-ADP-βS is observed. Furthermore, the peak at −11.0 p.p.m. doubles because of the overlap of αP-ADP-βS and aP-ADP.Vi. Peak deconvolution reveals the same integral peak intensities for ADP-βS and ADP.Vi, indicative of a 1:1 stoichiometry. (b) Directly polarized 31P-MAS NMR spectra of MsbA in complex with ADP-βS and ADP.Vi shows that no γP-ATP-βSγS is produced as shown in Fig. 2. Spectra were recorded under the same conditions as described in the Methods. The nominal temperature in a was set to 260 K and in b to 270 K. SSB refers to spinning sideband.
Figure 5
Figure 5. Mutational analysis of the coupled ATPase-AK activity of MsbA.
(a) Visualization of the conserved NBD sequence motifs in the MsbA/AMP.PNP crystal structure (pdb: 3B60). The canonical binding sites and a second postulated binding sites are highlighted. Key residue K382 in Walker A is in close proximity to the nucleotide phosphate groups (top middle). In pfSMCNBD, the Q-loop glutamine was found coordinating binding of Ap5A indicative of a second binding site (top right, pdb: 3KTA). All single-point mutations are summarized in Table 1. (b) Progress curves of the 31P-AMP peak intensities demonstrate much reduced generation of AMP. The initial data points of Q424A are missing due to the experimental dead time. (c) Progress curves of the 31P-ADP peak intensities are sensitive to both the ATPase (positive slope) and kinase (negative slope) reactions. The mutation Q424A causes accelerated ADP generation (ATPase) but slower consumption (kinase) with respect to wild-type MsbA. The ADP consumption is even slower in case of K382A. The S482A and D505A mutations slow down both ATPase and kinase activity. The D512A mutation causes the slowest ADP generation, whereas no consumption of ADP could be seen on the time scale of the experiment. Experiments were done in triplicate with protein samples from different expressions each time.
Figure 6
Figure 6. Transport of Hoechst-33342 by MsbA into E. coli ISOVs probed by fluorescence spectroscopy.
(a) ISOVs containing MsbA show a concentration-dependent substrate transport for ATP. Upon addition of AMP, no transport is detected. However, increasing amounts of ADP also lead to transport. (b) ISOVs containing the MsbA K382A mutant show much slower but still ATP concentration-dependent transport. The effects in the presence of ADP are much less pronounced and within the range observed for ISOVs prepared from E. coli induced with an empty vector (c). The latter shows almost no ATP concentration-dependent transport. The small, observed effects could be because of the native E. coli ABC transporters and other proteins in the membrane of E. coli. All experiments were repeated in triplicate.
Figure 7
Figure 7. Time-resolved 31P-NMR spectra of LmrA and TmrAB in the presence of ATP reveal AMP formation as observed for MsbA.
(a) 31P-MAS NMR spectra of LmrA proteoliposomes (DMPC/DMPA) show that ATP and ADP are consumed over time to yield Pi and AMP, the latter being the kinase activity marker. (b) AMP formation is not observed in the Walker A Lysine deletion mutant LmrA-ΔK388. This spectrum, recorded at the end of the reaction, was reported by our lab before and is shown here only for comparison. The slightly different Pi chemical shifts in a,b are because of the choice of different buffers. (c) 31P-solution state NMR spectra of TmrAB in detergent micelles (DDM). At 341 K, formation of Pi and AMP is observed over time. The apparently reduced formation of AMP could be contributed to the heterodimeric nature of TmrAB and its lack of one canonical site for ATP hydrolysis.
Figure 8
Figure 8. Proposed cycle for coupling ATPase with adenylate kinase activities in MsbA.
Next to the canonical ATP-binding sites (site 1), two additional ADP-binding sites (site 2) are proposed involving Walker B and Q-loop of one and D-loop of the other NBD (Fig. 4a). This model allows suggesting a catalytic cycle with an ATP bound (1), ADP bound (2), ATP+ADP bound (3), ADP saturated (4) and finally ATP+AMP bound (5) state (see also Fig. 4 and Supplementary Fig. 7). The steps needed for the primary ATPase reaction as part of the normal catalytic cycle are highlighted.

Similar articles

Cited by

References

    1. Higgins C. F. ABC transporters: from microorganisms to man. Annu. Rev. Cell Biol. 8, 67–113 (1992). - PubMed
    1. Rees D. C., Johnson E. & Lewinson O. ABC transporters: the power to change. Nat. Rev. Mol. Cell Biol. 10, 218–227 (2009). - PMC - PubMed
    1. Higgins C. F. Multiple molecular mechanisms for multidrug resistance transporters. Nature 446, 749–757 (2007). - PubMed
    1. Tarling E. J., Vallim T. Q. & Edwards P. A. Role of ABC transporters in lipid transport and human disease. Trends Endocrinol. Metabol. 24, 342–350 (2013). - PMC - PubMed
    1. Dawson R. J. & Locher K. P. Structure of a bacterial multidrug ABC transporter. Nature 443, 180–185 (2006). - PubMed

Publication types

MeSH terms

LinkOut - more resources